Walmart (WMT) Has Rallied in 15 of 15 Aug-Apr Windows, Averaging Nearly 13% Gains
Walmart shares sit well below their 52-week high just as a historically powerful 237-day seasonal window approaches, putting rich expectations and volatility around earnings under a bright spotlight.
Price as of Aug 10, 2026: $112.66 (last close).
What is the seasonal pattern for Walmart (WMT)?
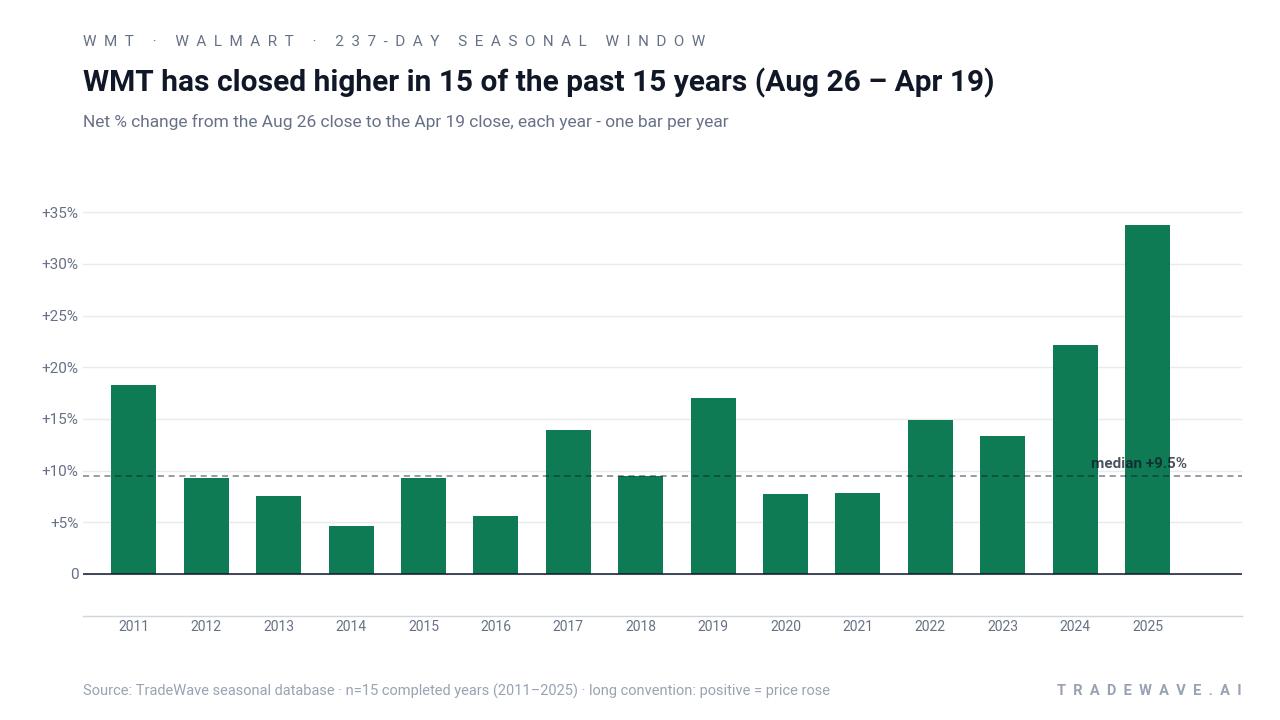
Walmart has risen in 15 of 15 years during the Aug 26 to Apr 19 window, with an average gain of 12.98% in winning years.
- 15 for 15 in this window, with Walmart averaging 12.98% gains across all winning years over the past 15 cycles.
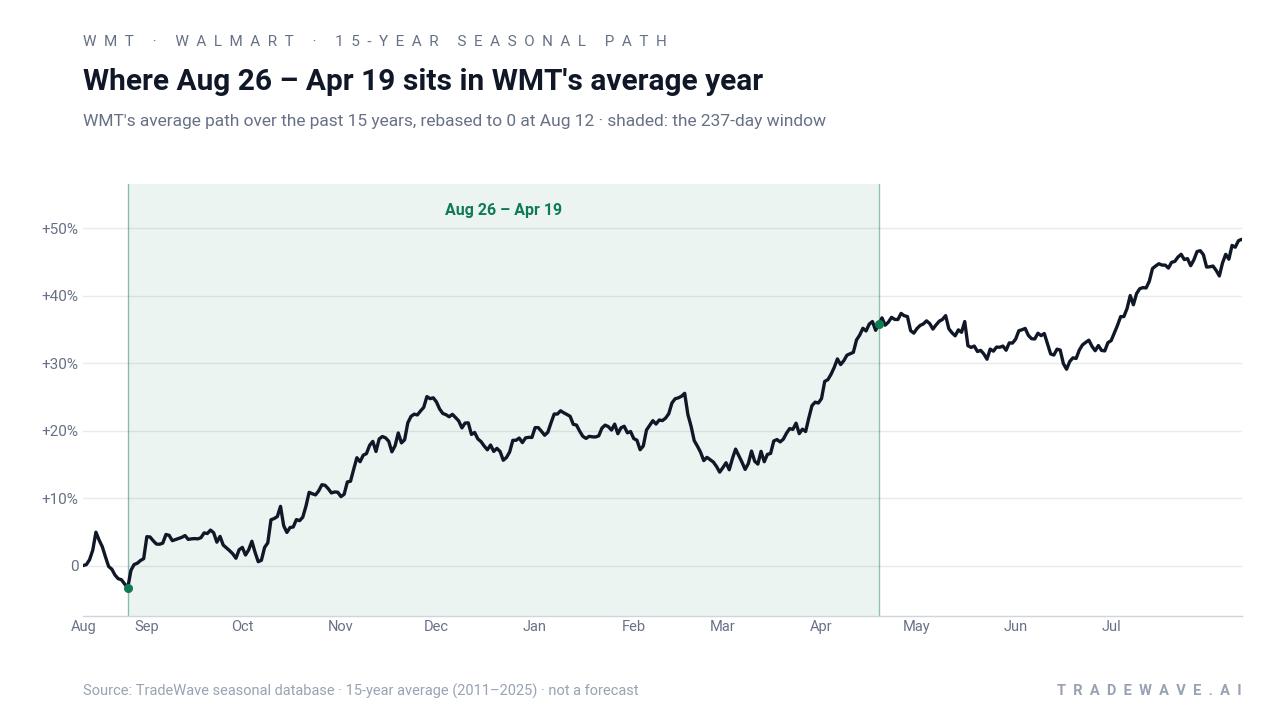
- The upcoming seasonal window starts on Aug 26 and runs 237 days through Apr 19, covering back-to-school, holiday and early spring trading.
- Percent Profitable is 100%, with 15 winners and 0 losers in the historical sample.
- Average winner gains of 12.98% stack into a 505% cumulative return when the window is repeated year after year.
- The TradeWave Ratio of 1.45 signals that price has typically traveled meaningfully in the long direction within the window, even before final outcomes.
- A Sharpe ratio of 1.37 for this stretch points to a historically strong risk-adjusted profile compared with many single-stock seasonal patterns.
According to historical data from TradeWave.ai, this late-August window has behaved very differently from an average stretch of the calendar for Walmart, and the next iteration is just days away.
How strong is the upcoming seasonal window for Walmart (WMT)?
Walmart has risen in 15 of 15 years during the Aug 26 to Apr 19 window, averaging 12.98% gains and compounding to a 505% cumulative return across the sample. Today the stock closed at $112.66, about 16.7% below its 52-week high of $135.16 and roughly 19.5% above its 52-week low, leaving room on both sides of the range as the pattern approaches. Elevated implied volatility around the Aug 20 earnings report, with options pricing roughly 32% implied volatility versus a 12‑month low of 18%, shows traders are already bracing for bigger swings into this stretch.[10] That mix of a clean 15-for-15 seasonal record, a mid-range price and a volatility spike gives this year’s window more weight than a typical calendar quirk.
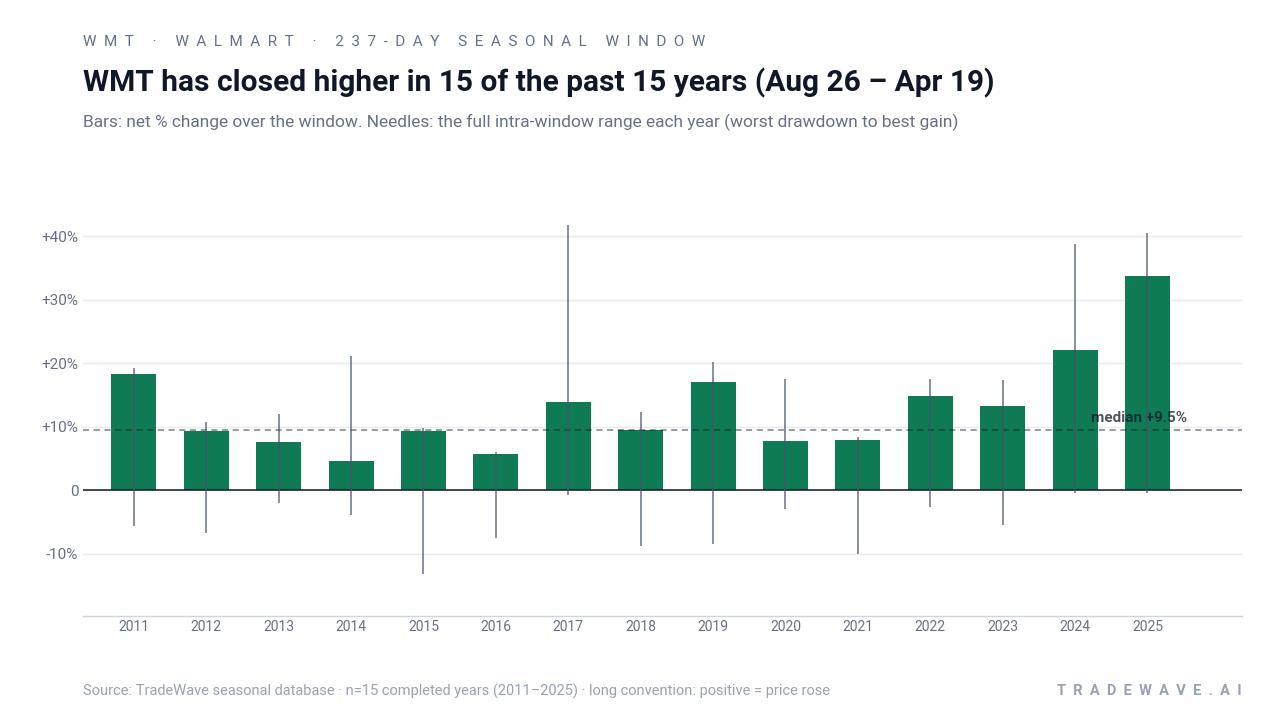
Year-by-year ranges show how far Walmart has typically swung inside the window before finishing higher.
Historically this has been a long-biased stretch for Walmart, with the trade direction firmly aligned to the upside. Percent Profitable sits at 100%, with 15 winners and 0 losers, which is rare for a single-stock seasonal pattern over a 15-year lookback. Average profit of 12.98% means the typical year has delivered a double-digit gain from late August through mid-April, even after accounting for softer years like 2016 and 2020.
The per-year table shows how that upside has played out. The strongest recent years were 2024 and 2025, with net returns of 22.15% and 33.73% respectively, while the weakest gain in the sample was 5.64% in 2016. In several years, such as 2017 and 2024, the maximum favorable move inside the window ran far ahead of the final close, with peak run-ups of 41.69% and 38.8% before some giveback. On the downside, the worst intraperiod drawdowns have ranged from modest pullbacks of less than 1% in 2024 and 2025 to deeper dips of around 8% to 10% in 2016, 2018 and 2021.
The MFE and MAE profile tells traders this is not a straight line. Maximum favorable excursion, the best point-to-peak move from entry, has often been significantly larger than the final net gain, which suggests rallies can overshoot before consolidating. Maximum adverse excursion, the worst drawdown from entry, has at times been sizable even in winning years, with several windows seeing mid-single-digit to high-single-digit pullbacks before the stock recovered. That combination of strong MFE and non-trivial MAE fits a pattern where buying dips inside the window has historically been rewarded, but timing has mattered.
The cumulative chart of this Walmart trading window is unusually smooth for a single stock. Stacking the Aug 26 to Apr 19 window year after year compounds to roughly 505% over the 15-year sample, with no visible flat spots or multi-year reversals. The Sharpe ratio of 1.37 underlines that the return has not just been strong in absolute terms but also relatively efficient compared with the volatility of end-of-window outcomes.
Put together, the key takeaway is simple: this 237-day stretch has been one of the most consistently positive seasonal regimes in Walmart’s modern trading history, with every year in the sample finishing higher despite some sharp drawdowns along the way.
Why does Walmart (WMT) follow this seasonal pattern?
This pattern may reflect how Walmart’s calendar lines up with consumer spending cycles. One likely driver is the clustering of back-to-school, holiday and early tax-refund shopping in the late-August through spring period, which tends to support both sales and investor sentiment. Analysts have also pointed to portfolio rebalancing around Walmart’s earnings cadence and its role as a defensive retail name, which can attract flows during year-end positioning and early-year macro uncertainty.
History does not guarantee future results; adverse excursions (MAE) can be large even in winning windows.
What is driving Walmart (WMT) today?
Walmart closed Monday at $112.66, up 0.7% on the day, leaving the stock about 16.7% below its 52-week high of $135.16 and roughly 19.5% above its 52-week low. The move comes ahead of the company’s Aug 20 fiscal second-quarter earnings report, where options markets are pricing elevated implied volatility and traders are leaning into strategies such as bull put spreads to express cautiously bullish views with defined risk.[10] The setup follows a busy stretch of headlines, including Oppenheimer’s downgrade of Walmart to Perform on Aug 4 on concerns that a “peakish” valuation and policy headwinds could cap upside in the near term,[4] even as other commentators highlight the stock as a core holding with steady earnings power.[2]
Strategically, Walmart is still trying to convince investors it deserves a premium multiple as a tech-enabled retailer rather than a traditional big-box chain. The company’s recent launch of drone delivery in parts of Florida and a GLP-1 prescription program that bundles nutrition and AI coaching is aimed at deepening customer loyalty and expanding higher-margin service revenue streams.[11] Sector analysts argue that these moves, along with Walmart’s growing advertising and membership businesses, are reshaping the retail and wholesale landscape and nudging the company closer to the profile of a consumer-tech platform.[3]
Macro conditions have been broadly supportive. U.S. retail sales reached a 12-month high of $763.7 billion in May 2026, underscoring resilient consumer spending even as investors debate how long that strength can last.[2] For a scale player like Walmart, that backdrop has helped offset concerns about pharmacy reimbursement pressure from the Inflation Reduction Act and potential margin drag from investments in automation and logistics.[4]
On the earnings front, Walmart has delivered a string of solid quarters. Over the past four reporting periods, the company posted EPS of $0.68, $0.62, $0.74 and $0.66, with analysts generally viewing guidance as achievable and longer-term EPS targets for 2026 and 2027 already embedded in many models.[1] Oppenheimer, for example, projects 2026 EPS of $2.81 and 2027 EPS of $3.10, but argues that the current share price already discounts much of that growth, which is why the firm sees limited room for multiple expansion from here.[4]
Street opinion remains broadly constructive despite that caution. Aggregate data from outlets such as Motley Fool, Yahoo Finance and MarketBeat show a consensus Buy rating on Walmart, with a blended 12‑month price target around $122.23, modestly above where the stock trades today.[2][3][12] MarketBeat data also show short interest at roughly 0.50%, a low level that signals little outright bearish positioning in the name.[13] At the same time, institutional flows can still swing the tape; in March 2026, for instance, Schroder Investment Management disclosed selling more than 1.6 million Walmart shares, a reminder that large holders can adjust exposure even in widely owned blue chips.[14]
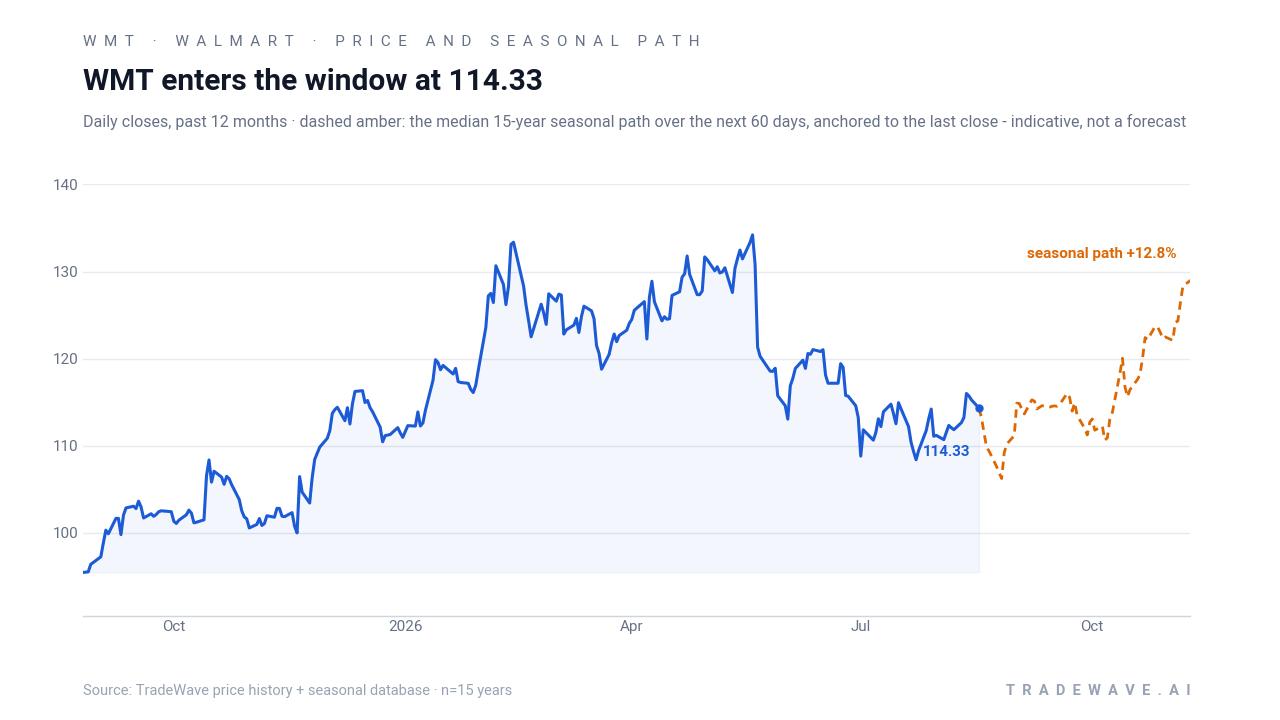
The chart below situates the latest move in its recent multi-month context and overlays the median 60-day seasonal path.
What should traders watch as Walmart (WMT) enters this window?
The first checkpoint is earnings on Aug 20. How Walmart trades on the day and in the week that follows will set the tone heading into the Aug 26 seasonal start date, especially with options markets already pricing a jump in realized volatility around the print.[10] A clean beat-and-raise that the market rewards would align with the historical pattern of strength into the back-to-school and holiday period, while a muted reaction or guidance disappointment could test how durable that 15-for-15 record really is.
Price levels matter too. On the upside, traders will be watching whether Walmart can reclaim its 50-day moving average near $114.49 and then push toward the low $120s, an area that lines up with consensus 12‑month targets.[2][12] On the downside, the band between roughly $105 and the mid-$90s has been the key support zone over the past year; behavior if the stock revisits that range during the window would show whether dip buyers still trust the long-term story.
Options and volatility are the third piece. If implied volatility stays elevated or climbs further after earnings, it would signal that traders expect the upcoming Walmart trading window to be bumpier than usual, even against a historically bullish seasonal backdrop.[10] A sharp post-earnings collapse in implied volatility, by contrast, would suggest that much of the risk premium has been wrung out, which could change how investors think about using options to express views during the window.
Finally, watch whether Walmart’s actual path rhymes with its historical seasonality. A pattern of buying dips after earnings, with the stock grinding higher into the holiday quarter and holding gains into early spring, would be consistent with the 15-year record. A failure to participate in any broader retail strength, or a sustained break of key support levels during the window, would be a clear sign that this cycle is diverging from the usual script.
Sources
- Yahoo Finance: Walmart Inc. (WMT) Analyst Ratings, Estimates & Forecasts (Apr 2, 2026)
- Yahoo Finance / 24/7 Wall St.: Walmart (WMT) Stock Price Prediction (Aug 10, 2026)
- The Motley Fool: Walmart (WMT) Stock Predictions for 2026 and Beyond (Jan 14, 2026)
- CNBC: Street confidence in Walmart leaves no room for upside, Oppenheimer says (Aug 4, 2026)
- Yahoo Finance: Walmart downgraded, Palantir upgraded: Wall Street's top analyst calls (Aug 5, 2026)
- Barchart: Walmart Earnings – Bull Put Spread Trade (Aug 6, 2026)
- Yahoo Finance: Walmart (WMT) Launches Florida Drone Delivery And GLP 1 Weight Loss Prescriptions (Aug 4, 2026)
- MarketBeat: Walmart (WMT) Stock Price, News & Analysis (Jul 28, 2026)
- MarketBeat: WMT, TGT Stocks – CEO Change, Dividends, and 2026 Outlook (Feb 5, 2026)
- MarketBeat: Schroder Investment Management Group Sells 1,602,944 Shares of Walmart Inc. (WMT) (Mar 9, 2026)
About this seasonal analysis
Seasonal pattern data is sourced from TradeWave.ai, which analyzes historical price behavior across annual calendar windows going back up to 30 years. Read the full data methodology or the book The 100-Year Pattern by Afshin Moshrefi (2026 edition). Past performance of seasonal patterns does not guarantee future results. This article is for informational purposes only and does not constitute investment advice.