At $14, Ford Motor Company (F) Faces Tariff Stress and a Late-Summer Downside Streak
Ford Motor Company is trading around $14 as it moves through a late-summer stretch that has usually been weak in midterm election years, just as the automaker juggles an EV reset and tariff uncertainty.
Price as of Aug 17, 2026: $14.05 (last close).

What is the seasonal pattern for Ford Motor Company (F)?
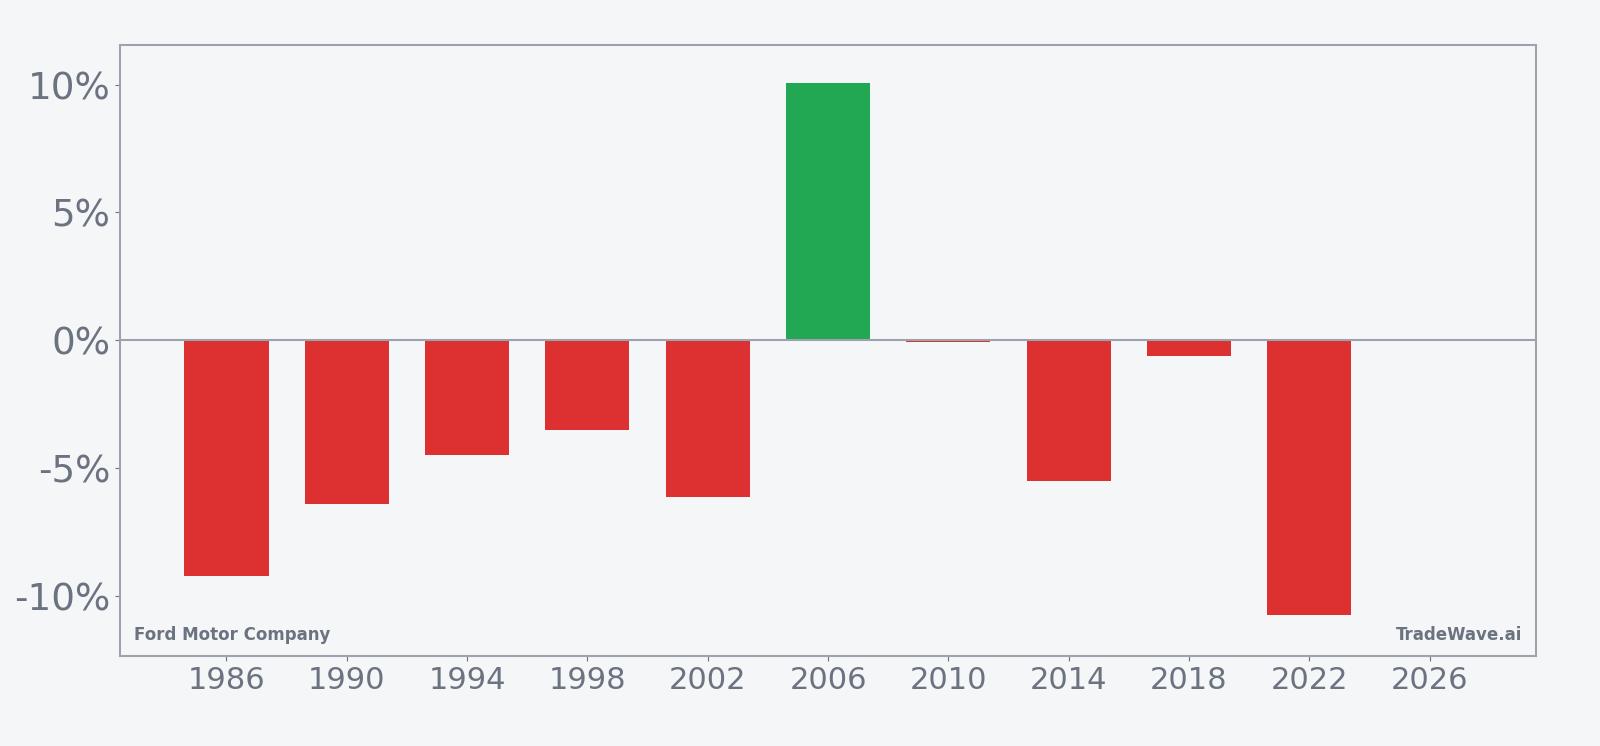
Ford Motor Company has fallen in 9 of the last 10 midterm-year Aug 16 to Sep 14 windows, with an average 5.2% gain in winning years for the short side.
- 9 for 10 in this window, with the short side averaging 5.2% profit in winning years.
- Seasonal direction is bearish for F from Aug 16 to Sep 14 across the last 10 midterm election years.
- Percent Profitable is 90%, with 9 winning years for shorts and just 1 losing year.
- Including every year, Avg Profit - All is 4%, reflecting one sizeable losing year for the pattern.
- Typical losing years for shorts have seen about a 10.05% rally against the position before the window closed.
- A TradeWave Ratio of 2.61 and a Sharpe ratio of 0.57 point to a historically effective but bumpy short window.
According to historical data from TradeWave.ai, this late-summer stretch for Ford has behaved very differently in midterm election years than in a typical calendar month.
How has Ford Motor Company (F) traded in this midterm-year late-summer window?
Ford Motor Company has closed lower in 9 of the last 10 midterm election years during the Aug 16 to Sep 14 window, making this one of its most consistently weak stretches for the short side to profit. Shares finished Monday at $14.05, down 2.2% on the day and sitting about 19.2% below their 52-week high near $17.40. In February 2026, a MarketBeat alert highlighted insider buying that coincided with a 4% pop in the stock, a reminder that single-day flows can still cut against this broader seasonal pull.[4]
Because this pattern is grouped by the presidential election cycle, it only looks at the last 10 midterm election years rather than consecutive calendar years. That matters for Ford because midterm years often bring policy noise around tariffs, labor and regulation that hits autos differently than the broader market.
Historically, this 30-day window has favored shorts. Percent Profitable is 90%, with 9 winning years for the short side and just 1 losing year, and the average profit in those winning years is 5.2%. When you blend in the lone losing year, Avg Profit - All comes down to 4%, which still points to a meaningful negative seasonal bias for the stock price over the window.
The per-year table shows that the strongest year for shorts was 2022, when Ford fell 10.77% between the Aug 16 entry and the Sep 14 exit, while the weakest year for the pattern was 2006, when the stock rallied 10.05% and shorts lost money. In several midterm years such as 1998 and 2002, the stock saw intraperiod rallies of more than 8% before rolling over, which is why the average loss for the pattern’s bad year is a hefty 10.05%.
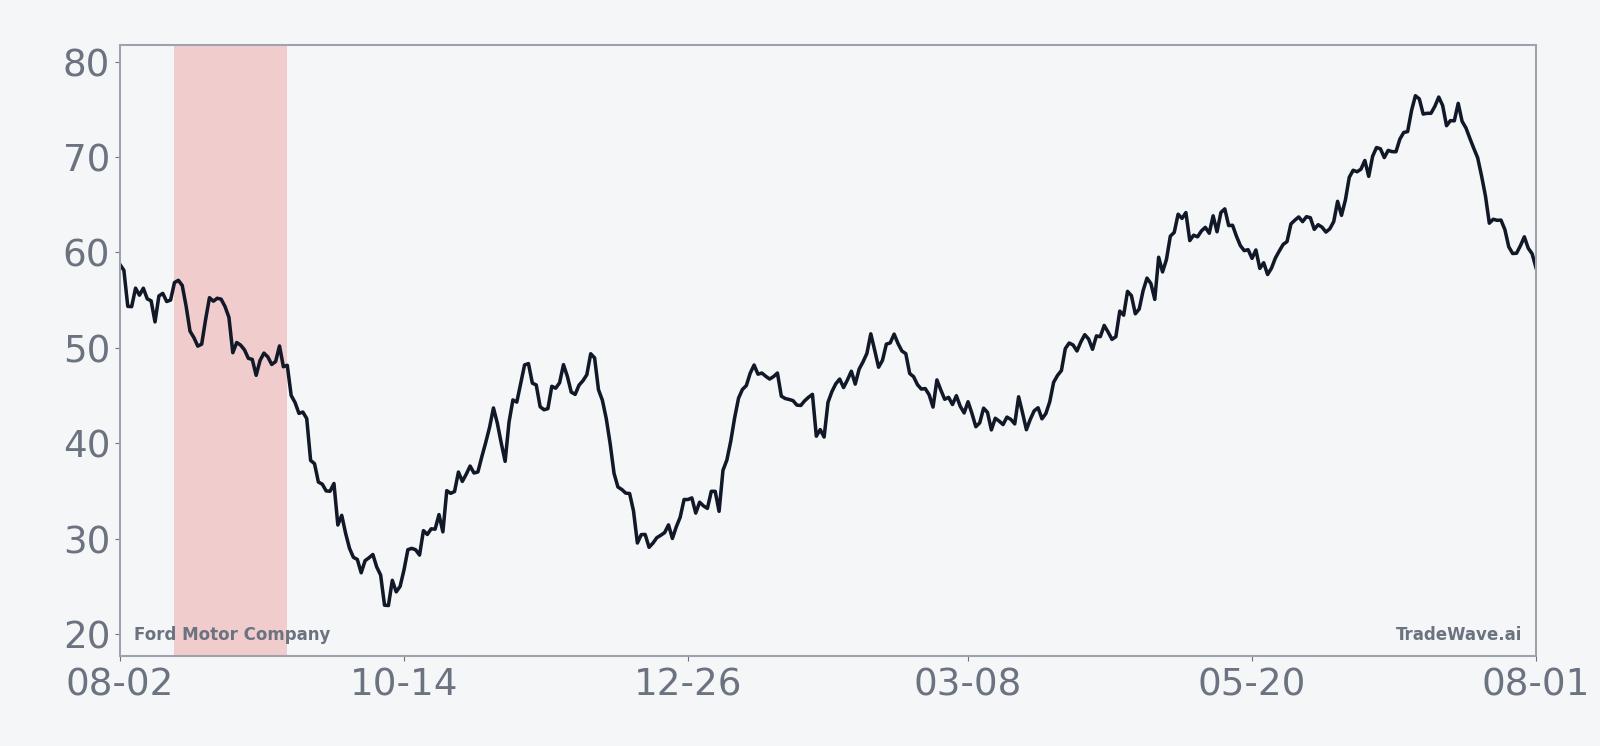
Yearly net and intraperiod swings highlight how often shorts have been rewarded, but also how sharp the countertrend rallies can be.
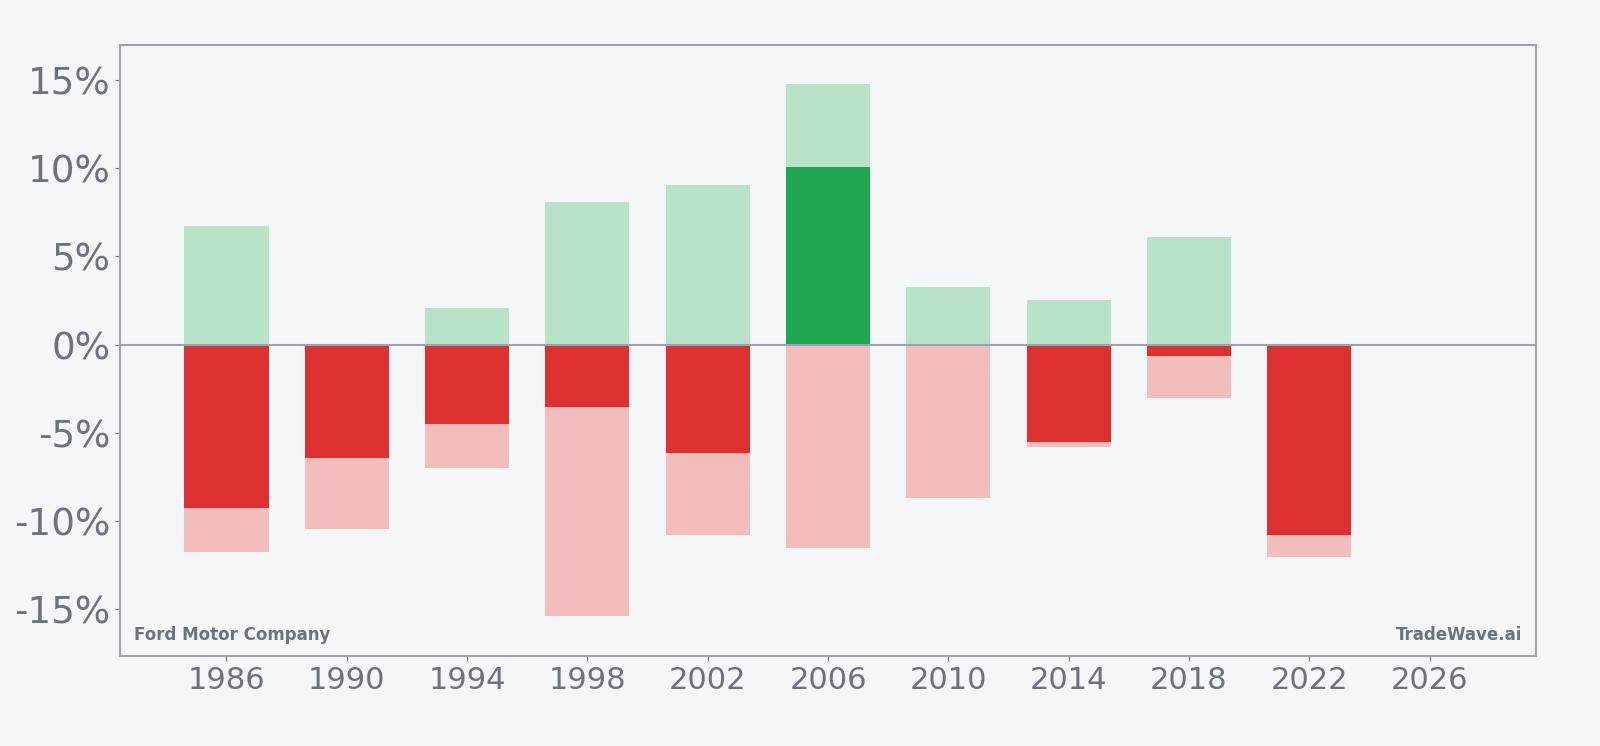
The maximum favorable move for shorts in strong years has often been in the mid-single to low-double digits, while the maximum adverse move has also reached high single digits in several cases. That MFE and MAE profile means the window has historically offered meaningful downside travel for the stock price, but with enough countertrend spikes that timing and risk controls matter. The cumulative chart of this window compounds to a 41% gain for the short side across the 10 midterm years, which is a clean visual of how often this pattern has paid off.
History does not guarantee future results; adverse excursions (MAE) can be large even in winning windows.
Why does Ford Motor Company (F) follow this seasonal pattern?
One likely driver is the way midterm election years bunch policy headlines around tariffs, labor talks and industrial policy, which can weigh on cyclical names like Ford late in the summer.[3] Analysts have also pointed to Ford’s product and capital-spending cycle, with EV and hybrid strategy updates often landing around this time and influencing sentiment on margins and cash flow.[1] The pattern may also reflect institutional portfolio repositioning ahead of the fall, when managers adjust exposure to economically sensitive autos as they reassess growth, rates and consumer demand.
What is driving Ford Motor Company (F) today?
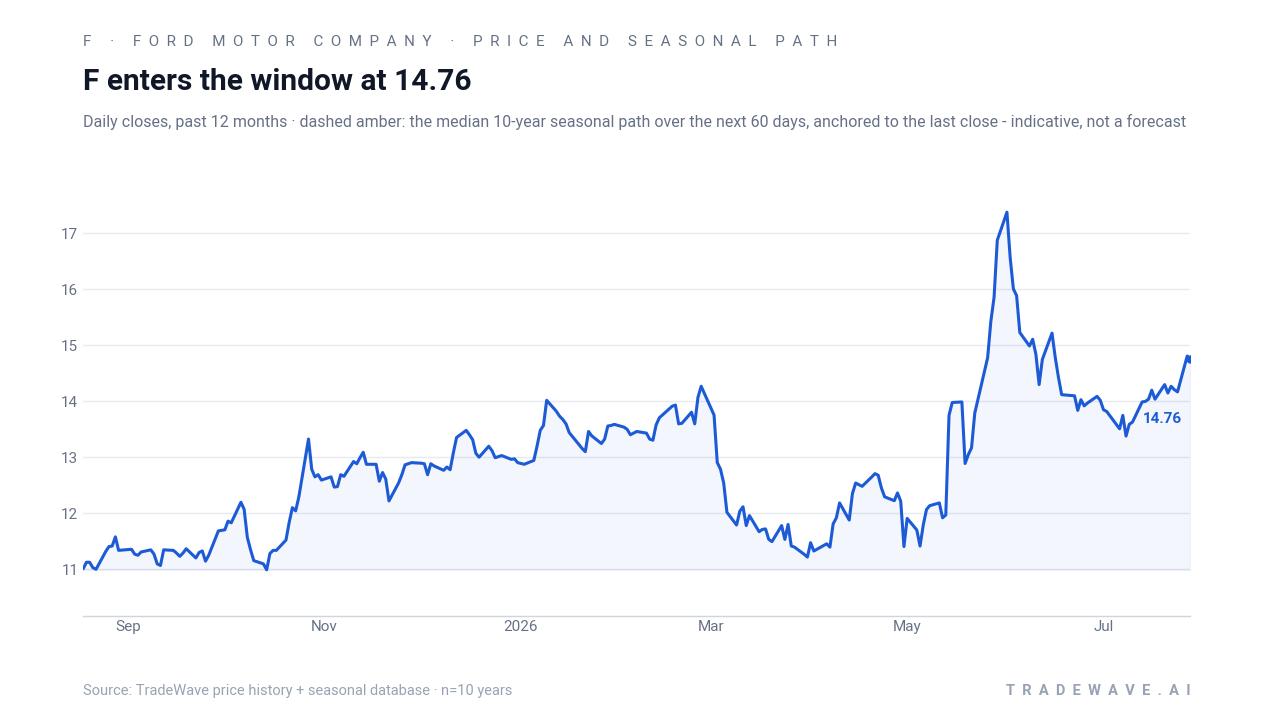
Ford closed Monday at $14.05, down 2.2% on the session, with roughly 31.4 million shares changing hands against a 20-day average volume of about 52.6 million. The stock sits below its 50-day moving average near $13.93, and about 19.2% under its 52-week high around $17.40, leaving it in the middle of its recent trading range rather than at an extreme.
On the fundamental side, the story is still about Ford’s pivot from an aggressive battery-electric push toward a more balanced mix that leans harder into hybrids while it readies new EV products.[1] A recent Seeking Alpha analysis framed the planned Fathom compact battery-electric pickup, slated for fall 2027, as a key swing factor for the stock’s long-term direction, arguing that affordability and execution will determine whether Ford can turn EV investment into durable returns.[2] In the background, a Fortune piece this week highlighted how US tariffs are stressing parts of the North American auto supply chain, with Ford mentioned in the context of supplier dynamics and potential acquisition opportunities as smaller players come under pressure.[3]
Institutional positioning has been active as well. MarketBeat’s institutional ownership data for 2026 shows a steady churn in large holders, consistent with a stock that many managers treat as a tactical cyclical rather than a core compounder.[5] Back on Feb 24, 2026, a MarketBeat instant alert flagged insider buying that coincided with a 4% jump in the shares, underscoring how quickly sentiment can flip when management steps in on the tape, even during seasonally weak stretches.[4]
The chart below situates the latest move in its recent multi-month context and overlays the median seasonal path for the next 60 days.
What should traders watch in this Ford Motor Company (F) window?
First, watch how Ford behaves relative to the historical pattern: if the stock grinds lower or struggles to hold rallies into mid-September, that would line up with the 9-of-10 record for shorts in this midterm-year window. A decisive break above the recent $14.50 to $15 zone with strong volume would instead look more like the 2006 outlier, when the pattern’s lone losing year saw a double-digit rally against shorts.
Second, keep an eye on policy and macro headlines tied to tariffs and supply chains, which have been front and center for the auto complex and could amplify volatility if new measures hit costs or pricing power.[3] Any fresh detail on Ford’s electrification roadmap, including how it sequences hybrid versus BEV investment and updates around the Fathom compact pickup, could also shift how investors value the stock’s late-decade earnings power.[1][2]
Finally, revisit insider and institutional flows as a tell on whether big money is leaning into weakness or fading it. If insider buying or notable fund accumulation reappears during this historically soft stretch, as it did around the February 2026 pop, that would signal growing confidence in Ford’s strategy even as the seasonal pattern points to downside risk.[4][5] Add it up: this is a window where history has usually rewarded patience on the short side, but where single catalysts and positioning shifts can still flip the script quickly.
Sources
- Seeking Alpha - Ford Motor Company (F) Stock Price, Quote, News & Analysis | Seeking Alpha
- Seeking Alpha - Ford's New 'Fathom' Battery Electric Pickup To Influence Stock's Direction (NYSE:F)
- Fortune - Canadian auto billionaire’s fortune doubles even with US tariffs | Fortune
- MarketBeat - Ford Motor (NYSE:F) Shares Up 4% After Insider Buying Activity
- MarketBeat - Ford Motor (F) Institutional Ownership 2026
- The Motley Fool - Congressional Stock Trading: Who Trades and Makes the Most | The Motley Fool
About this seasonal analysis
Seasonal pattern data is sourced from TradeWave.ai, which analyzes historical price behavior across annual calendar windows going back up to 30 years. Read the full data methodology or the book The 100-Year Pattern by Afshin Moshrefi (2026 edition). Past performance of seasonal patterns does not guarantee future results. This article is for informational purposes only and does not constitute investment advice.