Put Buying and CEO Stock Sale Hit Copart (CPRT) Just as a Weak Midterm Window Opens
Copart is stepping into a historically weak late-summer window even as shares hover near recent highs and options traders lean hard into puts.
Price as of Aug 17, 2026: $31.70 (last close).

What is the seasonal pattern for Copart (CPRT)?
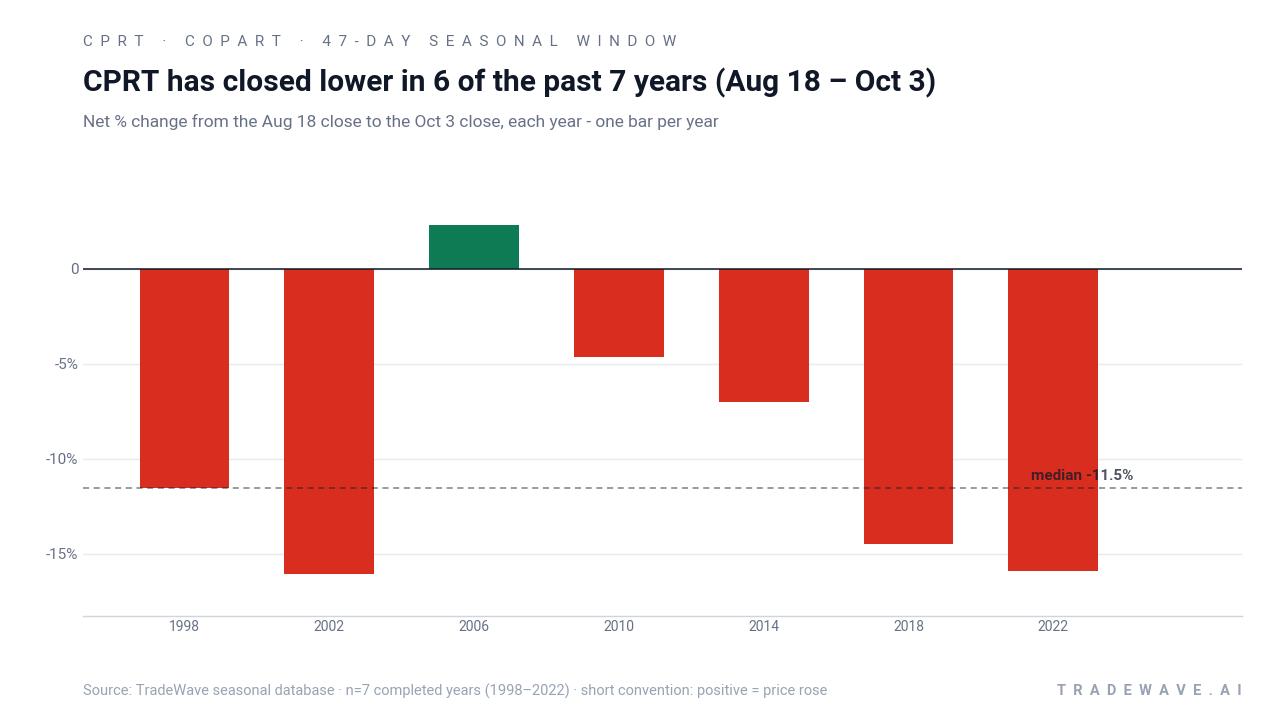
Copart has fallen in 6 of the last 7 midterm-year windows starting Aug 18, with average gains of 11.61% in winning years for the short-side pattern.
- 6 wins and 1 loss for the short-side pattern in this 47-day window across the last 7 midterm election years.
- Percent Profitable is 86%, with 6 winning years for shorts and just 1 losing year.
- Avg Profit for winning short years is 11.61%, while Avg Profit - All years, including the lone loss, is 10%.
- The TradeWave Ratio of 1.51 suggests price often travels meaningfully in the trade direction within the window.
- Historical worst drawdowns within the window have been deep in several years, underscoring meaningful intraperiod risk even when the short pattern works.
- This window runs from Aug 18 through Oct 3, a late-summer stretch that has repeatedly been a soft spot for CPRT in midterm election years.
According to historical data from TradeWave.ai, this late-August window has behaved very differently from an average month for Copart in past midterm election years, and the next iteration begins today.
How has Copart (CPRT) traded in this late-August midterm-year window?
Copart has closed lower in 6 of the last 7 midterm election years during the 47-day window that starts on Aug 18, a notably bearish seasonal stretch for the stock. Shares enter this year’s window at 31.70, up 15.31% over the past month and sitting well above the 50-day moving average of 29.35, with the 52-week range running from 26.81 to 50.11. A burst of put buying and a fresh insider sale from CEO Jeffrey Liaw in mid-August add a layer of positioning and sentiment risk on top of the historical pattern, as traders pay up for downside protection while leadership trims exposure.[6]
Grouping the data by presidential election cycle matters here because this window captures Copart’s behavior specifically in midterm election years, when policy noise, regulatory headlines and risk appetite often look very different from election years or the year before an election. Pattern phase and calendar phase are aligned in 2026, so the historical sample is directly comparable to the environment traders face today.
Across the last 7 midterm election years, the short-side pattern in this Aug 18 to Oct 3 Copart trading window has been profitable 86% of the time, with 6 winning years for shorts and just 1 losing year. Average profit in those winning years is 11.61%, while including the lone loss brings the all-years average to 10%, which is still a sizable move for a 47-day stretch. For a short pattern, those negative net returns mean the stock has typically drifted or broken lower into early October, rewarding traders positioned for downside rather than upside.
The per-year table shows that the strongest short-side years include 2002, 2018 and 2022, when net returns for the pattern ranged from roughly 14% to 16% in favor of shorts as Copart slid over the window. The weakest year for the pattern was 2006, when the stock rose about 2.27% over the window, creating a losing outcome for shorts despite relatively modest intraperiod swings. That mix of one small losing year and several sizable winning years is what drives the high Percent Profitable and double-digit average profit figures.
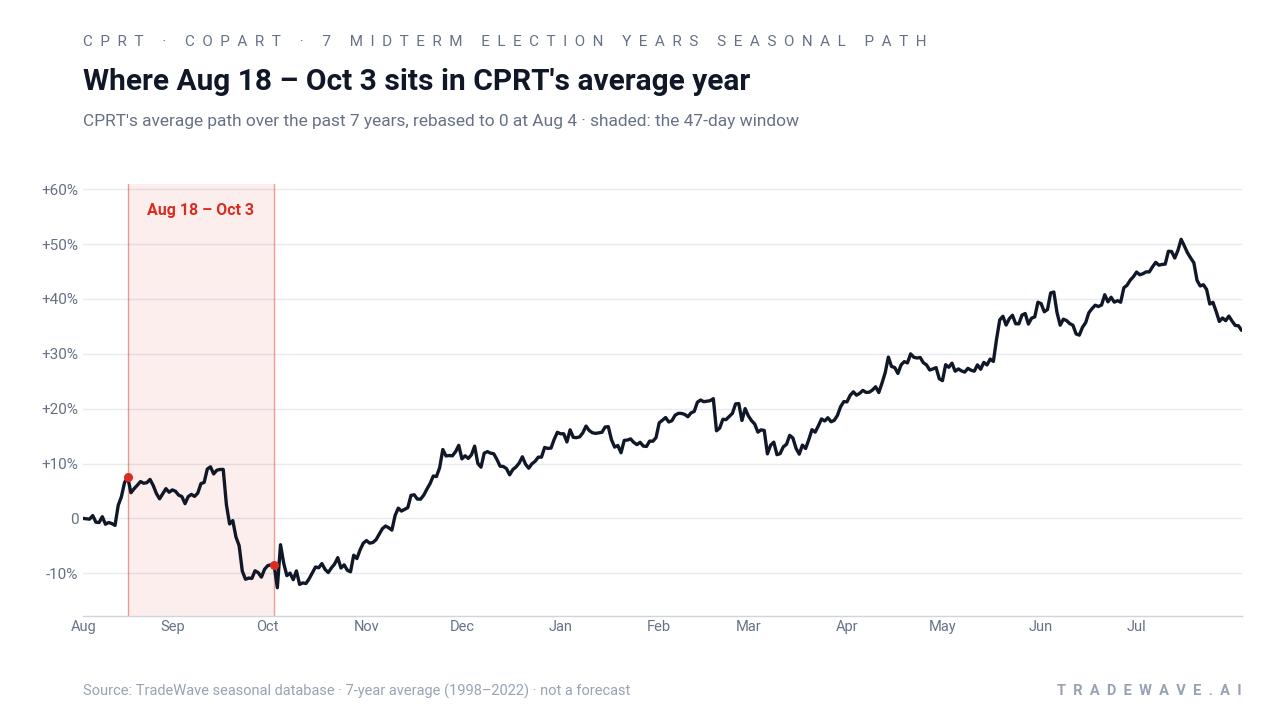
The historical seasonal average chart shows Copart’s typical year in these midterm cycles bending lower through this late-August to early-October stretch, rather than grinding higher. The path tends to weaken fairly quickly after the window opens, then stays under pressure into the back half of the period, which aligns with the short-side bias in the stats.
A combined view of yearly net returns and intraperiod swings shows how far Copart has tended to move in both directions during this window.
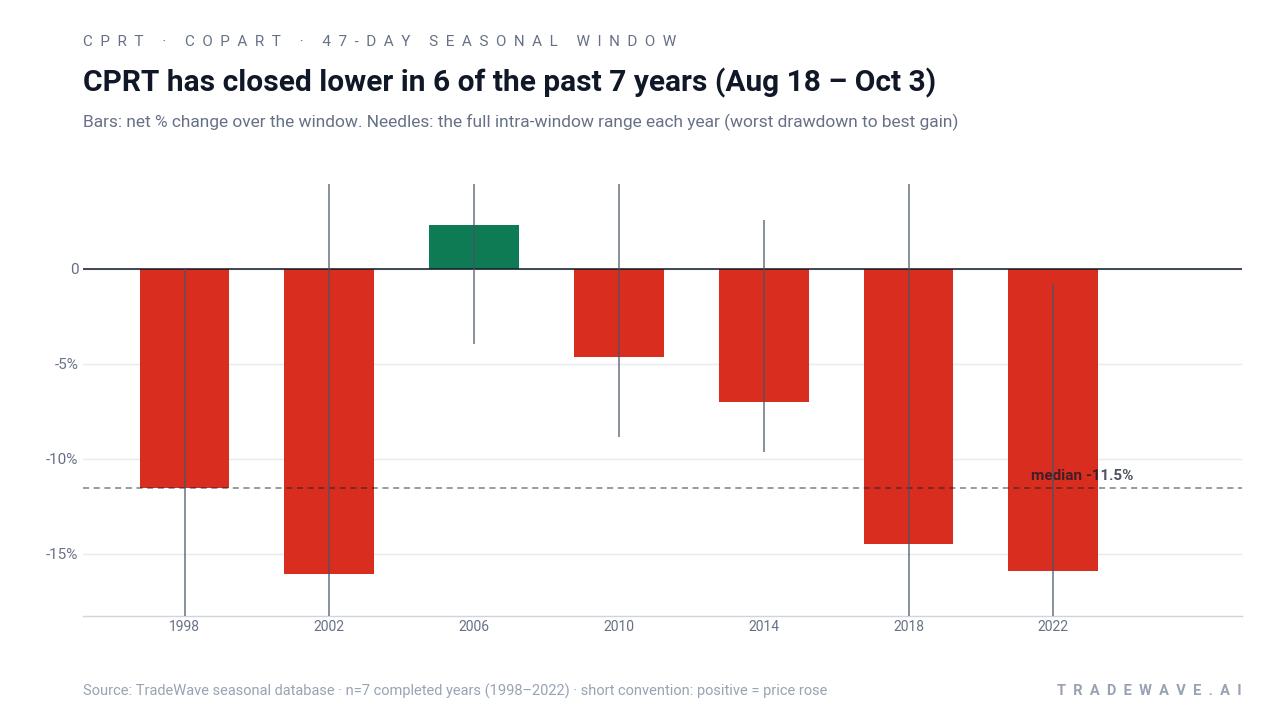
The combined net / MFE / MAE bar chart shows that in the stronger short years, Copart often experienced sizable maximum favorable moves for shorts, with the stock sliding well below the entry level at some point in the window, while maximum adverse moves against shorts were more contained. In weaker years, the worst drawdown from entry, or MAE, expanded, showing that even in a generally bearish seasonal window, rallies against the short-side pattern can be sharp before the stock settles lower or, in the one losing year, finishes above the starting point. The TradeWave Ratio of 1.51 captures that tendency for price to travel meaningfully in the trade direction within the window, independent of where it closes.
History does not guarantee future results; adverse excursions (MAE) can be large even in winning windows.
Why does Copart (CPRT) follow this seasonal pattern?
This late-August to early-October window likely reflects a mix of earnings timing, insurer budgeting and portfolio repositioning in the vehicle remarketing sector. One likely driver is that Copart’s fiscal-year cadence and guidance updates often cluster around late summer, which can reset expectations on salvage volumes, fee rates and margins in ways that have skewed bearish in midterm years.[4] Institutional investors also tend to rebalance cyclicals and rate-sensitive names ahead of the fourth quarter, and Copart’s exposure to used-car and insurance trends means it can sit in the crosshairs when macro uncertainty is elevated in the middle of the election cycle.[2]
What is driving Copart (CPRT) today?
Copart shares closed at 31.70 on Tuesday, up 0.28% on the day, extending a 15.31% gain over the past month as the stock rebounds from its 52-week low of 26.81 but remains well below the 52-week high of 50.11. The move comes on the heels of a solid quarter reported in mid-August, when Copart posted EPS of 0.43 on revenue of 1.24 billion dollars, topping expectations and showing revenue growth of about 2.1% year over year.[9] Analysts had earlier flagged a softer Q4 of calendar 2025, when revenue and EPS missed estimates and the stock dropped double digits, but the more recent beat has helped stabilize the narrative around margins and growth.[4]
Options and positioning tell a more cautious story. On Aug 14, traders snapped up 12,791 put options in a single session, roughly a 381% jump versus average daily put volume, signaling a rush to hedge or speculate on downside in CPRT.[6] The same MarketBeat alert noted that CEO Jeffrey Liaw sold 27,745 shares on Jul 28 at an average price of 30.49 dollars, trimming his stake to 99,641 shares, a modest but visible insider sale that landed just before the latest rally.[6] Short interest is not extreme but is elevated, with a short interest ratio of 3.4 as of the Jul 31 reporting period, suggesting a meaningful cohort of investors is already positioned for weakness.[5]
Fund flows and institutional moves have been more supportive. Oppenheimer Asset Management disclosed a new position in Copart in mid-August, while Focus Partners Advisor Solutions reported a fresh 1.30 million dollar investment, both filings that arrived alongside the earnings beat and point to continued long-only interest in the name.[9][10] Sector commentary still highlights competitive pressure on fee rates and insurer bargaining power as key risks for Copart’s online auction model, especially if accident trends or total-loss rates soften from post-pandemic highs.[2][4] That mix of improving reported results, cautious derivatives activity and ongoing industry headwinds sets the stage for how traders may interpret any deviation from the usual late-summer seasonal pattern.
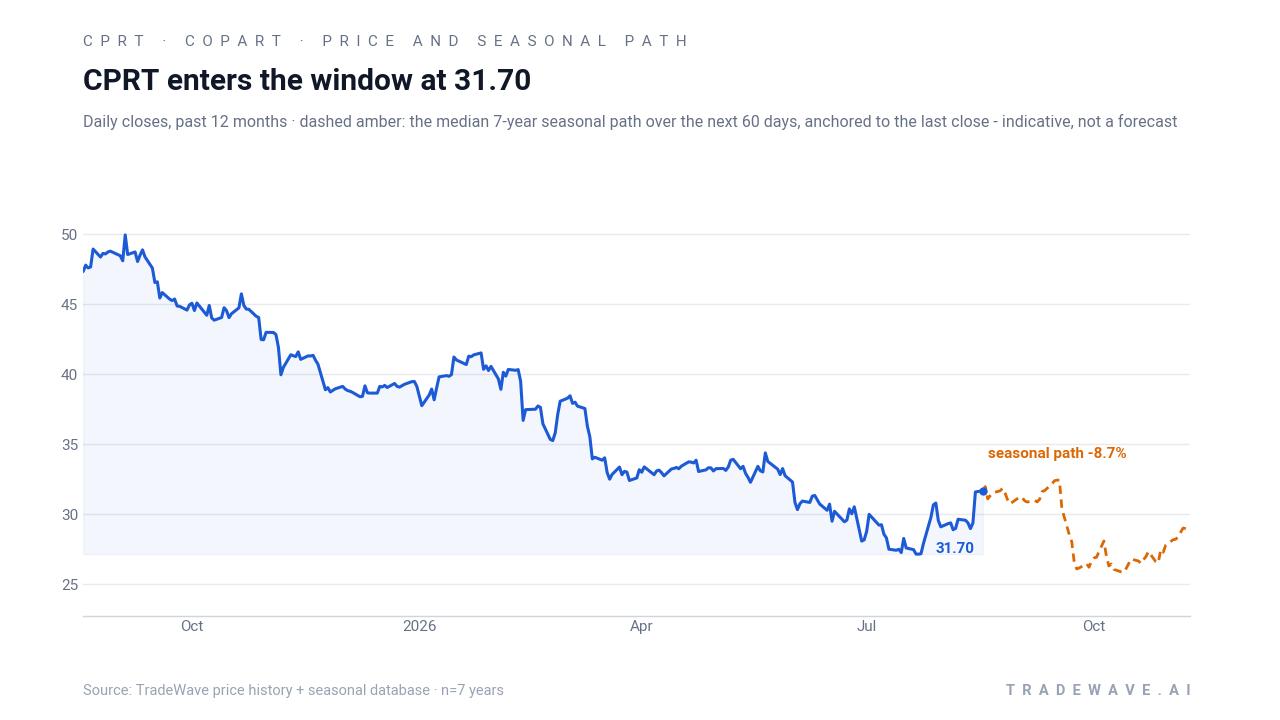
The chart below shows Copart’s recent rebound alongside the historical median seasonal path for the next 60 days.
What should traders watch in this Copart (CPRT) window?
First, watch how Copart trades around the 30 to 32 dollar band where it entered the window, especially relative to the 50-day moving average near 29.35. A quick break back below that moving average would be more in line with the historical midterm-year pattern, while a sustained push higher would mark a rare challenge to a window that has favored shorts in 6 of 7 cycles. Price action around any retests of the 26.81 52-week low or moves toward the mid-30s will help confirm whether this year is tracking the typical CPRT seasonal trend or diverging.
Second, keep an eye on options flow and short interest to see whether the August put spike was a one-off event or the start of a larger build in downside positioning.[6][5] If put volumes stay elevated and the short interest ratio climbs from 3.4, it would suggest traders are leaning harder into the historical seasonal weakness, which can amplify moves if the stock starts to slide. Conversely, a fade in put demand or a squeeze in shorts during a flat or rising tape would signal that the market is less willing to bet on the usual late-summer pattern repeating.
Finally, monitor any follow-up commentary from management or insurers on salvage volumes, pricing and macro accident trends as the quarter progresses.[1][4] Midterm election years often bring shifting expectations around regulation, rates and consumer health, and Copart sits at the intersection of used-car demand and insurance behavior. If fundamentals stay firm while the stock respects its historically weak seasonal window, that would reinforce the idea that this 47-day stretch is more about calendar and positioning than about a structural change in the business. If both fundamentals and price break in the same direction, the seasonal pattern could again be the quiet backdrop to a much louder move.
Sources
- Yahoo Finance - Copart, Inc. (CPRT) Stock Sinks As Market Gains: Here's Why
- Yahoo Finance / Simply Wall St summary - How The Copart (CPRT) Narrative Is Shifting With Lower Price Targets And Earnings Concerns
- Yahoo Finance / StockStory - What To Expect From Copart’s (CPRT) Q1 Earnings
- Yahoo Finance / StockStory - Copart (NASDAQ:CPRT) Reports Sales Below Analyst Estimates In Q4 CY2025 Earnings, Stock Drops 10.8%
- MarketBeat - Copart (CPRT) Short Interest & Short Float | Updated Aug 2026
- MarketBeat - Stock Traders Buy High Volume of Put Options on Copart (NASDAQ:CPRT)
- U.S. SEC EDGAR - cprt-20250731 (SEC filing)
- Seeking Alpha - Copart: A Wide-Moat Compounder Trading At A Rare Discount (NASDAQ:CPRT)
- MarketBeat - Oppenheimer Asset Management Inc. Takes Position in Copart, Inc. $CPRT
- MarketBeat - Focus Partners Advisor Solutions LLC Makes New $1.30 Million Investment in Copart, Inc. $CPRT
- The Motley Fool - Why Copart Stock Dropped on Earnings Today
About this seasonal analysis
Seasonal pattern data is sourced from TradeWave.ai, which analyzes historical price behavior across annual calendar windows going back up to 30 years. Read the full data methodology or the book The 100-Year Pattern by Afshin Moshrefi (2026 edition). Past performance of seasonal patterns does not guarantee future results. This article is for informational purposes only and does not constitute investment advice.