IBM Shares Trend Higher Ahead of 203-Day Midterm Window
IBM is trading around $234 as it heads toward a 203-day midterm-election-year seasonal window that has historically skewed bullish, offering a supportive backdrop for the stock’s AI infrastructure story.
Price as of Aug 14, 2026: $234.32 (last close).

What is the seasonal pattern for IBM (IBM)?
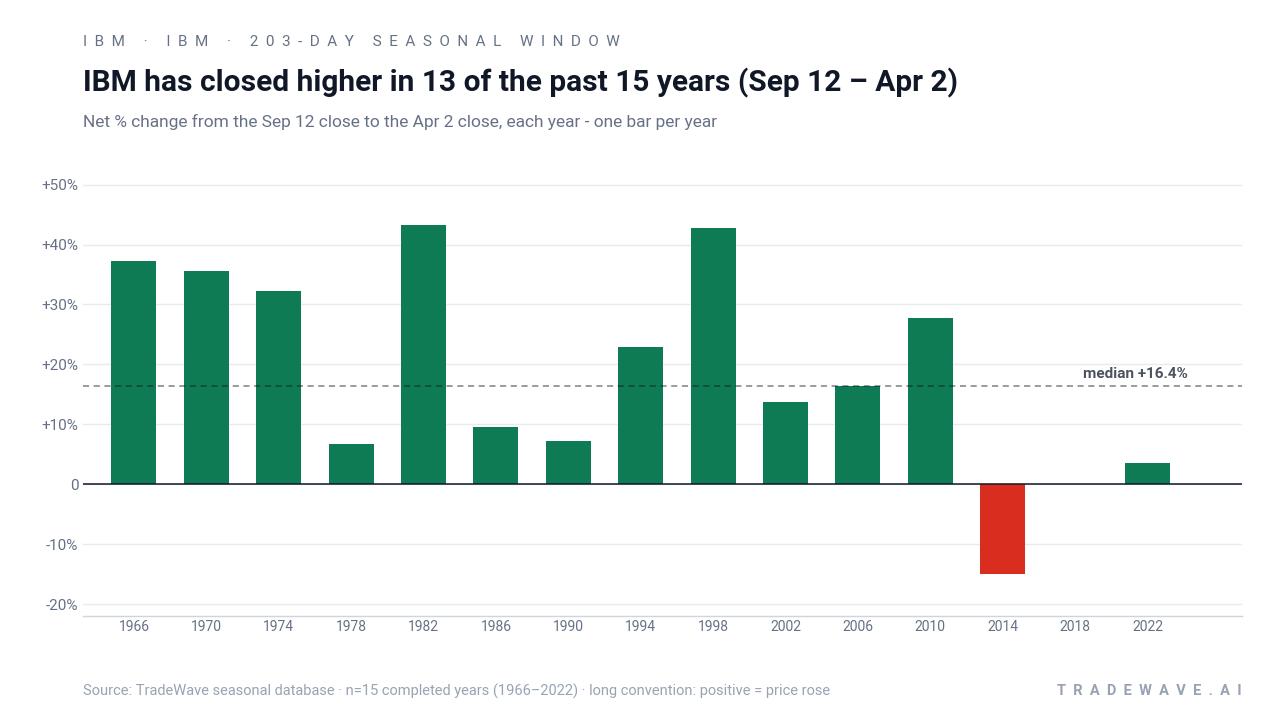
IBM has risen in 13 of 15 years during this Sep 12 to Apr 2 midterm-election-year window, with an average gain of 23.01% in winning years.
- 13 for 15 in this window, with winning years averaging 23.01% gains and a 19% average when all years are included.
- The seasonal window begins on Sep 12 and runs for 203 days into early April, aligned with the last 15 midterm election years.
- Percent Profitable stands at 87%, with 13 winners and 2 losers across the historical sample.
- Avg Profit reflects only the up years, while Avg Profit - All folds in the two losing years, including a roughly 15% drop in 2014 and a flat outcome in 2018.
- The pattern is long-biased, with a TradeWave Ratio of 1.6 and a Sharpe ratio of 0.97, pointing to strong but sometimes volatile upside.
- Intraperiod swings have included double-digit drawdowns in some years, so the historical edge has come with meaningful downside risk along the way.
According to historical data from TradeWave.ai, this midterm-election-year stretch has behaved very differently from an average six-month span for IBM, with a distinct long-biased pattern that traders often overlook.
How has IBM (IBM) traded in the Sep 12 to Apr 2 midterm-year window?
IBM has risen in 13 of the last 15 midterm-election-year windows running from Sep 12 to Apr 2, with winning years averaging 23.01% gains and a 19% average across all years. The stock finished the prior session at $234.32 after a 1.2% pullback, leaving it well below its 52-week high near $327.74 and above its 52-week low around $196.36. That puts IBM in the middle of its recent range as it approaches a historically supportive seasonal regime that has often rewarded long exposure but has not been a straight line higher.
The presidential election cycle matters here because this pattern is built only from midterm election years, a phase that often features policy uncertainty, shifting fiscal priorities and more selective risk-taking. In that context, IBM’s role as a mature enterprise and AI infrastructure name has historically lined up with a period when investors rotate toward quality tech and cash-generative software platforms.
Across the 15 midterm-year samples, the long trade direction is clear. Percent Profitable is 87%, with 13 winners and just 2 losers, and the all-years average gain of 19% suggests that the losing years have not fully offset the strength of the up years. The worst outcome in the per-year table is 2014, when IBM dropped about 14.95% between Sep 12 and Apr 2, while 2018 was essentially flat with a 0.04% loss, underscoring that even a strong IBM seasonal trend can deliver disappointments.
On the upside, several windows have delivered outsized gains. In 1998, IBM rallied 42.85% over the 203-day span, with a maximum favorable move of 54.54% from the entry price before giving back some of the advance by the close. In 2010, the stock gained 27.79% with a best intraperiod run-up of 30.49%, and 1994 and 2006 also posted mid-teens to low-20s returns with very shallow worst drawdowns of less than 2% from entry.
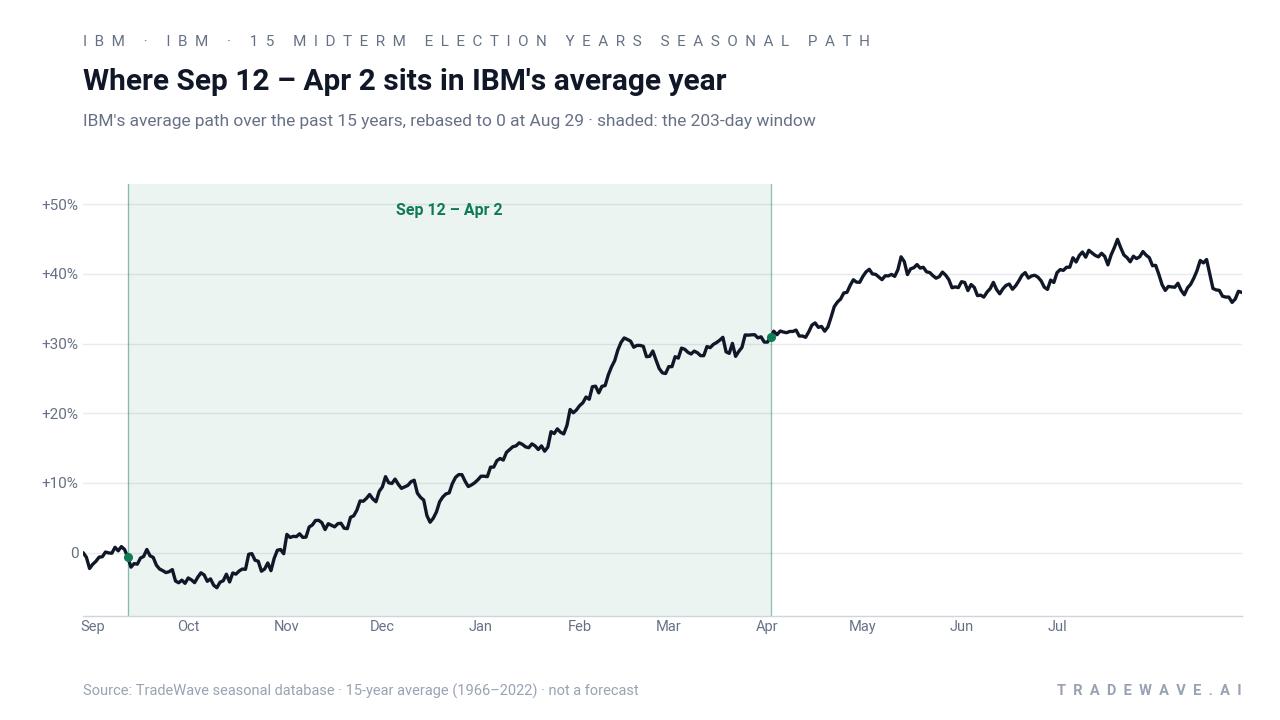
The historical seasonal average chart shows IBM’s typical year bending higher through this 203-day stretch rather than spiking in a single burst. Gains tend to accrue over months, which fits a story of institutional investors gradually adding exposure to enterprise tech as midterm-year policy noise clears and the market begins to look toward the pre-election year, a phase that has often been friendlier for equities.
Yearly net returns and intraperiod ranges highlight how IBM’s upside and downside have both shown up inside this window.
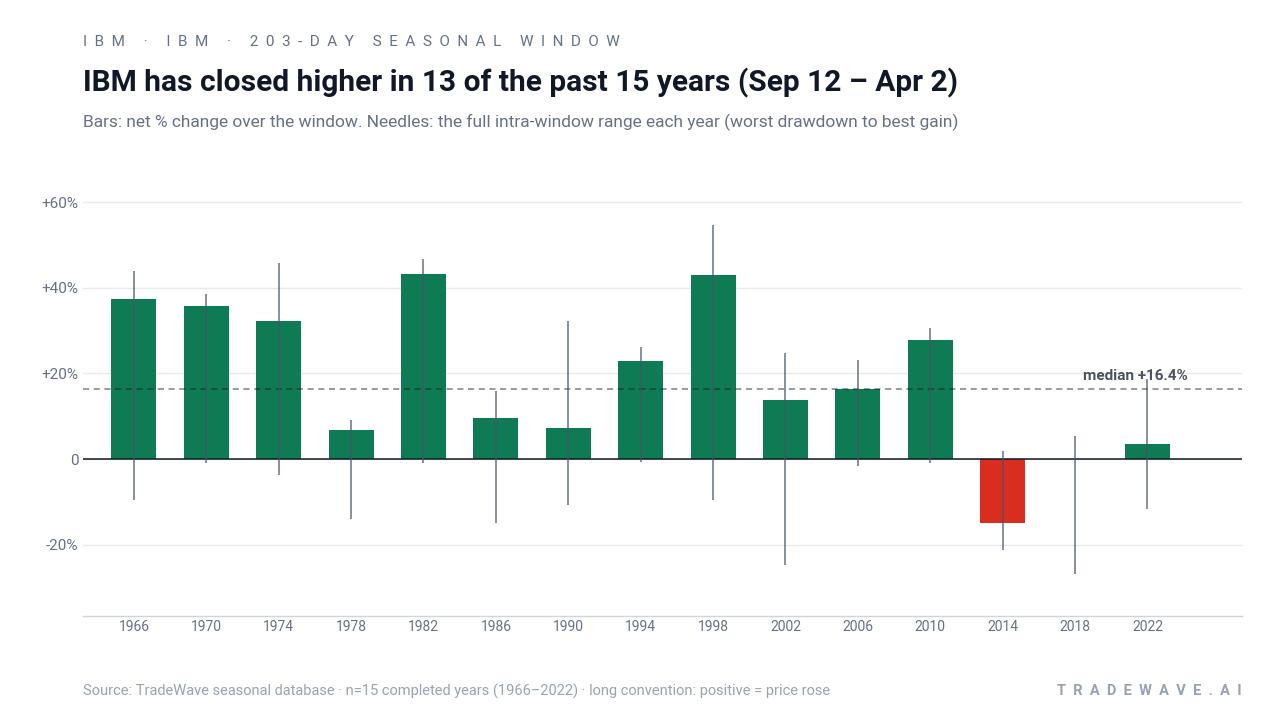
The combined net-return and intraperiod-range chart makes the volatility profile clear. In 2002, for example, IBM finished the window up 13.77% but only after enduring a worst drawdown of 24.85% from the entry price, while 2018 saw a maximum adverse move of 26.8% despite ending almost flat. That mix of large maximum favorable excursions and sometimes deep maximum adverse excursions is consistent with a TradeWave Ratio of 1.6 and a Sharpe ratio of 0.97, pointing to a historically rewarding but bumpy ride for long positions.
History does not guarantee future results; adverse excursions (MAE) can be large even in winning windows.
Why does IBM (IBM) follow this seasonal pattern?
One likely driver is the way the presidential election cycle shapes enterprise IT budgets and investor positioning. Midterm election years often start with policy and rate uncertainty, then see a second-half shift toward clearer fiscal and regulatory paths, which can support multi-quarter spending commitments on AI infrastructure and software. Analysts have also pointed to institutional portfolio rebalancing into quality tech and defensive growth as midterm-year volatility fades, a backdrop that has historically lined up with IBM’s stronger Sep-to-Apr trading window.
What is driving IBM (IBM) today?
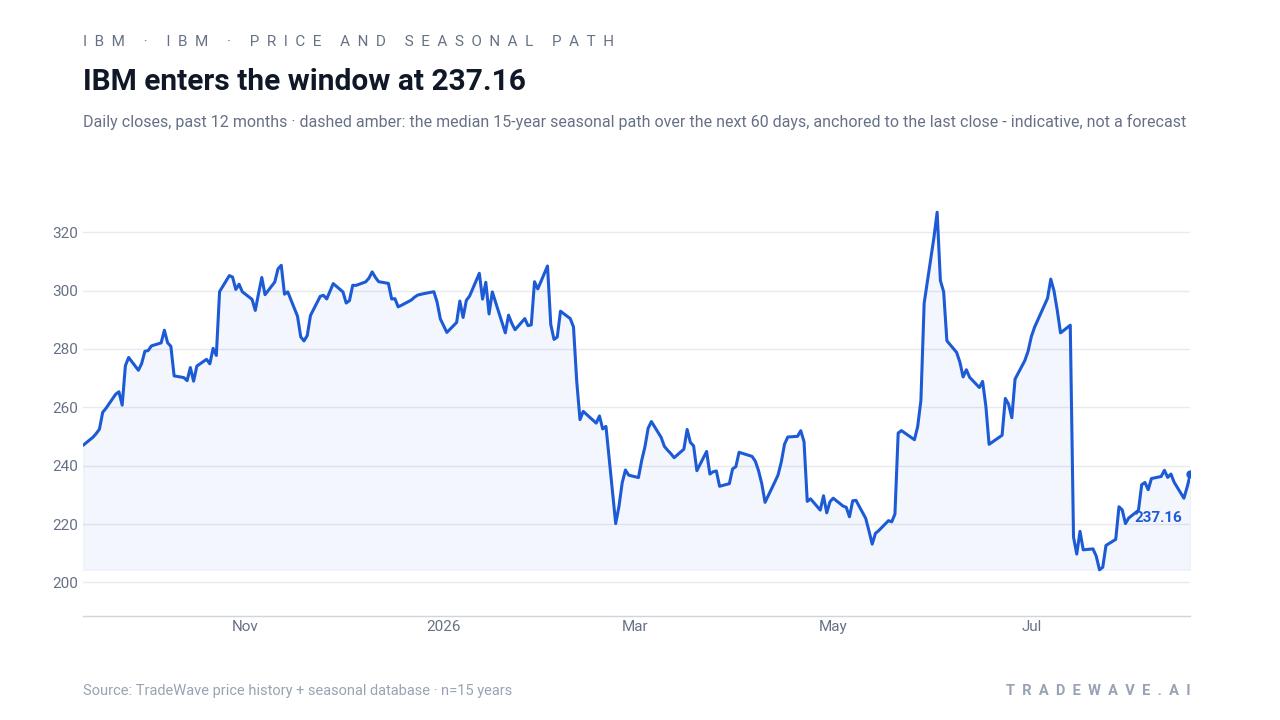
IBM shares closed at $234.32 in the prior session, down 1.2% on the day, after trading between an intraday high of $239.15 and a low of $233.73 on volume of about 3.7 million shares. That leaves the stock roughly 28.5% below its 52-week high near $327.74 and about 19.3% above its 52-week low around $196.36, with the 50-day moving average sitting higher at roughly $249.10 and 20-day average volume closer to 8.1 million shares. The near-term story is dominated by IBM’s positioning in AI infrastructure and enterprise software, including commentary from Red Hat that some agentic AI deployments could require four CPUs for every GPU, a shift that would favor CPU-heavy architectures and potentially boost demand for IBM’s hybrid cloud and automation stack as data centers retool for AI workloads.
The chart below situates the latest move in its recent multi-month context alongside the median 60-day seasonal path.
From a broader sector standpoint, IBM sits at the intersection of enterprise software, AI systems and infrastructure, a corner of the market that has been reshaped by demand for AI-ready data centers. Red Hat’s comments on CPU-to-GPU ratios for agentic AI suggest that hyperscalers and large enterprises may need to rethink server configurations, which could support IBM’s consulting and hybrid cloud offerings as customers redesign architectures for more CPU-intensive AI workloads. That macro and sector backdrop gives extra weight to the historical IBM seasonal trend, since the upcoming midterm-year window overlaps a period when investors have often rotated toward durable cash flows and mission-critical software platforms.
What should traders watch in this IBM (IBM) seasonal window?
The first marker is timing. The 203-day IBM trading window tied to the midterm election year begins on Sep 12 and runs into early April, overlapping the market’s transition from the midterm year into the year before the presidential election, a phase that has often been friendlier for equities. Historically, IBM’s strongest years in this window have seen gains build over months rather than in a single burst, so traders will be watching whether the stock can hold above its recent lows and start to grind higher as the calendar flips into the window.
Second, price levels matter. The 52-week band between roughly $196 and $328, along with the 50-day moving average near $249, offers a simple roadmap: behavior around the 50-day line and any retests of the low-$200s zone will show whether IBM is following its historical seasonal bias or diverging from it. A pattern of higher lows into and through the window would rhyme with prior midterm-year cycles, while a sustained break back toward the 52-week low would mark a clear departure from the long-biased IBM seasonal trend.
Finally, the macro and policy calendar will shape how this pattern plays out. As the midterm election year moves toward its close and the market begins to discount the year before the presidential election, traders will track how AI infrastructure spending, rate expectations and fiscal policy debates feed into enterprise IT budgets. If AI-related demand for CPU-heavy data centers and hybrid cloud architectures continues to build, IBM’s historical seasonal strength could find a supportive fundamental backdrop; if corporate spending tightens or policy uncertainty lingers, the two losing years in the sample are a reminder that even strong patterns can fail.
Sources
About this seasonal analysis
Seasonal pattern data is sourced from TradeWave.ai, which analyzes historical price behavior across annual calendar windows going back up to 30 years. Read the full data methodology or the book The 100-Year Pattern by Afshin Moshrefi (2026 edition). Past performance of seasonal patterns does not guarantee future results. This article is for informational purposes only and does not constitute investment advice.