AI PC Tailwinds Lift HP Inc. (HPQ) Just as a 157-Day Midterm Rally Window Nears
HP Inc. is pulling back after a strong summer run just weeks before a historically bullish midterm-year fall–winter trading window that has often rewarded long positions.
Price as of Aug 14, 2026: $30.11 (last close).
What is the seasonal pattern for HP Inc. (HPQ)?
HP Inc. has risen in 9 of 10 midterm-year Sep 13–Feb 16 windows, with an average gain of 26.5% in winning years.
- 9 for 10 in this window, with winning years averaging 26.5% gains and a 23% average when all years are included.
- The upcoming seasonal window runs from Sep 13, 2026 through Feb 16, 2027, spanning 157 calendar days in the midterm election year.
- Percent Profitable sits at 90%, with 9 winners and just 1 loser across the last 10 midterm election-year cycles.
- The trade direction is long, supported by a Sharpe ratio of 1.44 and a TradeWave Ratio of 1.56 for this HPQ seasonal trend.
- Historical maximum adverse moves have reached more than 20% in some years, showing that drawdowns can be sharp even in an overall bullish pattern.
- Stacking this HP Inc. trading window across the last 10 midterm election years compounds to a 651% cumulative return.
According to historical data from TradeWave.ai, this specific midterm-year fall–winter stretch has behaved very differently from an average calendar period for HPQ. The next section walks through how that pattern has played out in prior cycles and what it means for the coming months.
How has HP Inc. (HPQ) traded in past midterm-year fall–winter windows?
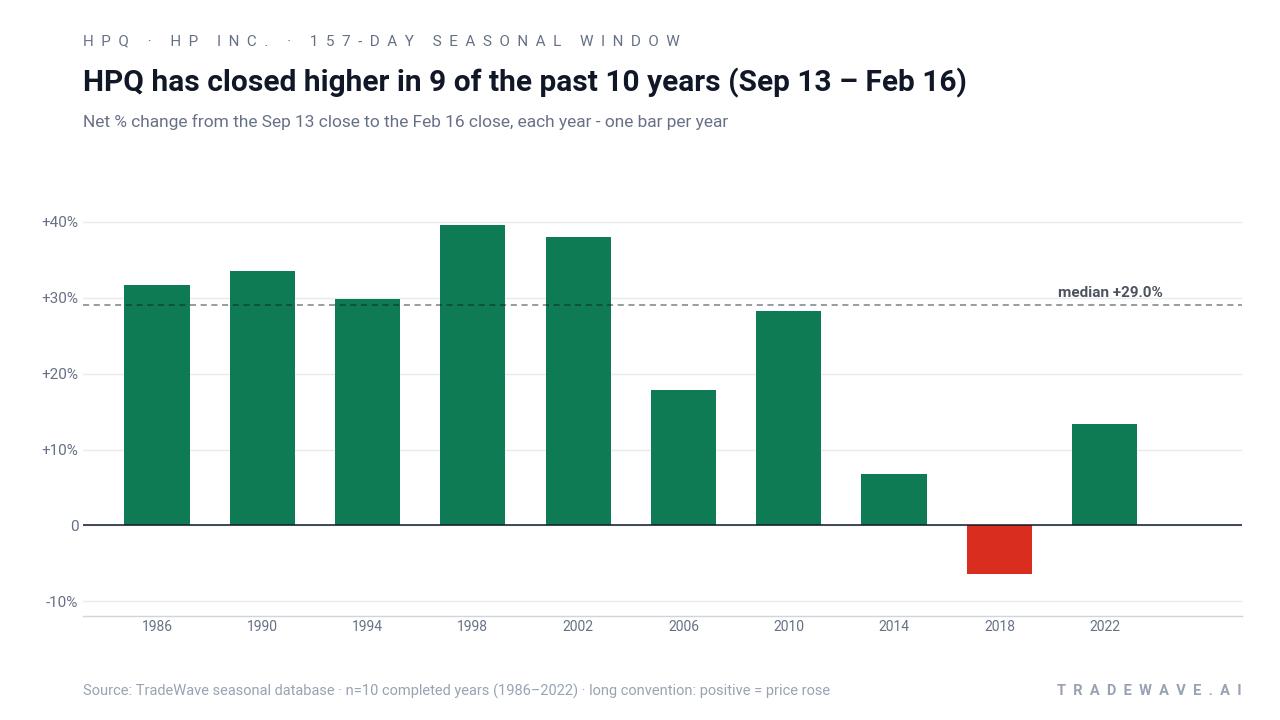
HP Inc. has closed higher in 9 of the last 10 midterm election-year windows running from Sep 13 to Feb 16, with a 26.5% average gain in the winning years and a 23% average across all years. Today the stock finished at $30.11, down 3.8% on the day and about 6.5% below its 52-week high of $32.19, after a strong one-month run of 21.22% that leaves it well above its 50-day moving average of roughly $25.37. In the background, options specialists reported unusually heavy call buying in early June tied to out-of-the-money July $35 calls, a sign that some traders have already been positioning for upside in HPQ ahead of this seasonal window.[1]
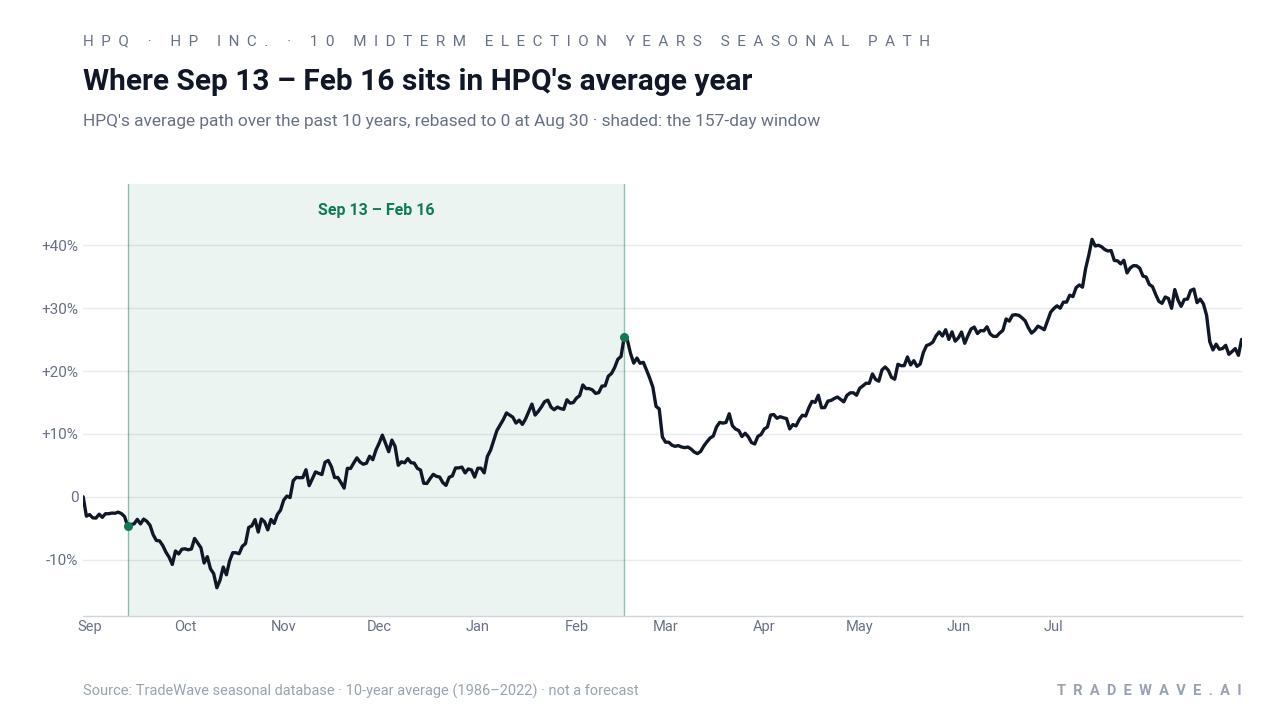
The pattern is built on the last 10 midterm election years, a phase of the presidential cycle that often coincides with policy uncertainty, shifting fiscal priorities and choppy index-level trading. Grouping HPQ’s behavior by this election phase rather than by simple calendar years shows that the stock has tended to respond positively in the late-year stretch as investors look through midterm noise toward the historically stronger pre-election year.
Across those 10 midterm-year windows, HPQ’s long setup has produced 9 winners and just 1 loser, for a 90% Percent Profitable reading. The single down year was 2018, when the stock fell 6.37% between Sep 13 and Feb 16 even though it still managed to trade as much as 8.28% higher at one point during the window before reversing. In contrast, the strongest years such as 1998 and 2002 delivered net gains of 39.52% and 38.0% respectively, with maximum favorable moves inside the window reaching 65.99% and 58.66% from the entry price.
Average winner gains of 26.5% compare with an all-years average of 23%, which means the lone losing year has not dragged the overall profile down very far. The median profit of 28.99% sits slightly above the average, suggesting that the typical winning outcome has been closer to 30% than to the mid-teens. Add it up and stacking this HP Inc. trading window across the 10 midterm election years compounds to a 651% cumulative return.
Intraperiod swings have been meaningful. In the weaker years, maximum adverse moves have reached double digits, including a 27.41% drawdown in 1990 and a 22.6% drawdown in 2018 before the final outcome was booked. Even in strong years like 1986 and 2002, the worst drawdowns were 18.06% and 18.63% respectively, showing that the path to those large gains was not smooth. That is consistent with a TradeWave Ratio of 1.56, which signals that price has typically traveled a fair distance in the trade direction within the window, but with sizable back-and-forth along the way.
The next view combines yearly net results with the full intraperiod range between worst drawdown and best rally.
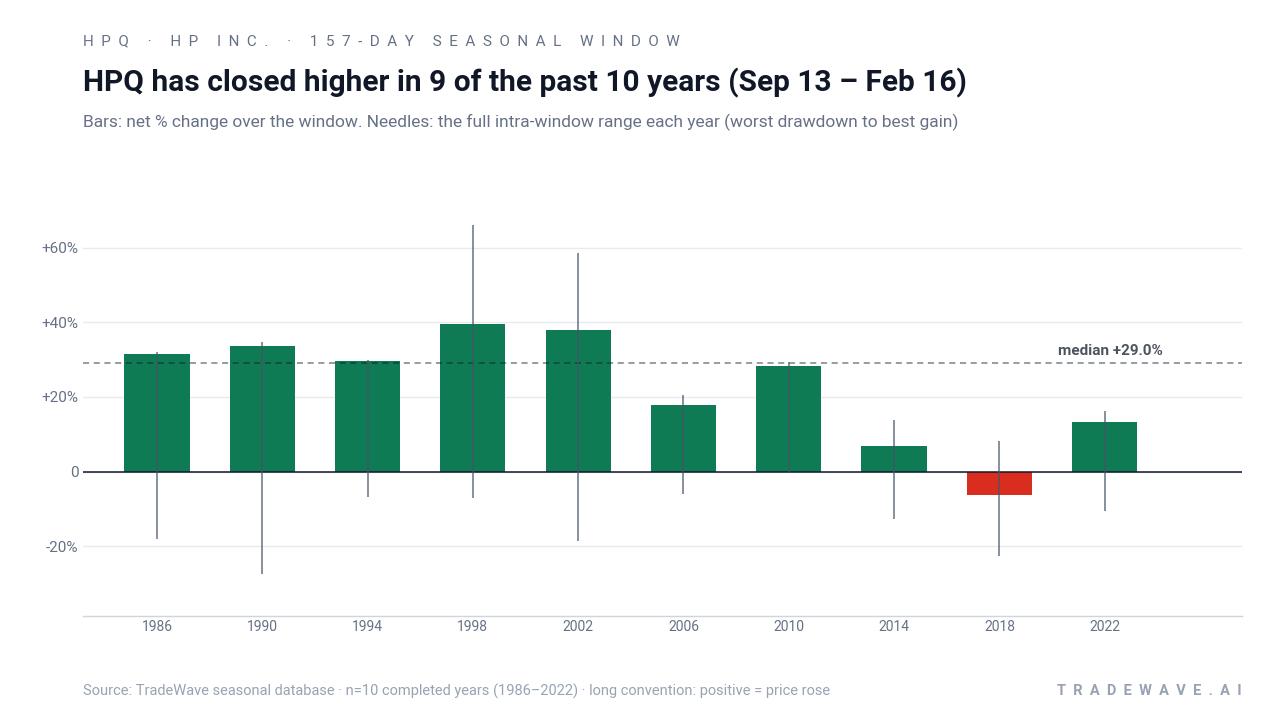
The bars-and-needles profile makes the trade-off clear. In most years the bar ends well above zero, but the needles extend both below and above, reflecting maximum adverse excursions that can exceed 20% and maximum favorable excursions that can run past 50% in the strongest cycles. Historically, this has been a window where HPQ’s upside has dominated by the finish, but where patience has been required to sit through volatility.
History does not guarantee future results; adverse excursions can be large even in winning windows.
Why does HP Inc. (HPQ) follow this seasonal pattern?
One likely driver is the way HP’s fiscal calendar and product cycle line up with the broader presidential election cycle. The Sep–Feb stretch in midterm years often captures back-to-school and holiday PC demand, corporate budget flushes and early positioning for the pre-election year, when risk appetite has historically improved. For a company tied to commercial PC refresh and, more recently, AI-enabled hardware, that combination of spending cycles and shifting policy expectations may help explain why this particular HPQ seasonal pattern has been so consistently positive.
What is driving HP Inc. (HPQ) today?
HPQ slid 3.8% to $30.11 on Monday, giving back part of a sharp 21.22% one-month rally that has carried the stock well above its 50-day moving average near $25.37 and left it about 6.5% below its 52-week high of $32.19. The pullback comes after a stretch of enthusiasm around HP’s fiscal Q2 2026 results, where revenue grew 9% to $14.41 billion and Personal Systems revenue climbed 13% on the back of stronger commercial PC demand, alongside raised full-year EPS guidance tied in part to AI-compatible PCs and infrastructure partnerships.[2] In mid-August, Lenovo’s strong report on AI infrastructure and PC demand helped lift HP shares in premarket trading, reinforcing the narrative that AI-related refresh cycles are becoming a key driver for the stock.[2]
Options and flow data add another layer. On Aug 14, MarketBeat highlighted HP as a target of unusually large options trading, alongside disclosures that insider David P. Mcquarrie sold 21,048 shares on Aug 7 at an average price of $29.98, part of 52,620 insider shares sold over the prior 90 days worth about $1.48 million.[3] Earlier in the year, on May 22, Barchart reported a 15.6% intraday jump in HPQ as traders positioned ahead of earnings on optimism around AI PC demand, underscoring how quickly sentiment can swing when the market leans into the AI hardware theme.[4] In June 2026, Barchart also flagged unusually heavy call volume in July $35 contracts, with call activity running almost 90 times normal levels and implying traders were willing to bet on double-digit upside from then-current prices.[1]
The chart below situates the latest pullback against HPQ’s past year of trading and the median 60-day seasonal path.
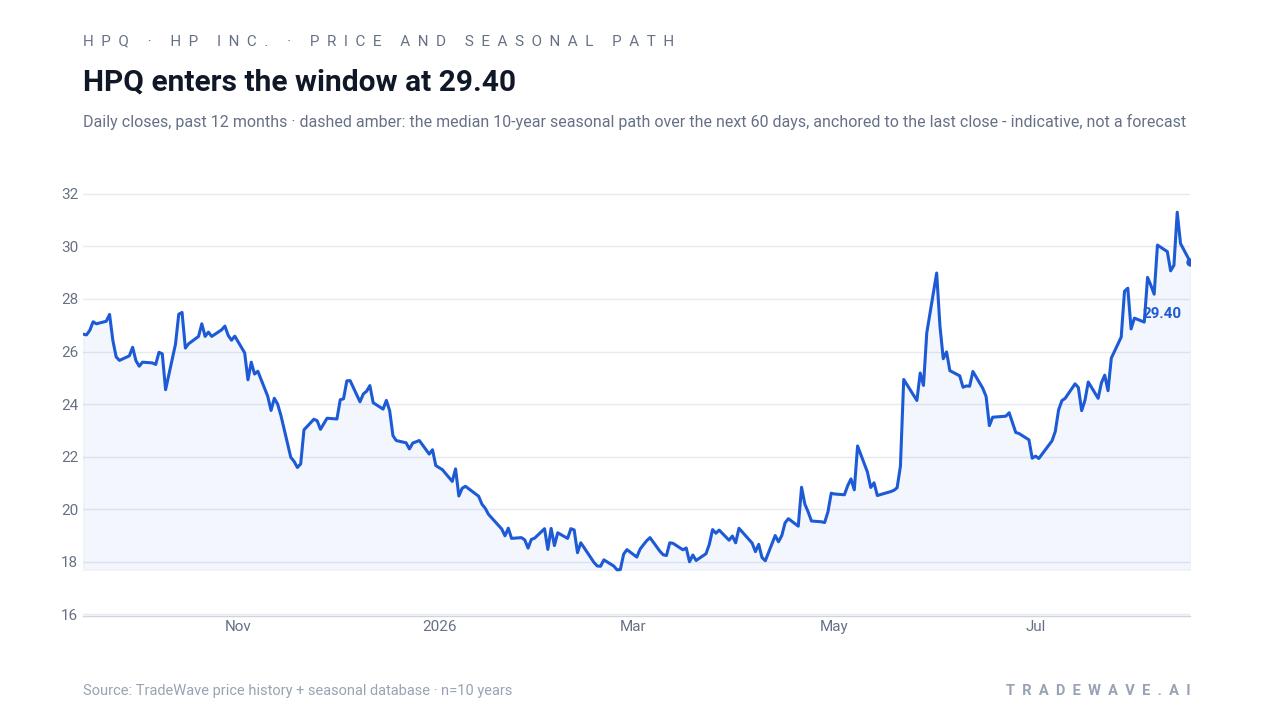
Fundamentally, HP sits at the intersection of traditional PC and printing demand and the newer AI infrastructure build-out. Sector commentary around AI servers and AI PCs has turned more constructive through the summer, with Lenovo’s results cited as validating demand trends that could benefit HP’s Personal Systems and related businesses.[2] That macro and sector backdrop, combined with the stock’s strong midterm-year seasonal window, gives traders a clear calendar to watch as they weigh whether the latest dip is just noise inside a historically bullish stretch or the start of something more durable.
What should traders watch as the Sep 13 window approaches?
First, the calendar. The 157-day HP Inc. trading window opens on Sep 13 and runs through Feb 16, overlapping the back-to-school season, holiday spending and the transition from the midterm election year into the year before the presidential election. Historically, that combination has lined up with stronger risk appetite and a favorable HPQ seasonal trend.
Second, price levels. Traders will be watching whether HPQ can hold above its 50-day moving average on further pullbacks and how it behaves as it retests the low-$30s area near the recent 52-week high. A firm base into early September would echo prior winning years in the pattern, where the stock often consolidated before trending higher through the heart of the window.
Third, the options and flow picture. The earlier burst of call buying in July $35 contracts showed that some investors were willing to pay up for upside exposure ahead of this regime.[1] If similar call-heavy positioning or elevated volume reappears as Sep 13 approaches, it would suggest that the market is leaning into the historical seasonality; a fade in speculative activity, or a shift toward put protection, would argue that traders are more cautious despite the strong track record.
Finally, the policy and earnings calendar. Any updates on AI PC adoption, corporate IT budgets or guidance revisions around HP’s fiscal 2027 outlook will land inside a window that has historically been kind to longs. The key tell will be whether HPQ’s behavior inside this Sep–Feb stretch rhymes with the past 10 midterm election years, where rallies ultimately dominated, or whether a repeat of 2018’s drawdown-heavy pattern signals that this cycle is breaking from the script.
Sources
- Barchart – "HP Inc. Has Unusual Call Options Volume Today - Investors Bullish on HPQ Stock" (Jun 1, 2026)
- Yahoo Finance – "Super Micro, Dell, HP jump" (Q2 FY26 earnings and AI PC commentary)
- MarketBeat – "HP Target of Unusually Large Options Trading (NYSE:HPQ)" (Aug 14, 2026)
- Barchart – "Why Are HP (HPQ) Shares Soaring Today" (May 22, 2026)
About this seasonal analysis
Seasonal pattern data is sourced from TradeWave.ai, which analyzes historical price behavior across annual calendar windows going back up to 30 years. Read the full data methodology or the book The 100-Year Pattern by Afshin Moshrefi (2026 edition). Past performance of seasonal patterns does not guarantee future results. This article is for informational purposes only and does not constitute investment advice.