Advanced Micro Devices (AMD) Has Fallen in 9 of 10 Midterm Fall Windows for Shorts
Advanced Micro Devices is surging in 2026 trading, but a midterm-year Sep 11–Oct 19 seasonal window that has usually meant downside for the stock is now coming into view.
Price as of Aug 14, 2026: $514.39 (last close).

What is the seasonal pattern for Advanced Micro Devices (AMD)?
Advanced Micro Devices has fallen in 9 of 10 years during the Sep 11–Oct 19 midterm-year window, with an average 23.91% gain in winning short years.
- 9 for 10 in this window for the short side, with winning years averaging 23.91% gains for shorts.
- The Sep 11–Oct 19 window spans 39 days across the last 10 midterm election years and has historically been a bearish seasonal stretch for AMD.
- Percent Profitable is 90%, with 9 winning short years and just 1 losing year in the sample.
- Including all years, Avg Profit - All is 20%, reflecting one losing year with an average loss of 12.46% against otherwise strong short outcomes.
- The TradeWave Ratio is 1.74, indicating price has typically traveled meaningfully in the short direction within this window.
- A Sharpe ratio of 1.29 points to a historically favorable risk-adjusted profile for this specific short-seasonal setup.
According to historical data from TradeWave.ai, this midterm-year autumn stretch has behaved very differently from an average month for AMD, and the next iteration is less than a month away.
How has Advanced Micro Devices (AMD) traded in the Sep 11–Oct 19 midterm window?
Advanced Micro Devices has closed lower in 9 of the last 10 midterm election years during the Sep 11–Oct 19 window, making it one of the stock’s most consistently bearish seasonal stretches. The upcoming 39-day window begins on Sep 11, 2026, with AMD currently up 140.19% year to date and trading at 514.39, about 12.0% below its 52-week high of 584.73.[4] That combination of a powerful AI-driven rally and a historically weak midterm-season window is why traders are already circling these dates on the calendar.
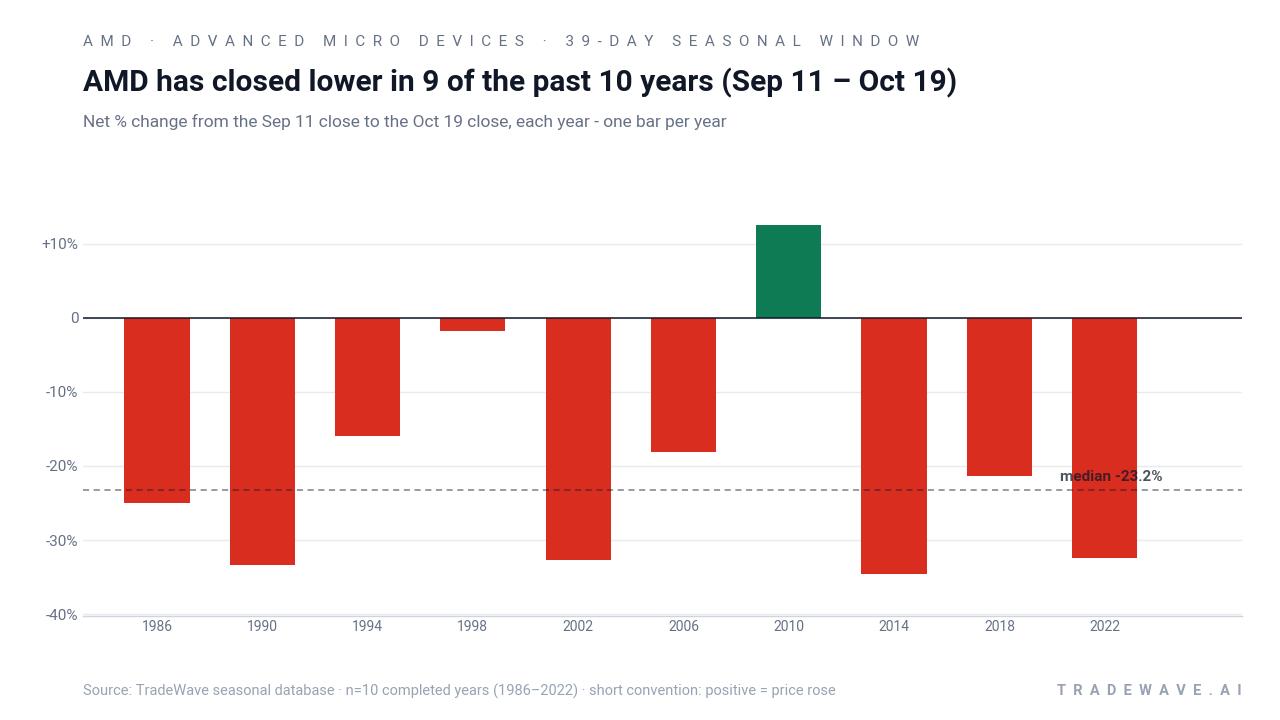
Because this pattern is grouped by the presidential election cycle, it reflects how AMD has behaved specifically in the last 10 midterm election years, a phase that often features policy uncertainty, tighter financial conditions and more volatile risk appetite than the pre-election year that follows.[3] In that context, a short trade direction with a 90% success rate and 20% average all-years gain stands out as an unusually consistent midterm-year seasonal bias.
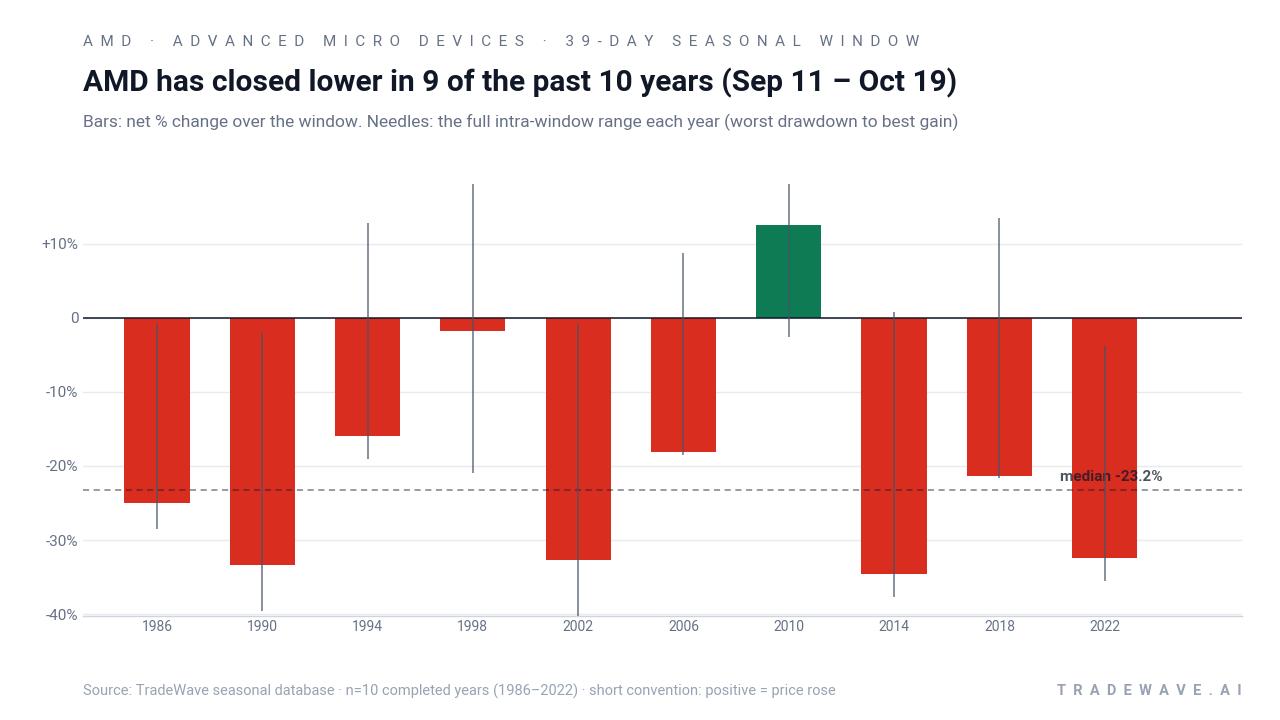
A second view combines yearly net results with the full intraperiod range, highlighting both upside squeezes and downside air pockets.
The per-year record underlines how skewed this AMD seasonal trend has been. In 9 of 10 midterm-year windows, the stock finished the 39-day stretch lower, delivering positive outcomes for the short trade direction. The lone losing year for shorts was 2010, when AMD rallied 12.46% over the window, a reminder that even strong patterns can break.
Average profit of 23.91% in winning short years versus an average loss of 12.46% in the single losing year explains why the all-years average still sits at 20%. Add it up and stacking this window across the sample compounds to a 483% cumulative gain for the short side, a rare level of consistency for a single 39-day slice of the calendar.
The maximum favorable move within the window has at times been even larger than the final net result, showing that shorts have often seen deeper intraperiod gains before covering. At the same time, the maximum adverse move has occasionally been sharp, with years like 1994 and 1998 showing sizable rallies against the short before the stock ultimately rolled over, underscoring the need to respect drawdown risk even in a historically friendly window.
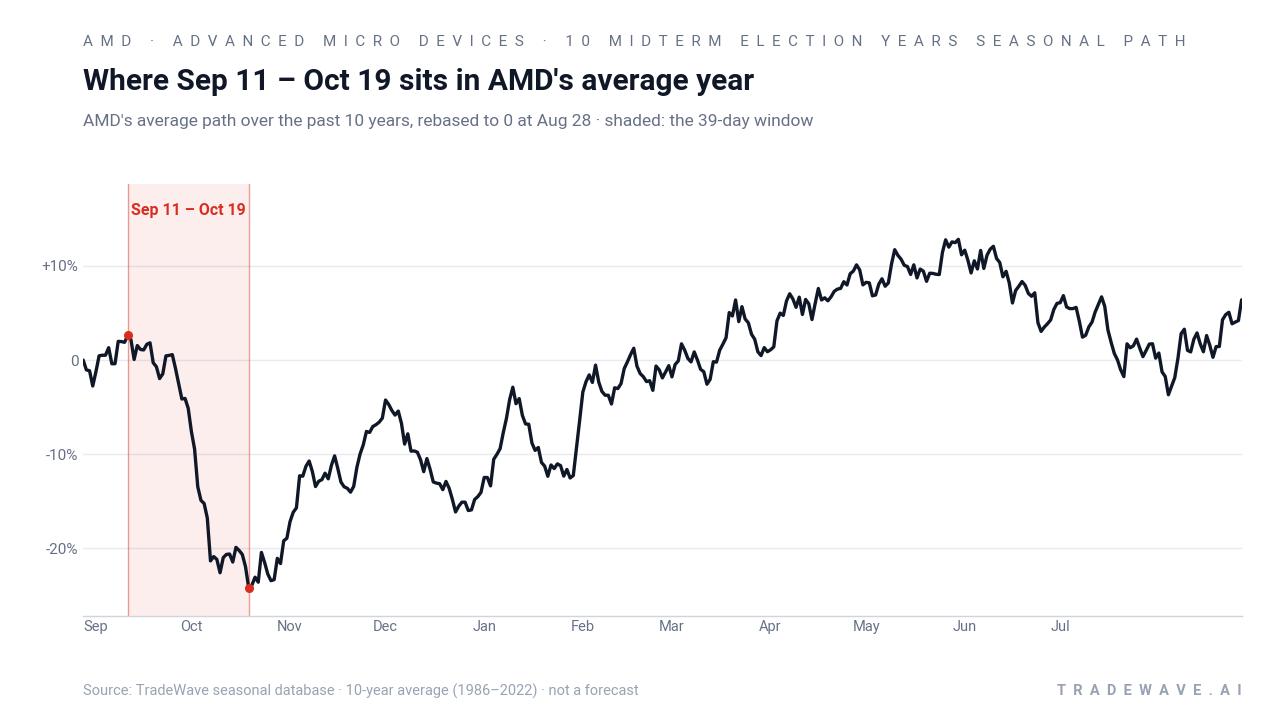
Trend metrics in the pattern suggest that weakness often builds rather than hits all at once. The historical seasonal average shows AMD starting to soften early in the window and then grinding lower into October, rather than collapsing on a single headline day. For traders, that has meant more of a pressure cooker than a sudden air pocket.
History does not guarantee a repeat, but the headline takeaway is simple: in the last 10 midterm election years, this specific Sep 11–Oct 19 window has favored shorts in 9 out of 10 tries, with large average gains when it works.
Why does Advanced Micro Devices (AMD) follow this seasonal pattern?
One likely driver is the way AMD’s earnings calendar and product launches cluster around the back half of the year, which can leave September and early October as a digestion phase between catalysts.[1] Analysts have also pointed to broader midterm-year volatility, when policy debates and shifting rate expectations can hit high-beta semiconductor names harder than the market.[3] This AMD seasonal pattern may reflect that combination of macro jitters and position resets in a stock that has often run hard into the summer on AI and data-center optimism.
History does not guarantee future results, and intraperiod drawdowns can be large even in winning windows, so traders should treat this AMD seasonal pattern as context rather than a forecast.
What is driving Advanced Micro Devices (AMD) today?
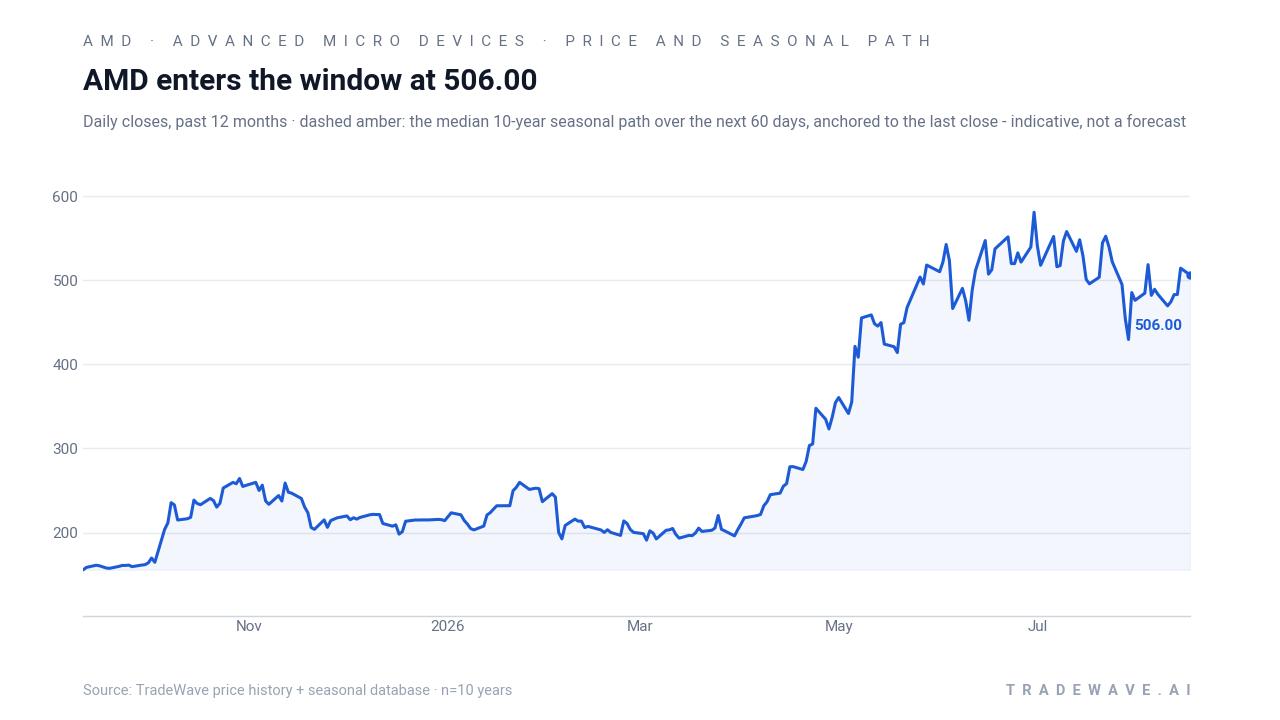
Advanced Micro Devices jumped 6.50% to 514.39 on Monday, extending a powerful run that has left the stock up 140.19% so far in 2026 and about 12.0% below its 52-week high of 584.73.[4] MarketWatch data show AMD has also delivered a 192.03% gain over the past year, putting it among the market’s most aggressive AI winners and leaving valuation front and center for investors weighing fresh exposure.[4][5]
Fundamentally, the story is still about data-center and AI demand. Zacks lists AMD’s next earnings report for Nov 3, with consensus calling for Q3 EPS of $1.90, a 58.33% year-on-year jump that would underscore how quickly the company’s AI and accelerator business is scaling.[2] In February 2026, Morningstar highlighted AMD’s plan for a 60% compound annual growth rate in data-center revenue to reach $100 billion by 2030, alongside a 35% revenue CAGR target over the next three to five years, anchored by GPU and CPU demand in cloud and AI workloads.[3]
That growth narrative is reinforced by product flow. Morningstar notes AMD is bringing MI450 accelerators to OpenAI starting in the third quarter of 2026, with meaningful revenue expected in the fourth quarter, a ramp that could keep data-center momentum elevated into year-end.[3] At the same time, both MarketWatch and The Motley Fool have flagged how the stock’s huge run has stretched traditional valuation metrics versus peers like NVIDIA and Intel, raising the bar for each new earnings print and product update.[1][4][5]
Sector-wide, semiconductors remain the market’s purest AI proxy. MarketWatch and Motley Fool coverage describe a backdrop where investors are paying up for GPU and CPU exposure, but also rotating within the group as leadership shifts between AMD, NVIDIA and other chipmakers depending on quarterly execution and guidance.[4][5] That makes AMD’s upcoming midterm-year seasonal window particularly interesting: the stock is a key sentiment barometer for AI and data-center demand, yet its historical seasonality points to a stretch where rallies have often stalled or reversed.
The chart below situates AMD’s latest surge against its recent 12-month path and a historical 60-day seasonal projection.
What should traders watch in AMD as this seasonal window approaches?
First, the calendar. The Sep 11 start date lands several weeks before AMD’s scheduled Nov 3 earnings report, which means this 39-day window will largely capture positioning and expectations rather than the earnings print itself.[2] Historically, that has been a period when AMD’s strong runs into the summer have given way to profit-taking in midterm years, especially when macro uncertainty around rates and policy is elevated.[3]
Second, levels. With the stock about 12.0% below its 52-week high, traders will be watching whether AMD can sustain prices above the 50-day moving average near 510.40 into early September or whether repeated failures near the prior high start to look like a topping pattern.[4] A decisive break higher through the 52-week high during the window would run counter to the historical AMD seasonal trend, while a series of lower highs and heavier intraday reversals would be more in line with past midterm-year behavior.
Third, catalysts. Any updates on the MI450 rollout to OpenAI, data-center order commentary from cloud providers, or changes to analyst estimates for 2026 and 2027 EPS could either reinforce or overwhelm the seasonal pull.[1][3] If earnings previews and channel checks stay upbeat into late September, the bar for a seasonal pullback gets higher; if concerns about AI spending discipline or competition from NVIDIA creep in, the historical pattern of midterm-year weakness could find a familiar macro backdrop.[3][5]
Finally, watch volatility and intraday swings. The historical MFE/MAE profile shows that even in winning short years, AMD has often staged sharp rallies inside the window before closing lower, which means squeezes against shorts have been part of the playbook rather than an exception. Traders will be monitoring whether any early-September strength fades quickly or persists, and whether downside days come with expanding volume and breadth within semiconductors, which would echo prior midterm-year windows where AMD’s weakness spilled into the broader chip sector.[4][5]
Sources
- MarketWatch: AMD | Advanced Micro Devices Inc. Analyst Estimates (Aug 17, 2026)
- Zacks: What date does Advanced Micro Devices's (AMD) report Earnings - Earnings Calendar & Announcement (Aug 16, 2026)
- Morningstar: AMD Earnings: Data Center Demand Still Looks Quite Strong to Us (Feb 4, 2026)
- MarketWatch: Advanced Micro Devices Inc. Stock Quote (U.S. - AMD) (Aug 17, 2026)
- The Motley Fool: 1 Major Red Flag AMD Investors Can't Afford to Ignore (Aug 16, 2026)
About this seasonal analysis
Seasonal pattern data is sourced from TradeWave.ai, which analyzes historical price behavior across annual calendar windows going back up to 30 years. Read the full data methodology or the book The 100-Year Pattern by Afshin Moshrefi (2026 edition). Past performance of seasonal patterns does not guarantee future results. This article is for informational purposes only and does not constitute investment advice.