Consensus Hold on Ford Motor Company (F) Overlooks a 90% Hit Rate for Midterm Short Trades
Ford Motor Company is heading toward a historically weak late-summer trading window just as the stock grinds higher off its lows and long-dated call buyers lean in.
Price as of Aug 11, 2026: $13.98 (last close).

What is the seasonal pattern for Ford Motor Company (F)?
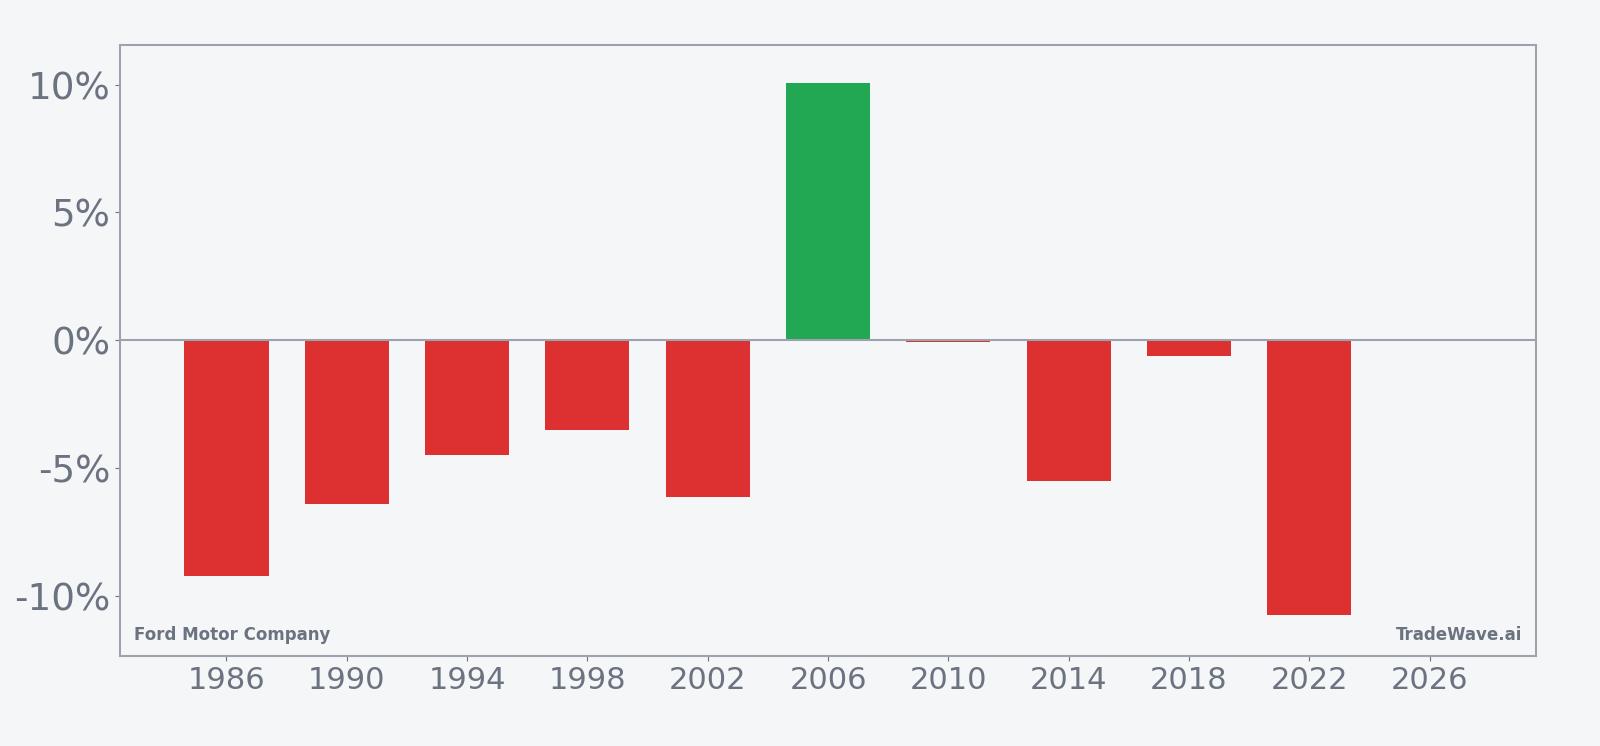
Ford Motor Company has fallen in 9 of 10 midterm-year Aug 16–Sep 14 windows, with an average 5.2% gain in winning years for the short side.
- 9 for 10 in this window, with the short side averaging 5.2% gains in winning years and a 4% average outcome across all years.
- The 30-day trading window runs from Aug 16 to Sep 14 in the last 10 midterm election years and has historically favored downside in Ford shares.
- Percent Profitable is 90%, with 9 winning short years and just 1 losing year in the sample.
- Avg Profit reflects winners only at 5.2%, while Avg Profit - All, which includes the lone losing year, comes in at 4%.
- Maximum adverse moves have reached double digits in several years, showing that intraperiod drawdowns can be sharp even when the short ultimately works.
- Cumulatively, stacking this midterm-year late-summer window has added up to about 41% gains for the short side over the 10-sample history.
According to historical data from TradeWave.ai, Ford’s late-summer behavior in midterm election years has not looked like an average month on the calendar. The next section walks through how that pattern has played out and where the current setup fits.
How has Ford Motor Company (F) traded in this midterm-year late-summer window?
Ford Motor Company has closed lower in 9 of the last 10 midterm election years during the Aug 16 to Sep 14 window, a stretch that has historically rewarded short exposure. Shares finished the prior session at 13.98, up about 37.3% from the 52-week low near 10.18 and still roughly 21.4% below the 17.78 high, leaving room on both sides of the tape. In May 2026, Barchart flagged unusually heavy buying of long-dated Ford call options at the $25 strike expiring in December 2028, a bullish institutional bet that sits awkwardly against this historically weak late-summer pattern.[8]
Because this study groups only midterm election years, it lines up with a specific policy backdrop: Washington is in the middle of the presidential cycle, fiscal debates tend to heat up, and investors often reassess cyclical names like autos around growth and rate expectations. That context matters for Ford, which sits at the intersection of consumer demand, industrial investment and the electric-vehicle policy push.
The upcoming window begins on Aug 16 and spans 30 days. Historically, during this period in midterm election years, Ford has tended to drift lower, with the short side profitable in 9 of 10 years and an average 5.2% gain in those winning shorts. When you include the single losing year, the all-years average outcome for the short side is still a solid 4%, which is unusual consistency for a one-month stock pattern.
The per-year breakdown shows how that has played out. In 1986, a short entered around 1.13 and exited near 1.02, a roughly 9.2% gain for the short, even though the stock briefly rallied more than 6% inside the window before rolling over. In 2022, the short side saw its best net result, with Ford dropping about 10.8% from an entry near 12.51 to an exit around 11.16, and the worst intraperiod drawdown for shorts still only about 1% against them.
Intraperiod swings have not been trivial. Maximum favorable moves for the short side have reached into the high single digits or low teens in several years, while maximum adverse moves have also pushed into double digits at times. That mix means the window has often delivered meaningful downside for shorts but has also forced them to sit through sharp countertrend rallies along the way.
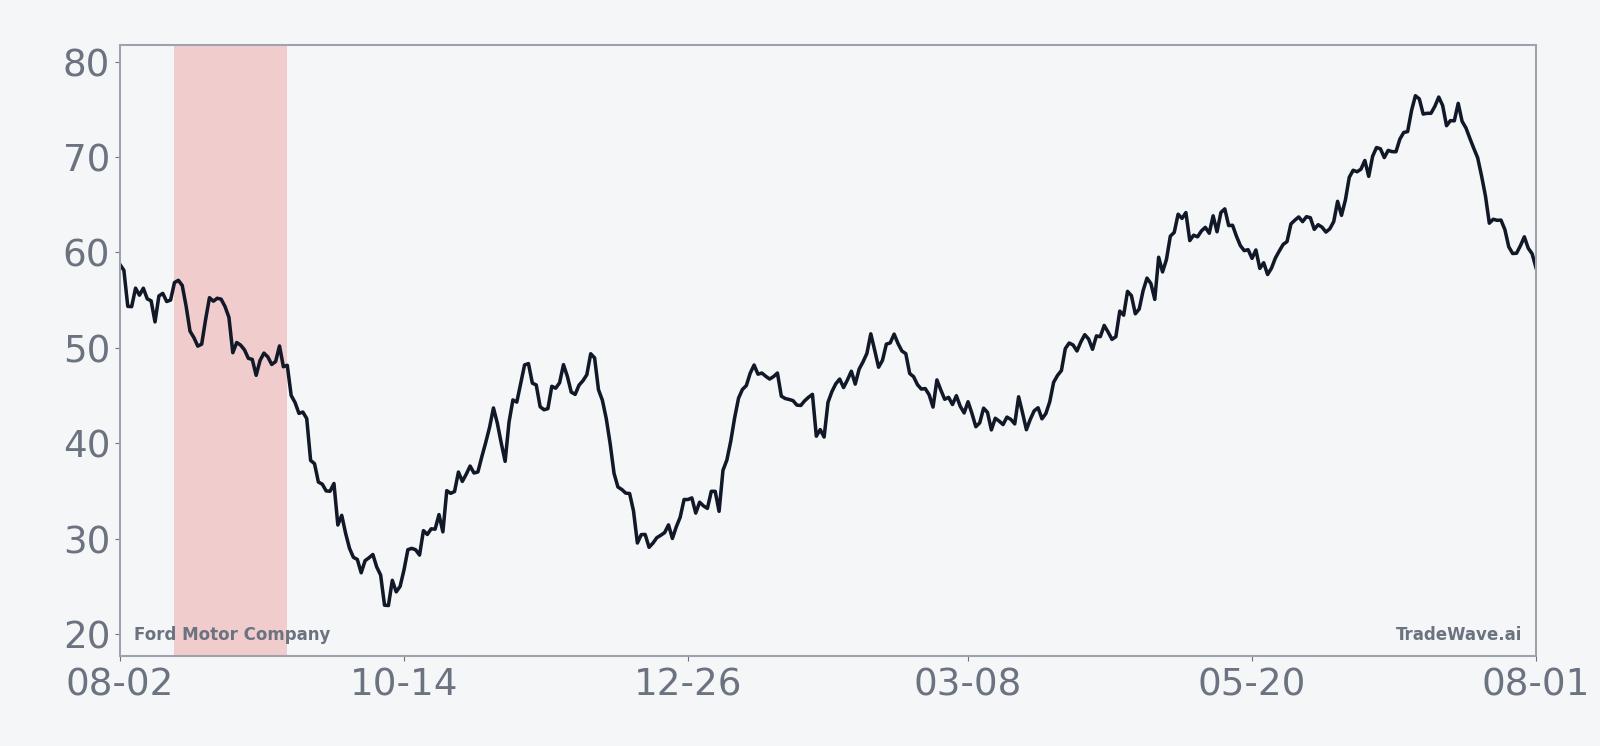
The historical seasonal average path suggests that Ford often stalls heading into this window, then grinds lower rather than collapsing in a straight line. The weakness tends to build through the middle of the 30-day stretch, which lines up with the typical late-August to early-September chop in broader cyclicals.
Yearly net and intraperiod ranges highlight how much room Ford has historically had to move inside this window.
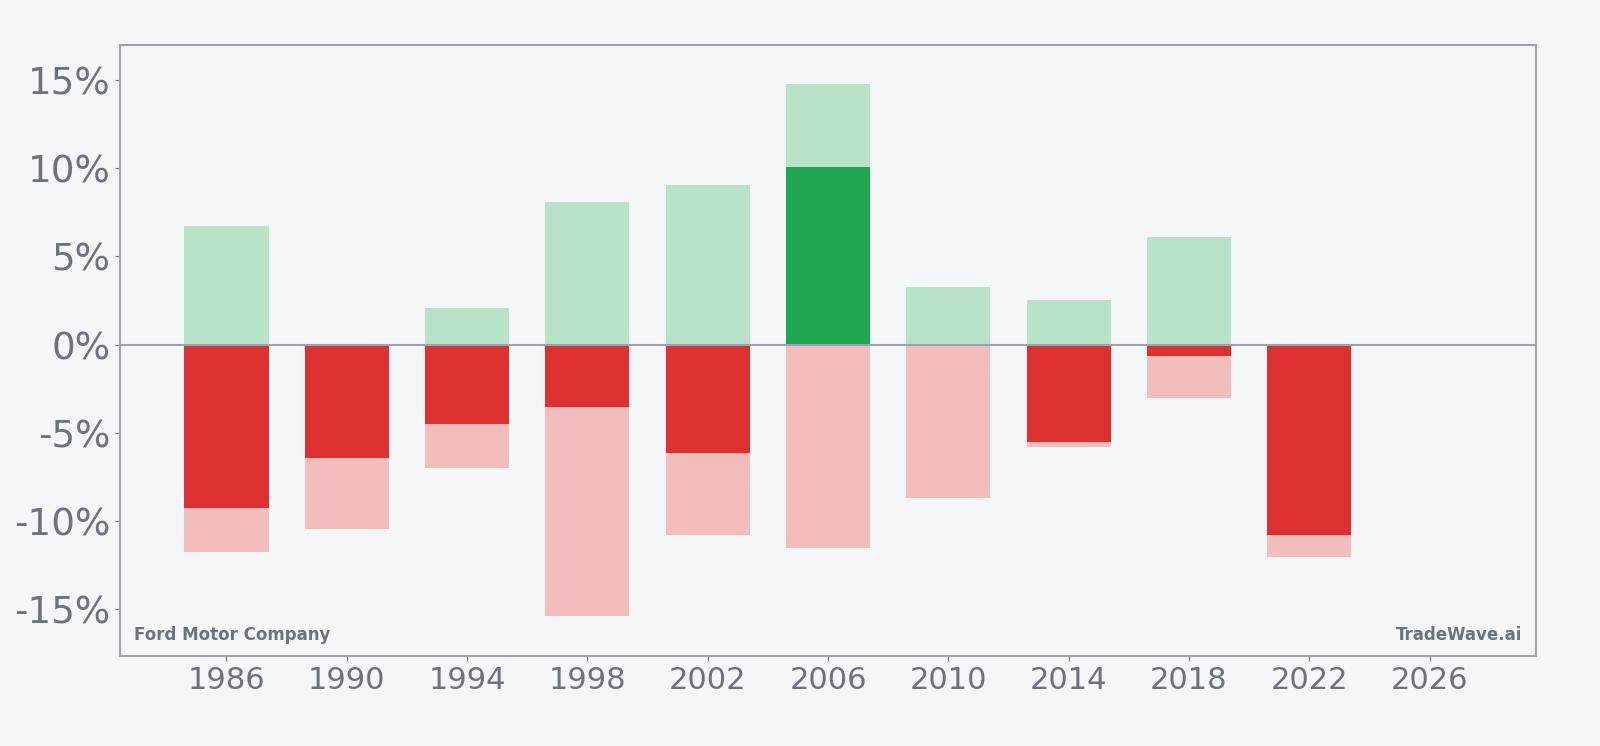
The combined net / MFE / MAE view underlines that this is a high-variance stretch rather than a gentle drift. In several years, the worst drawdown against the short exceeded 10%, while the best move in favor of the short also pushed toward or beyond that level. Add it up: across the 10 midterm-year samples, stacking this 30-day Ford Motor Company trading window has compounded to roughly 41% gains for the short side.
History does not guarantee future results; adverse excursions can be large even in winning windows, and traders can be wrong-footed if the pattern breaks.
Why does Ford Motor Company (F) follow this seasonal pattern?
This midterm-year late-summer pattern may reflect a mix of earnings digestion, sector rotation and macro nerves. One likely driver is that investors often reassess cyclical exposure after second-quarter results, trimming auto stocks as they weigh consumer demand, rates and policy risk heading into the fall.[1] Analysts have also pointed to shifting expectations around Ford’s electric-vehicle strategy and capital spending, which can make the stock more sensitive to macro headlines in this part of the presidential cycle.[2]
What is driving Ford Motor Company (F) today?
Ford shares ended the prior session at 13.98, down 0.1% on the day, leaving the stock up about 13% year to date and trading above its 50-day moving average of roughly 14.43 on heavy average volume near 54.4 million shares. The company is coming off a stronger second quarter, with adjusted EBIT rising to $2.5 billion from $2.1 billion a year earlier and margins improving to 5.2% from 4.3%, which helped management lift full-year EBIT guidance to a range of $10 billion to $11 billion and reaffirm a $0.60 annual dividend that appeals to income-focused investors.[1][3]
Strategically, Ford is leaning into a lower-priced electric pickup strategy, with its Fathom midsize truck slated to start at $28,350 before destination charges and customer deliveries planned for 2027, positioning the company against both legacy rivals and Tesla in the mass-market EV race.[1][7] Coverage comparing Ford with General Motors has framed the automaker as playing catch-up in some EV metrics but improving on profitability and capital discipline, which helps explain the “Hold” consensus rating and a roughly $14.97 average price target from Barchart’s aggregated analyst data.[2][4]
Macro headwinds remain. Analysts have flagged a slowdown in EV adoption even as Ford pushes its UEV platform and eyes-off driving capabilities, a backdrop that could keep sentiment choppy around big product announcements and policy headlines.[2][7] At the same time, Ford’s dividend yield and improving cash flow profile have drawn attention from income investors, who see the stock as a way to collect payouts while waiting for the next leg of the EV transition.[3]
Positioning is another layer. In May 2026, Barchart reported unusually large volume in long-dated Ford call options, with more than 9,000 contracts trading at the $25 strike expiring Dec 15, 2028, alongside a sharp rally from a May low to $15.37 by late month.[8] That kind of bullish, long-horizon options flow suggests some institutions are willing to look through near-term volatility and bet on Ford’s multi-year EV and software roadmap, even if the historical seasonality for the next few weeks has leaned the other way.
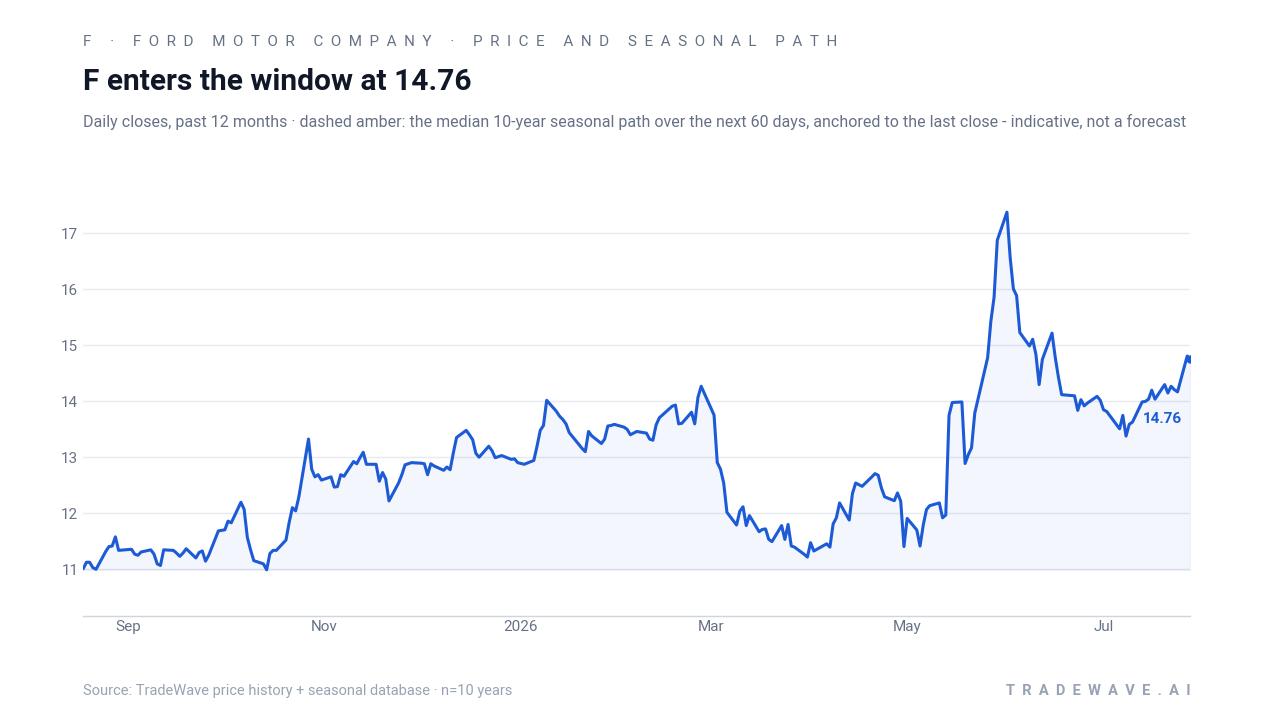
The chart below situates the latest move in its recent multi-month context and overlays the median seasonal path for the coming weeks.
What should traders watch in this Ford Motor Company (F) window?
First, watch how Ford trades as the Aug 16 start date hits. If the stock stalls or starts to fade into early September, that would line up with the historical midterm-year seasonal trend that has favored the short side in 9 of 10 samples. A firm push higher through the window, especially on strong volume, would be a clear break from the usual F seasonal trend.
Second, keep an eye on macro and policy headlines that hit autos and EVs. Any shift in rate expectations, consumer credit conditions or EV incentives could amplify moves in this historically weak stretch for Ford, especially given the company’s big capital commitments to its UEV platform and future BlueCruise capabilities.[1][7]
Third, monitor the options tape and volume patterns. If the long-dated bullish call positioning that surfaced in May continues to build or is joined by fresh upside call buying, it would signal that institutional investors are doubling down on a multi-year bullish view even as the seasonal window opens.[8] On the other hand, a fade in that activity or a pickup in downside hedging would suggest that big players are respecting the historical late-summer risk.
Finally, levels matter. Traders will be watching how Ford behaves around the low-teens zone that has repeatedly attracted buyers over the past year and whether rallies toward the mid-teens get sold during the window. Strength or weakness inside this 30-day slice will not just test a quirky calendar pattern; it will also show how much conviction investors really have in Ford’s EV pivot and dividend story heading into the heart of the presidential election cycle.
Sources
- Yahoo Finance (Insider Monkey republished) — Ford’s (F) $28,350 Electric Pickup Bet Meets A Cheap Stock (Aug 10, 2026)
- Barchart — General Motors vs. Ford: 1 Auto Giant Is Winning the EV Race (Aug 3, 2026)
- Yahoo Finance (Motley Fool republished) — All It Takes Is 1,700 Shares of This High-Yielding Dividend Stock to Generate Over $1,000 in Yearly Dividends. (Aug 9, 2026)
- Yahoo Finance — Rivian Automotive, Inc. (RIVN) quote page with Ford comparatives (Aug 11, 2026)
- CNBC — Ford 'Fathom' electric pickup truck will start at $28,000 (Aug 6, 2026)
- Barchart — Institutional Investors Love Ford Stock - Buying Huge, Unusual Volume of Long-Term Call Options (May 26, 2026)
About this seasonal analysis
Seasonal pattern data is sourced from TradeWave.ai, which analyzes historical price behavior across annual calendar windows going back up to 30 years. Read the full data methodology or the book The 100-Year Pattern by Afshin Moshrefi (2026 edition). Past performance of seasonal patterns does not guarantee future results. This article is for informational purposes only and does not constitute investment advice.