Ford Motor Company (F) Eyes 2028 ‘Eyes-Off’ Driving as 9-of-10 Midterm Late-Summers Signal Downside
Ford Motor Company is approaching a historically weak late-summer trading window just as the stock trades well below its 52-week high and options activity points to big long-term bets.
Price as of Aug 6, 2026: $13.79 (last close).

What is the seasonal pattern for Ford Motor Company (F)?
Ford Motor Company has fallen in 9 of 10 years during this Aug 16 to Sep 14 midterm-year window, with an average gain of 5.2% in winning years.
- 9 for 10 in this window, with an average 5.2% move in winning years and a 4% average across all years.
- Seasonal direction is short from Aug 16 through Sep 14, covering the last 10 midterm election years.
- Percent Profitable is 90%, with 9 winners and 1 loser for the short-side pattern.
- Avg Profit reflects winners only at 5.2%, while Avg Profit - All, which includes losing years, comes in at 4%.
- Average loss in unfavorable years is -10.05%, showing that squeezes against the short can be sharp.
- The TradeWave Ratio of 2.61 and a Sharpe ratio of 0.57 point to a consistent but volatile late-summer setup.
According to historical data from TradeWave.ai, this late-summer stretch in midterm election years has behaved very differently from an average month for Ford. The next section looks at how that election-cycle pattern lines up with today’s backdrop.
How has Ford Motor Company (F) traded in the late-summer midterm-year window?
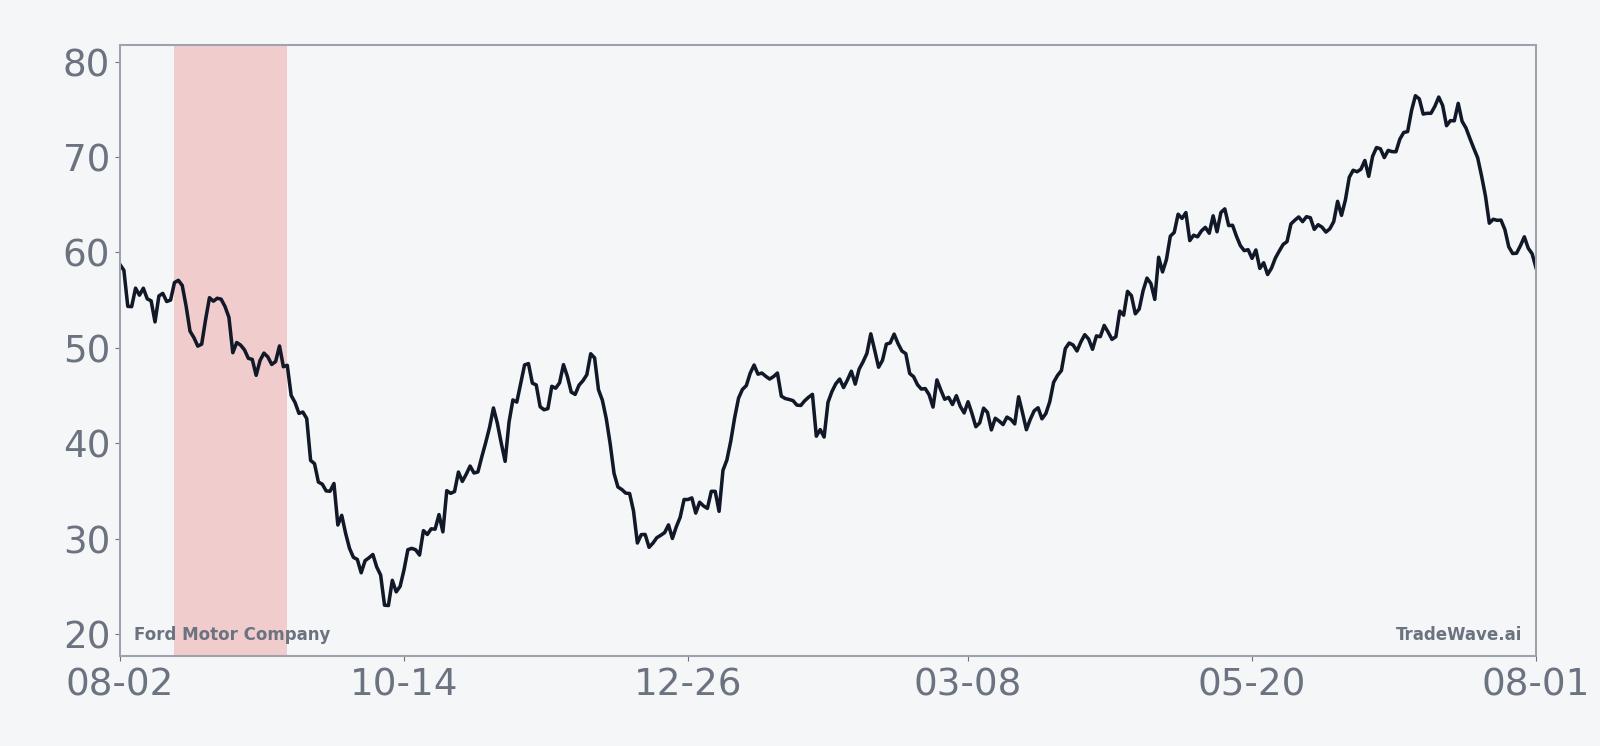
Ford Motor Company has closed lower in 9 of the last 10 midterm election years during the Aug 16 to Sep 14 window, a short-side pattern that has compounded to a 41% cumulative return for bears. Shares finished Friday at 13.79, down 2.4% on the day and about 22.4% below the 52-week high of 17.78, even after a 13% gain year to date. In late July, options desks flagged unusually heavy trading in Ford contracts, including very high single-day volume and outsized call activity that suggests institutions are positioning for bigger long-term swings in the stock.[8][9]
Pattern phase equals the last 10 midterm election years, while the calendar is also in a midterm election year, so this upcoming window lines up cleanly with the political cycle. Grouping by the presidential election cycle matters here because automakers like Ford are sensitive to policy on emissions, EV incentives and defense spending, which often shift meaningfully around midterm votes and into the year before the presidential election.[1][3]
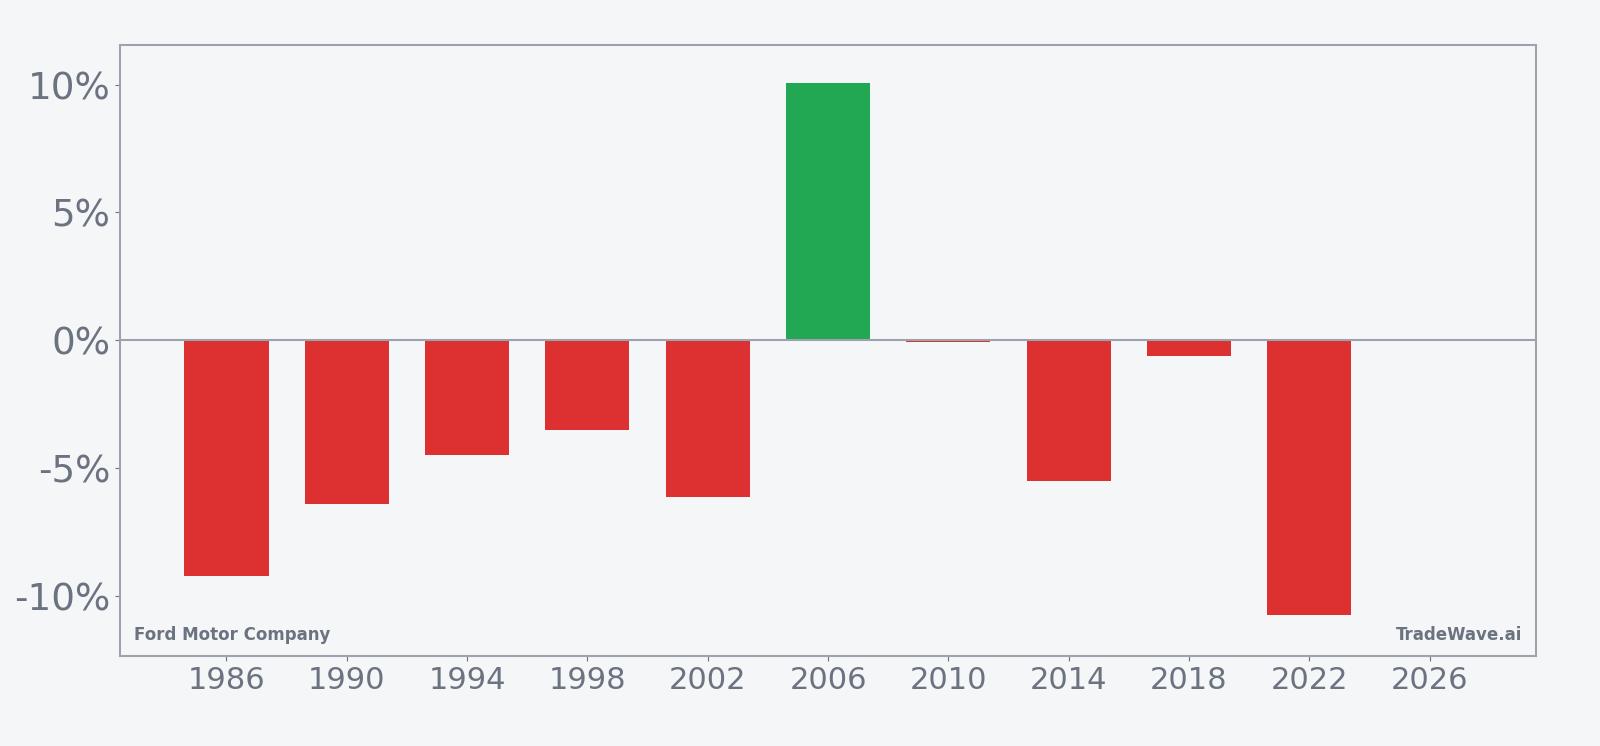
Historically, this 30-day stretch has been a weak seasonal window for Ford when viewed through a short lens. Percent Profitable sits at 90%, with 9 winning short years and just 1 losing year, and the all-years average outcome for the short is a 4% gain. The average winning year delivered a 5.2% move in the trade direction, while the single losing year saw the stock rally roughly 10.05% against the short, underscoring that squeezes have been painful when they occur.
The maximum favorable move and maximum adverse move inside the window show why traders treat this period with respect. In several years, the best intraperiod drop from entry has pushed into double digits, while the worst intraperiod rally against the short has also stretched into the low teens, highlighting a high-variance environment. The TradeWave Ratio of 2.61 indicates that, on average, Ford has tended to travel meaningfully in the short direction at some point during the window, even when the final close did not capture the full swing.
The next view stacks net results with the full intraperiod range, from worst drawdown to best rally, for each year.
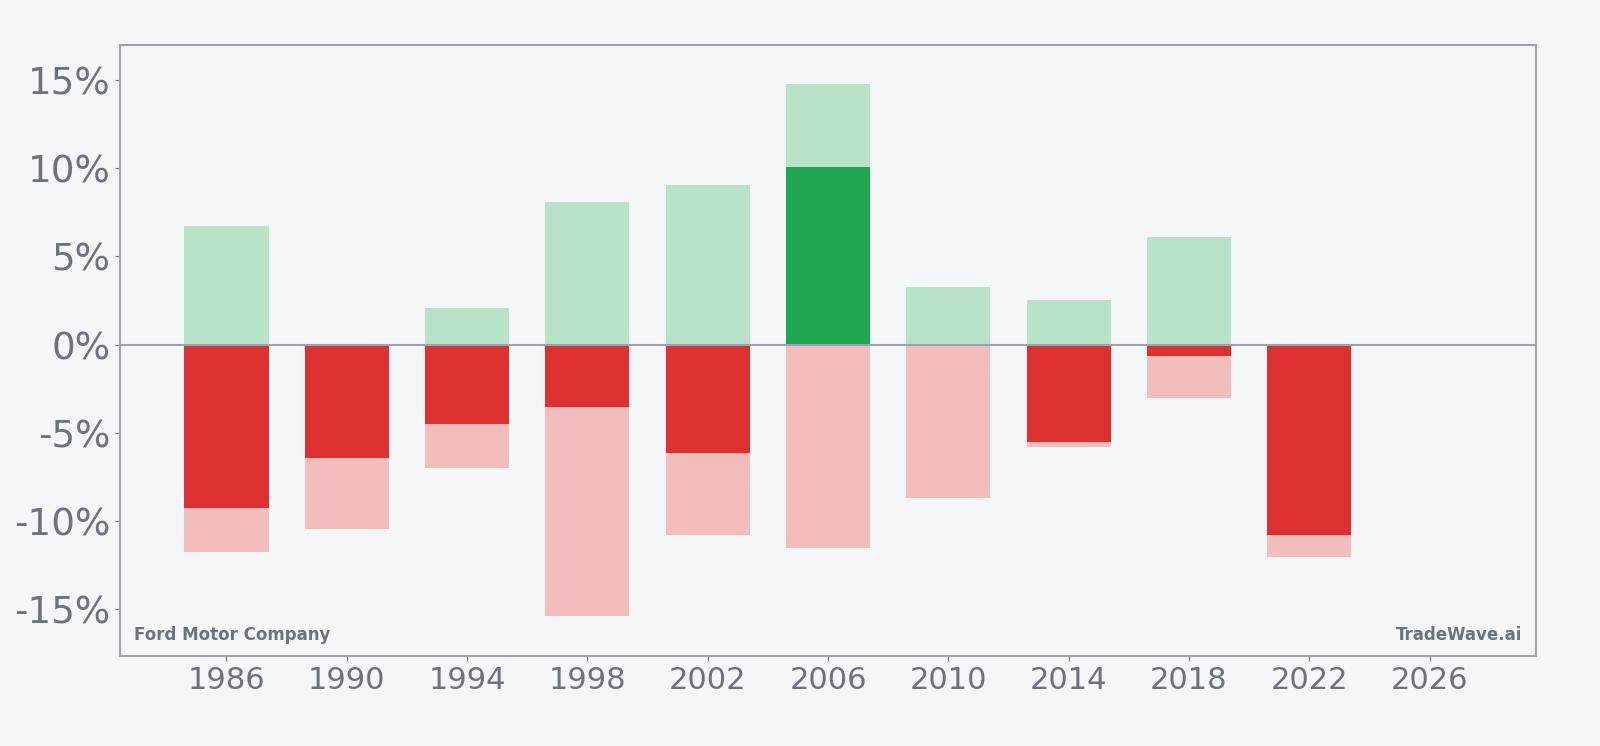
Across the 10 midterm-year samples, the cumulative return of repeatedly running this short-side window adds up to 41%, which is a striking record for such a tight slice of the calendar. The pattern is clear: this window has favored shorts in 9 of 10 years, with average gains of 5.2% in winning years and only one sharp squeeze against the trade.
Why does Ford Motor Company (F) follow this seasonal pattern?
One likely driver is the way midterm election years cluster policy uncertainty around emissions rules, EV incentives and federal spending, which can weigh on cyclical names like Ford late in the summer.[1][3] Analysts have also pointed to portfolio rebalancing and sector rotation ahead of the year before the presidential election, when investors often shift toward growth and tech and away from traditional autos. This pattern may also reflect timing around Ford’s product and capital-spending cycle, as investors reassess margins and cash flow after midyear results.
History does not guarantee future results; adverse excursions can be large even in winning windows, and intraperiod rallies against the short have at times exceeded 10%.
What is driving Ford Motor Company (F) today?
Ford shares closed at 13.79 on Friday, down 2.4% on the session, leaving the stock about 22.4% below its 52-week high of 17.78 but still up 13% so far in 2026. The move comes after Ford reported adjusted EBIT of 2.5 billion dollars in the second quarter, up from 2.1 billion dollars a year earlier, and raised full-year adjusted EBIT guidance to 10 billion to 11 billion dollars alongside a 6 billion to 7 billion dollar adjusted free cash flow outlook.[2][3] That combination of improving profitability and a still-depressed share price relative to the past year has kept value-focused investors engaged even as the broader EV race remains intense.[3]
Strategically, Ford is leaning into a diversified mix of gasoline, hybrid and more affordable EV offerings, rather than chasing premium EV volumes at any cost.[3] Recent analysis highlights the company’s push into hybrids like the F-150 Hybrid and Maverick Hybrid, which can support margins while Ford works to scale its EV platforms.[3] At the same time, some commentators see a potential long-run catalyst in defense, arguing that automakers such as Ford could unlock incremental revenue by expanding into military and government vehicle contracts as defense budgets evolve.[1]
On the flow side, options and volume data have been noisy. MarketBeat reported unusually high options trading in late July, with very heavy single-day contract volume in Ford, while Barchart in May documented more than 9,000 long-dated 25-dollar strike calls expiring in December 2028, a structure that points to institutional investors targeting substantial upside over a multi-year horizon.[8][9] Those flows sit awkwardly against a near-term seasonal pattern that has historically favored shorts, which is why traders are watching whether the recent call buying reflects hedging, outright bullish positioning or a mix of both.
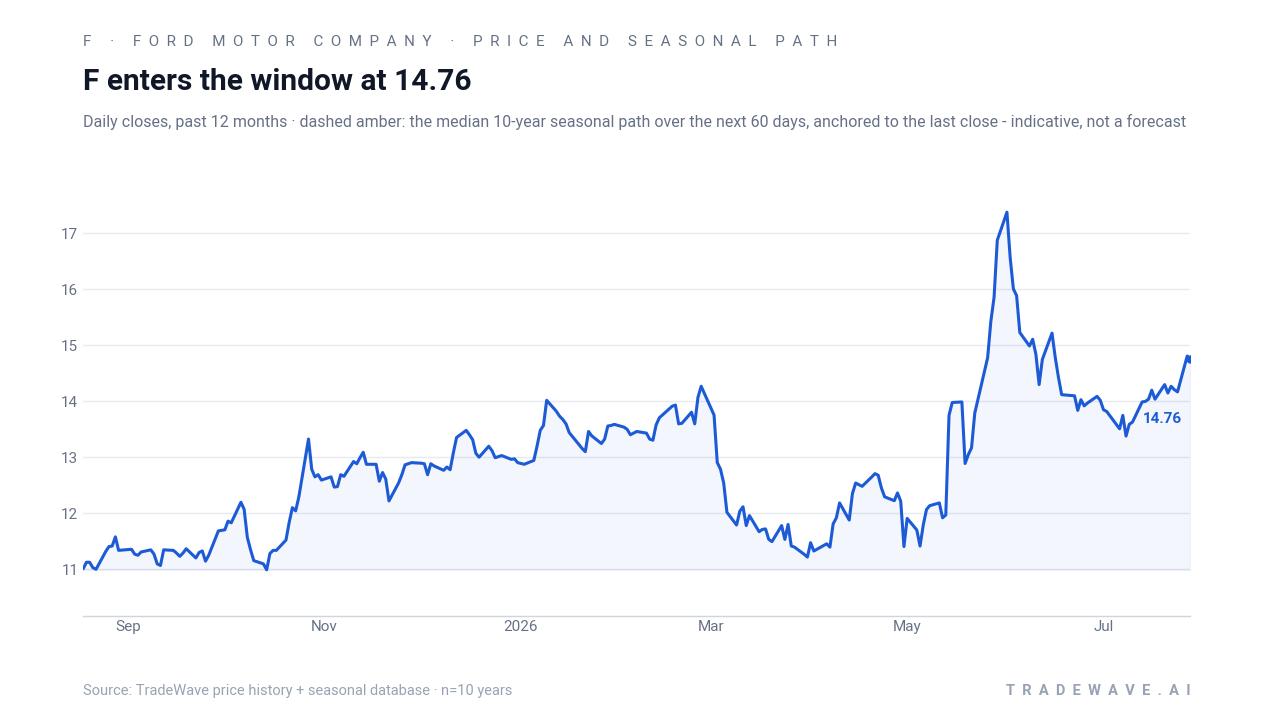
The chart below situates the latest pullback against Ford’s past year of trading and a historical seasonal projection for the next two months.
What should traders watch in this late-summer window for Ford Motor Company (F)?
First, the calendar: the 30-day midterm-year window begins on Aug 16 and runs through Sep 14, so any pickup in volatility or trend change during that stretch will be viewed against a backdrop where shorts have historically had the edge. Price-wise, traders will be watching how Ford behaves between roughly 13 and 15 dollars, and whether rallies toward the mid-teens get sold in line with the historical pattern or instead trigger a squeeze more like the lone losing year for the short.
Second, the policy and macro calendar matters. Any headlines around U.S. emissions standards, EV tax credits, or defense spending could quickly change how investors value Ford’s hybrid and EV roadmap and its potential to win government contracts, especially as the market looks ahead to the year before the presidential election.[1][3] A supportive policy tone could blunt the usual late-summer weakness, while renewed uncertainty could reinforce it.
Finally, the Special Insight around options and volume bears close monitoring. If the unusually heavy long-dated call activity and high options volumes continue to build into and through the window, that would suggest institutions are willing to lean into upside risk even as the historical pattern points the other way.[8][9] If, instead, options flow cools or flips toward protective puts while volume spikes on down days, that would look more consistent with the past 10 midterm-year windows, where short-side trades have typically found traction.
Sources
- The Motley Fool, “Investors Are Overlooking 1 Catalyst That Could Drive Billions in Profits at Ford and GM,” Aug 4, 2026.
- The Motley Fool, “Ford Says It Will Deliver Eyes-Off Driving in 2028. The Market Prices Ford at 9 Times Forward Earnings,” Jul 31, 2026.
- Yahoo Finance, “General Motors vs. Ford: 1 Auto Giant Is Winning the EV Race,” Aug 4, 2026.
- MarketBeat, “Ford Motor Target of Unusually High Options Trading (NYSE:F),” Jul 29, 2026.
- Barchart, “Institutional Investors Love Ford Stock - Buying Huge, Unusual Volume of Long-Term Call Options,” May 26, 2026.
About this seasonal analysis
Seasonal pattern data is sourced from TradeWave.ai, which analyzes historical price behavior across annual calendar windows going back up to 30 years. Read the full data methodology or the book The 100-Year Pattern by Afshin Moshrefi (2026 edition). Past performance of seasonal patterns does not guarantee future results. This article is for informational purposes only and does not constitute investment advice.