Copart (CPRT) Sinks Near 52-Week Low as Used-Car Demand Softens Into Weak Midterm Window
Copart is hovering just above a fresh 52-week low as it heads toward a late-summer window that has historically leaned lower in midterm election years.
Price as of Jul 30, 2026: $29.57 (last close).

What is the seasonal pattern for Copart (CPRT)?
Copart has fallen in 6 of 7 years during this Aug 18 to Oct 3 midterm-year window, with an average gain of 11.61% in winning years for the short setup.
- 6 for 7 in this window for the short side, with Copart closing lower in 6 of the last 7 midterm election years.
- Percent Profitable is 86%, with 6 winners and 1 loser for the short trade across the sample.
- Avg Profit in winning years is 11.61%, while Avg Profit - All, including the lone losing year, is still a strong 10%.
- The 47-day window runs from Aug 18 to Oct 3 and has compounded to an 88% cumulative return for the short strategy over the seven midterm-year samples.
- Intraperiod swings have been meaningful, with several years showing double-digit adverse moves before the trade finished in the short side’s favor.
- The TradeWave Ratio of 1.51 and Sharpe ratio of 1.33 point to a historically efficient short window, albeit with notable drawdown risk.
According to historical data from TradeWave.ai, this late-summer stretch for Copart has behaved very differently in midterm election years than in a typical calendar month.
How has Copart (CPRT) traded in the late-summer midterm-year window?
Copart has closed lower in 6 of the last 7 midterm election years during the Aug 18 to Oct 3 window, a clear bearish seasonal trend for the stock. Today shares finished at $29.57, down 4.1% on the session and sitting about 41.0% below the 52-week high of $50.11 while only 10.3% above the 52-week low of $26.81.[6]
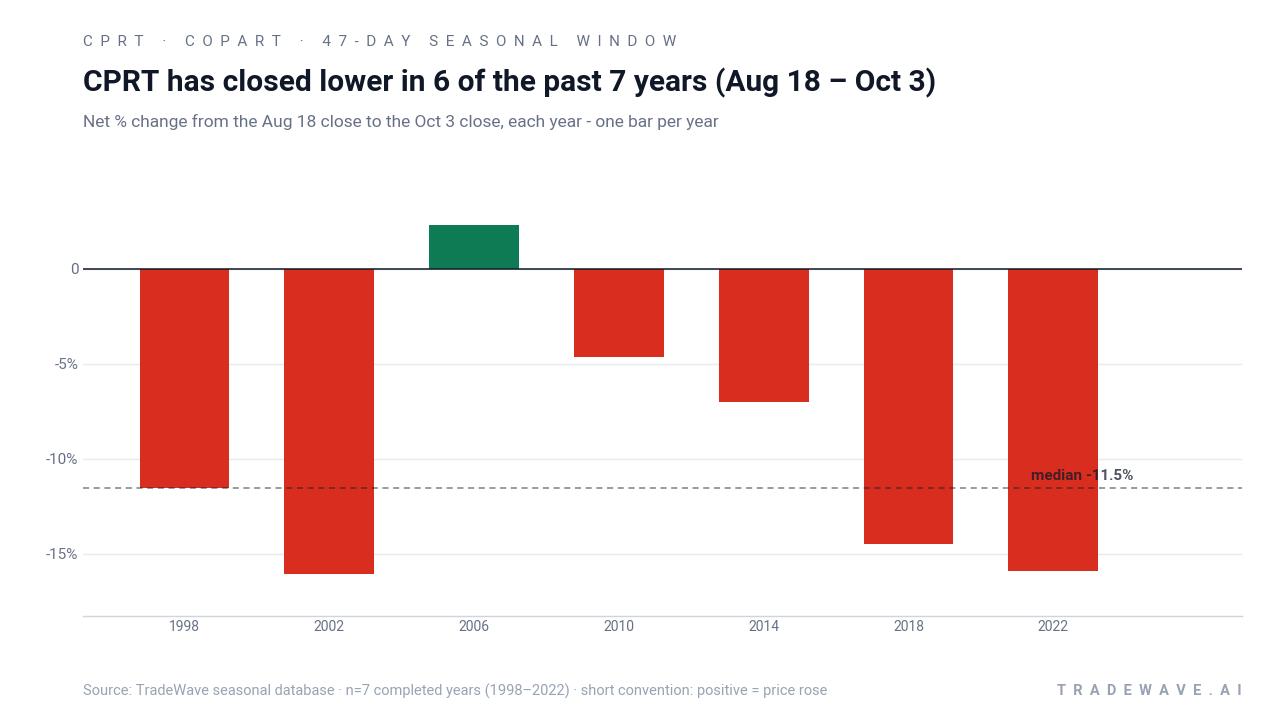
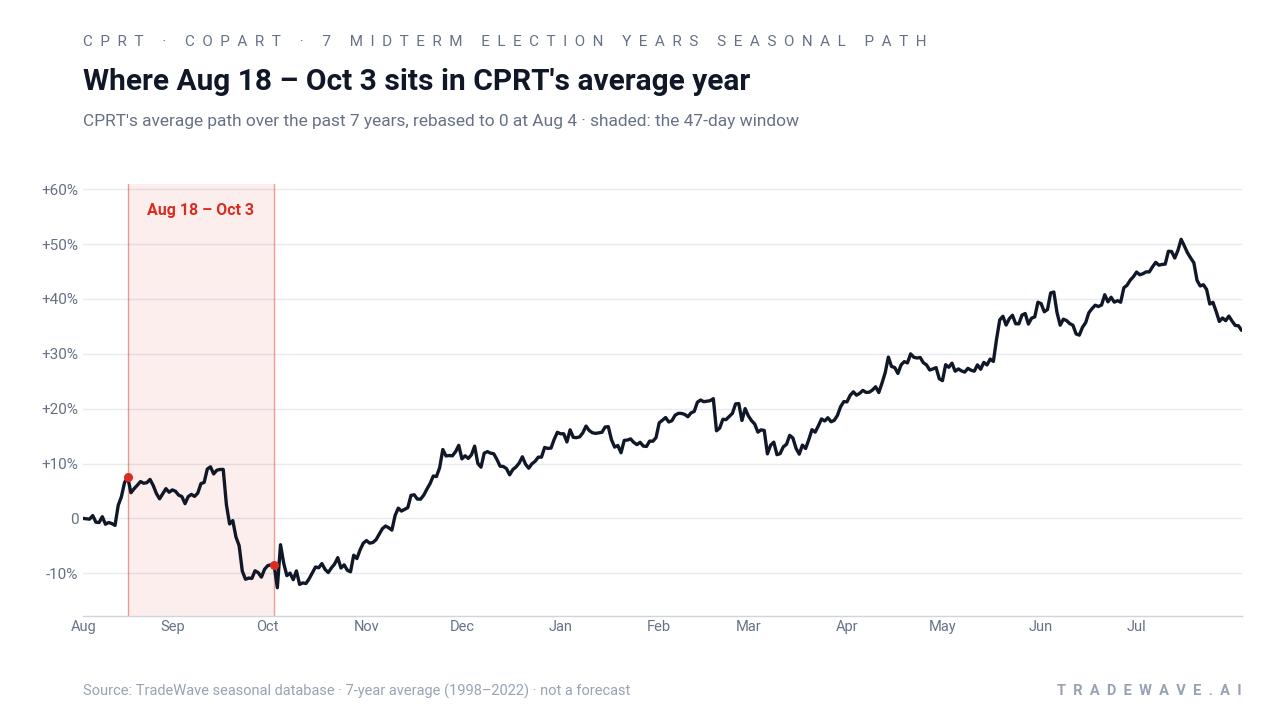
Grouping the data by the presidential election cycle matters here because this pattern only looks at the last seven midterm election years, a phase that often brings policy uncertainty, shifting fiscal priorities and choppier trading in economically sensitive names. Copart sits squarely in that midterm year today, with this 47-day window beginning on Aug 18 and running into early October, just as investors will be digesting both macro headlines and the company’s next earnings report.
For this specific Copart trading window, the trade direction is short. Across the seven midterm-year samples, the short side has been profitable 86% of the time, with 6 winners and just 1 losing year. Average profit in the winning years is 11.61%, while the all-years average, which includes the single losing outcome, still comes in at 10%.
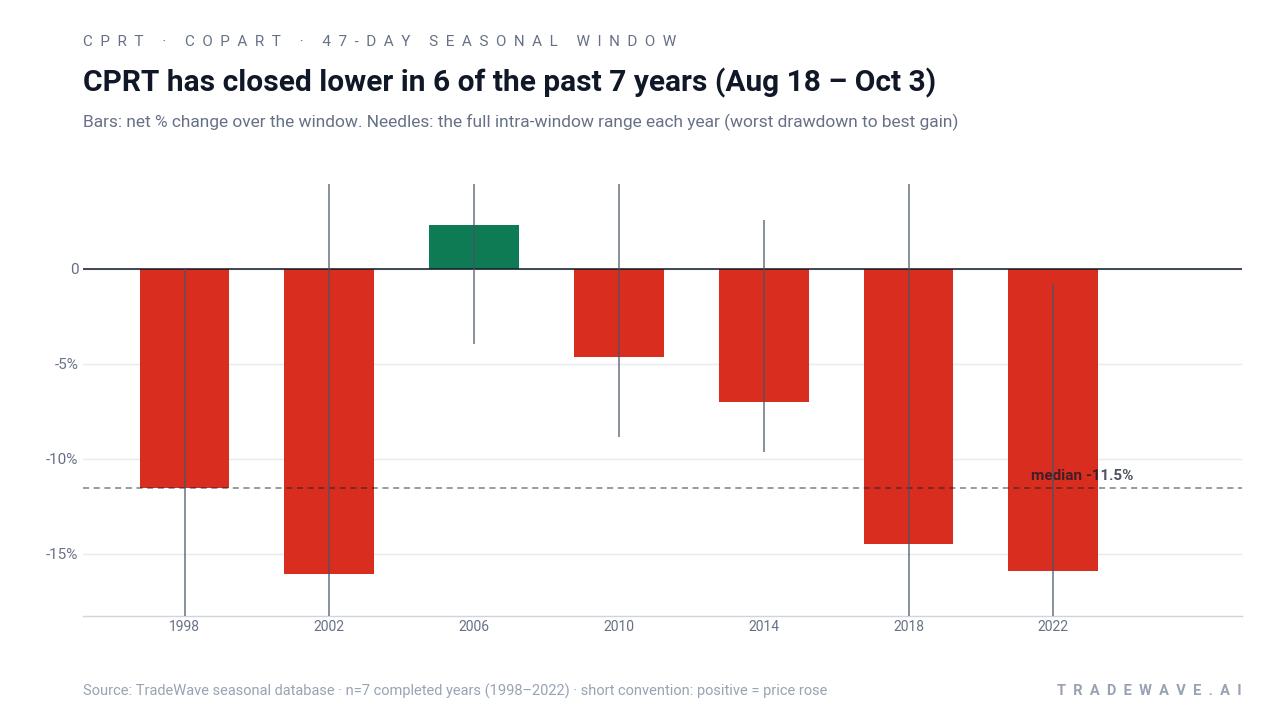
The per-year table shows how that plays out in practice. The strongest year for the short setup was 2002, when the window delivered a net return of -16.05% for the stock, meaning a sizable gain for shorts, even though price briefly rallied as much as 14.81% intraperiod before rolling over. The weakest year for the pattern was 2006, when Copart actually rose 2.27% over the window, turning that iteration into a losing trade for shorts despite a relatively modest worst drawdown of -3.98% from the entry.
Intraperiod swings have been meaningful. In 1998, Copart’s worst drawdown from the short entry, or maximum adverse excursion, reached -34.62% even though the window ultimately finished with an 11.54% decline in the stock. In 2018, the stock’s worst drawdown from the short entry was -18.81%, while the best move in the short direction, the maximum favorable excursion, reached 8.75% before the window closed with a 14.46% drop in the share price.
Across all seven years, the TradeWave Ratio of 1.51 suggests that price has typically traveled a meaningful distance in the short direction within the window, independent of where it finished. The Sharpe ratio of 1.33, based on end-of-window outcomes, points to a historically attractive risk-adjusted profile for the short strategy in this specific late-summer slice of the calendar.
A second view shows how each year’s net result lines up with its best and worst intraperiod swings.
Stacking the seven midterm-year windows together produces an 88% cumulative return for the short strategy, a rare level of consistency for a single 47-day slice of the calendar. The pattern is clear: this has been a late-summer stretch where Copart has tended to drift or break lower more often than not, even when the broader market backdrop was constructive.
Why does Copart (CPRT) follow this seasonal pattern?
One likely driver is the clustering of Copart’s earnings and guidance updates around late summer, which can reset expectations for salvage volumes, used-car pricing and margin trends in the auction and valuation services sector.[1][2][5] Analysts have also pointed to midterm-year policy uncertainty and shifting risk appetite as reasons investors trim exposure to economically sensitive business services names in this part of the cycle.[5][6] The combination of company-specific catalysts and a noisier macro tape may help explain why this particular late-August to early-October window has repeatedly favored the short side.
History does not guarantee future results; adverse excursions (MAE) can be large even in winning windows.
What is driving Copart (CPRT) today?
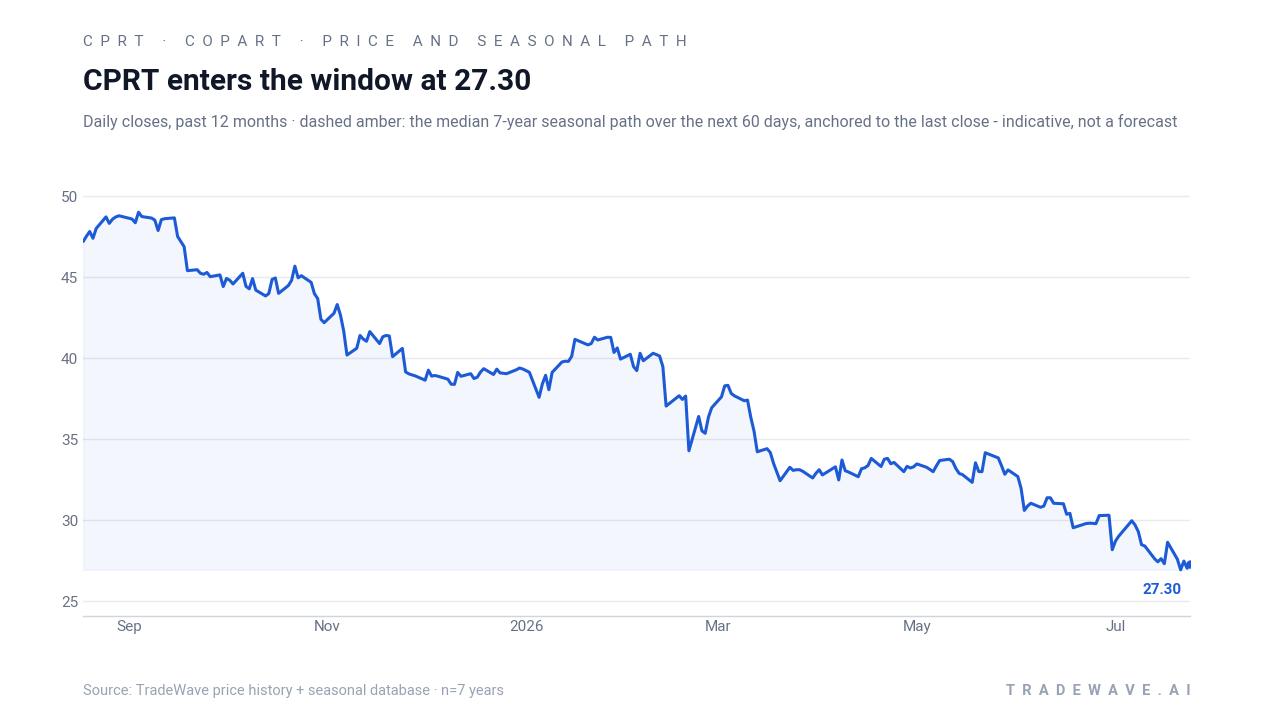
Copart fell 4.1% on Jul 31 to $29.57, extending a slide that has taken the stock sharply off its 52-week high of $50.11 and left it trading only about 10.3% above its 52-week low of $26.81.[2][6] The move continues a rough July in which the stock has repeatedly set or approached new one-year lows as investors reassess growth expectations and valuation for the auto auction specialist.[1][3][6]
Fundamentally, Copart is coming off a quarter where it beat on both earnings and revenue, posting $0.43 in EPS versus a $0.41 consensus and roughly $1.237 billion in revenue against estimates near $1.19 billion.[1][3] Even so, coverage from Zacks and MarketBeat notes that the shares have lagged the broader market, with investors focusing on a softer industry ranking for business services and questions about how used-car and salvage volumes will trend into year-end.[2][3][5] The next scheduled catalyst is the company’s expected earnings report on Sep 2, 2026, which lands squarely inside the upcoming seasonal window and could either reinforce or disrupt the historical late-summer pattern.[1][2]
Ownership data also show some institutional trimming, with filings from London Co. of Virginia and AIA Group Ltd both disclosing reduced positions in Copart in late July.[8][9] At the same time, ChartMill data flag short interest around 4.7%, a level that is notable but not extreme for a stock that has seen its narrative shift from “wide-moat compounder” to “rare discount” over the past few months.[7][8][10] Add it up and Copart is heading into a historically weak seasonal stretch with a bruised chart, cautious institutional flows and a key earnings update on the calendar.
The chart below situates the latest slide against Copart’s past year of trading and a median seasonal projection.
What should traders watch as Copart (CPRT) approaches this window?
First, the calendar: the 47-day midterm-year window begins on Aug 18 and runs through Oct 3, overlapping Copart’s expected Sep 2 earnings release. How the stock trades around that report, especially if it gaps sharply and then either follows through or fades, will be a key test of whether the historical short-friendly pattern is still in play.[1][2]
Second, levels matter. On the downside, traders will be watching whether Copart revisits or breaks below the 52-week low near $26.81, which would extend the pattern of lower lows that has defined the past several weeks.[6] On the upside, any sustained move back above the 50-day moving average around $30.12 would signal that buyers are starting to push back against the seasonal tendency, especially if that strength holds through the bulk of the window.[7]
Third, positioning and flows could shape how volatile this window becomes. Short interest around 4.7% is enough to fuel squeezes if earnings or macro news surprise positively, but it also reflects a cohort of investors already leaning into the bearish seasonal trend.[7][8] Watching whether that short interest builds or recedes into late August will help gauge whether the trade is getting crowded or still has room to run.
Finally, the macro and policy backdrop for the midterm election year will stay in focus. Any shifts in rates, consumer credit conditions or used-car demand that show up in sector commentary could either reinforce the historical pattern of late-summer weakness in Copart or blunt it if investors decide the worst is already priced in.[2][5][6] For traders who care about seasonality, the message is straightforward: this has been one of Copart’s more reliable bearish windows, and the way the stock behaves between Aug 18 and Oct 3 will show whether that midterm-year script still holds.
Sources
- MarketBeat, "Copart (NASDAQ:CPRT) Sets New 1-Year Low - What's Next?" (Jul 15, 2026)
- Zacks, "Copart, Inc. (CPRT) Stock Sinks As Market Gains: Here's Why" (Jul 30, 2026)
- MarketBeat, "Copart (NASDAQ:CPRT) Reaches New 1-Year Low - Here's Why" (Jul 21, 2026)
- Yahoo Finance / Simply Wall St, "How The Copart (CPRT) Narrative Is Shifting With Lower Price Targets And Earnings Concerns" (May 5, 2026)
- Zacks, "Copart, Inc. (CPRT) Falls More Steeply Than Broader Market: What Investors Need to Know" (Jul 17, 2026)
- Yahoo Finance, "Copart, Inc. (CPRT) Stock Price, News, Quote & History" (Jul 28, 2026)
- ChartMill, "CPRT Stock Price, Quote & Chart | ChartMill.com" (Jul 25, 2026)
- MarketBeat, "London Co. of Virginia Trims Stock Holdings in Copart, Inc. $CPRT" (Jul 26, 2026)
- MarketBeat, "AIA Group Ltd Decreases Position in Copart, Inc. $CPRT" (Jul 20, 2026)
- Seeking Alpha, "Copart: A Wide-Moat Compounder Trading At A Rare Discount (NASDAQ:CPRT)" (May 7, 2026)
About this seasonal analysis
Seasonal pattern data is sourced from TradeWave.ai, which analyzes historical price behavior across annual calendar windows going back up to 30 years. Read the full data methodology or the book The 100-Year Pattern by Afshin Moshrefi (2026 edition). Past performance of seasonal patterns does not guarantee future results. This article is for informational purposes only and does not constitute investment advice.