Copart (CPRT) Has Dropped in 6 of 7 Midterm Aug-Oct Windows as 2026 Short Season Opens
Copart is up nearly 25% this year, but an August-to-October window that has usually seen the stock slip is about to open, creating a tension between strong momentum and tricky seasonality.
Price as of Aug 13, 2026: $29.39 (last close).

What is the seasonal pattern for Copart (CPRT)?
Copart has fallen in 6 of 7 years during this Aug 18 to Oct 3 midterm-year window, with an average 11.61% gain in winning years for the short setup.
- 6-for-7 record: This midterm-year Aug 18 to Oct 3 window has seen Copart move in favor of the short trade in 6 winners versus 1 loser.
- High hit rate: Percent Profitable is 86%, with 6 winners and 1 loser across the last 7 midterm election years in this 47-day stretch.
- Return profile: Avg Profit on winning short years is 11.61%, while Avg Profit - All, including the lone losing year, is still a sizable 10% move in the trade direction.
- Risk-adjusted strength: The Sharpe ratio of 1.33 and a TradeWave Ratio of 1.51 point to a historically efficient short window relative to its volatility.
- Drawdown behavior: Individual years have seen adverse moves against the short position as deep as roughly 34% before finishing the window, underscoring meaningful intraperiod swings.
- Election-cycle angle: The pattern is built only from the last 7 midterm election years, tying Copart’s seasonal trend to a specific phase of the presidential cycle.
According to historical data from TradeWave.ai, this late-summer stretch for Copart behaves differently in midterm election years than in a typical calendar year, and the next iteration is only days away.
How has Copart (CPRT) traded in the upcoming Aug 18 to Oct 3 window?
Copart has moved in favor of the short side in 6 of the last 7 midterm election years during the Aug 18 to Oct 3 window, with a cumulative 88% gain for the short setup across those cycles. Shares finished the latest session at 29.39, up 1.4% on the day and roughly 24.9% higher year-to-date, leaving the stock well off its 52-week low of 26.81 and below its 50.11 high.[3]
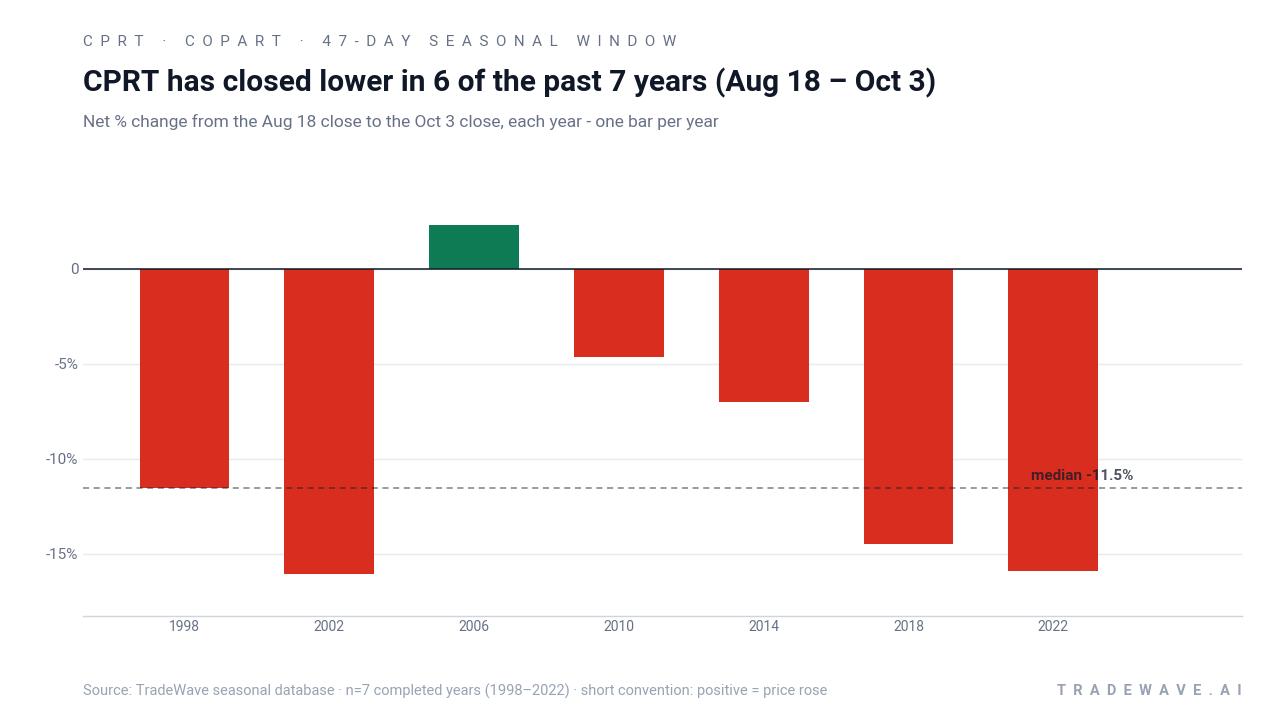
The pattern is grouped by presidential election cycle, not by consecutive calendar years. That means the sample only includes the last seven midterm election years, a phase where policy uncertainty, tariff debates and shifting fiscal priorities have often hit business services stocks unevenly.[3][6] For Copart, that mid-cycle backdrop has lined up with a tendency for the stock to soften in late summer even when the broader trend has been constructive.
Trade direction for this setup is explicitly short. In other words, years where Copart fell over the 47-day window count as winners for the pattern, while rallies count as losing years. Across those seven midterm-year samples, Percent Profitable sits at 86%, with 6 winners and just 1 loser, a strong skew for a single stock window.
On magnitude, the average winning year delivered an 11.61% move in favor of the short, while including the lone losing year still leaves Avg Profit - All at 10%. That gap between winners-only and all-years averages is modest, which suggests the one losing year did not fully erase the gains from the stronger down cycles. The median outcome of 11.54% is close to the average, hinting that the typical winning year has not been dominated by a single outlier.
Intraperiod swings have been meaningful. In 1998, the short setup ultimately worked, but the worst move against the position, or maximum adverse excursion, reached roughly 34.62% before the window closed. In 2002, the short again finished ahead, yet the stock traded as much as 32.1% higher than the entry at one point, a sharp squeeze against shorts before rolling over. Even in 2018, a favorable year for the pattern, Copart saw an adverse move of 18.81% inside the window before finishing lower.
On the favorable side, maximum favorable excursions have often been sizable as well. In 2002, the best intraperiod move in the trade direction reached 14.81%, while 2018 saw an 8.75% favorable swing. The 2022 midterm year was unusual in that the best intraperiod move was slightly negative at -0.8%, yet the window still closed with a 15.92% gain for the short setup, reflecting a more one-way decline.
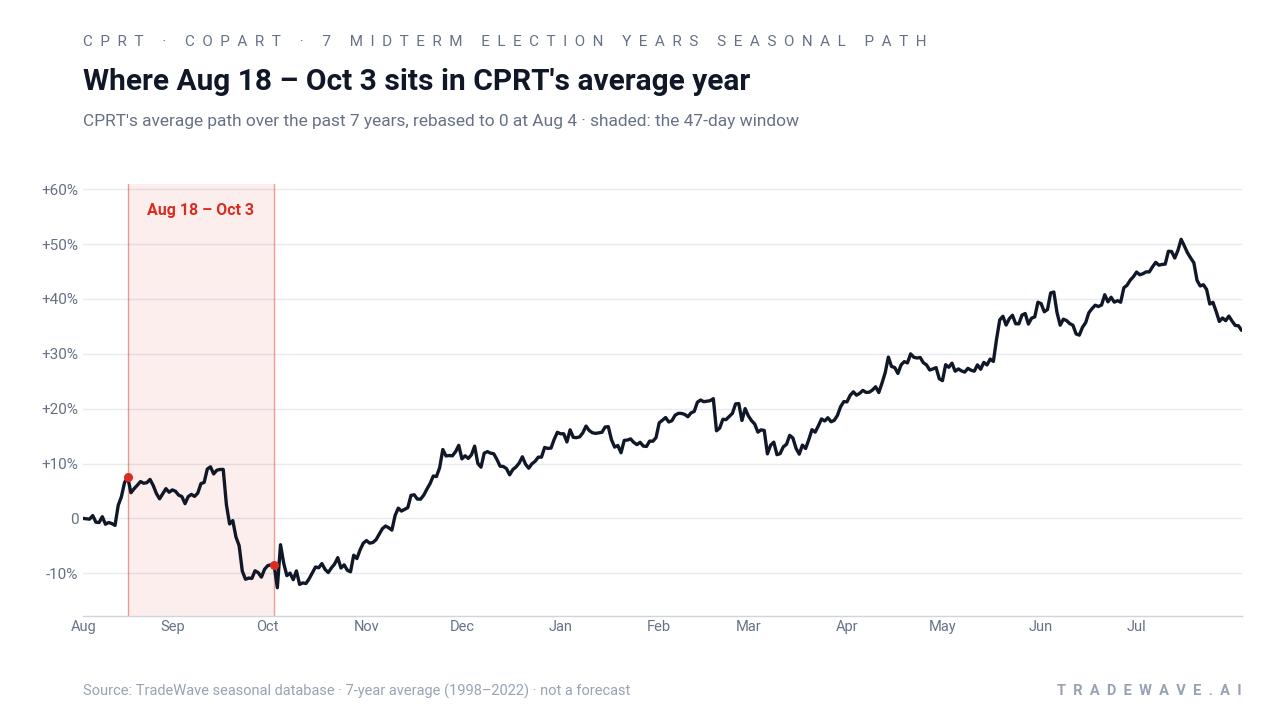
The historical seasonal average chart shows Copart’s typical year flattening and then tilting lower around this late-August window. The shaded 47-day stretch tends to capture a period where prior gains stall and drift into a more persistent slide, consistent with a short-favored pattern rather than a choppy sideways range.
The per-year bar chart with full intraperiod ranges shows how far Copart has swung both for and against the short setup inside this window.
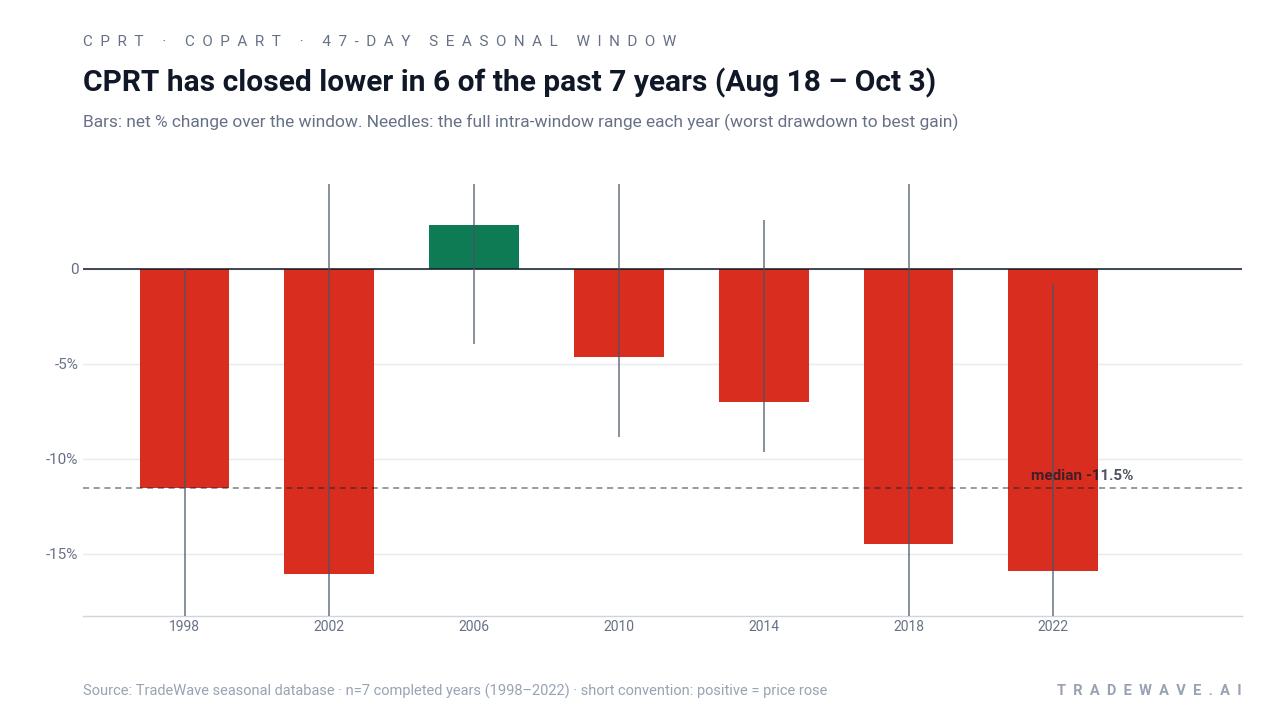
The combined net / maximum favorable / maximum adverse chart makes one thing clear: this has been a high-conviction but bumpy short window. Most years finish with the stock lower, yet the intraperiod ranges are wide, with both sharp squeezes and deep follow-through moves showing up inside the same 47-day span. Add it up and the compounded result across the seven midterm-year samples is an 88% cumulative gain for the short strategy.
History does not guarantee future results; adverse excursions (MAE) can be large even in winning windows.
Why does Copart (CPRT) follow this seasonal pattern?
One likely driver is the way midterm election years cluster regulatory and tariff headlines into late summer, which can weigh on business services names tied to auto volumes and salvage pricing.[3][6] Analysts have also pointed to institutional portfolio repositioning ahead of the fiscal year-end for many funds, which can prompt profit-taking in stocks that have outperformed into August.[2][3] For Copart, that combination of policy noise and positioning may help explain why this specific Aug 18 to Oct 3 window has repeatedly favored the short side in midterm years.
What is driving Copart (CPRT) today?
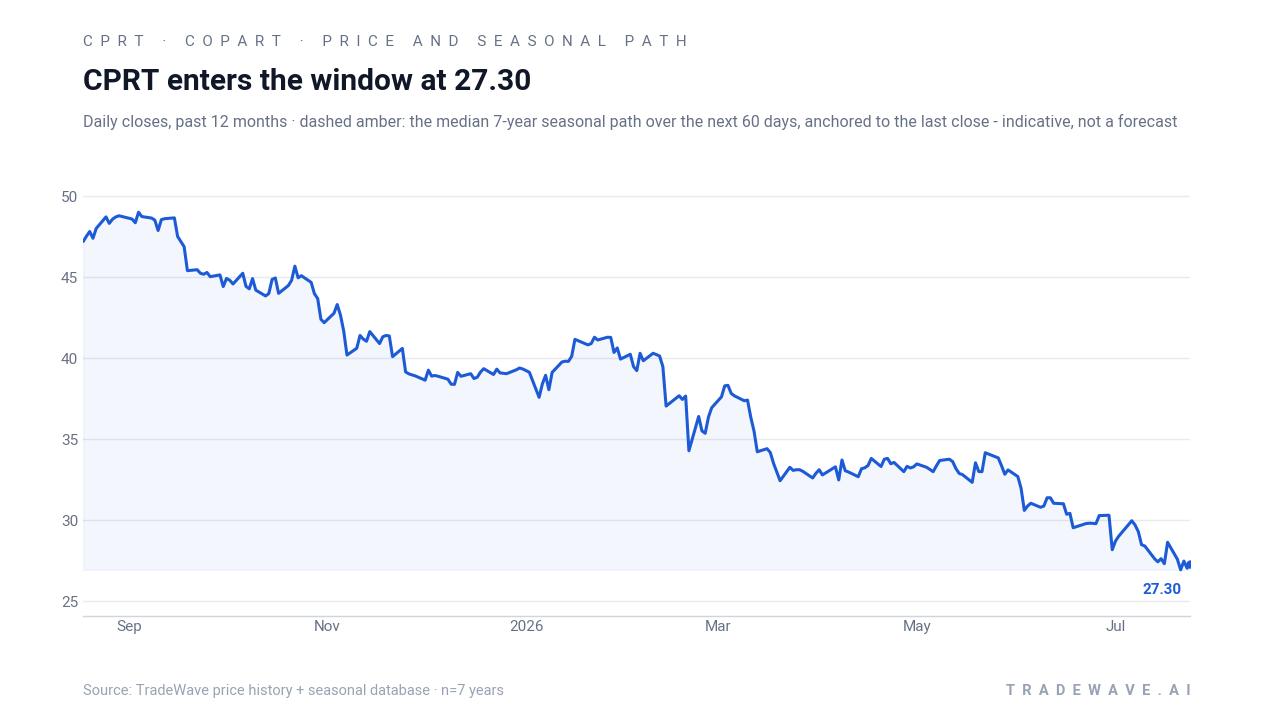
Copart closed Friday at 29.39, up 0.40 on the day, a 1.4% gain that extends its one-month advance to 6.27% and its year-to-date climb to 24.9%. The stock is trading near its 50-day moving average of 29.33, with 20-day average volume around 11.0 million shares, suggesting the latest move is happening on slightly lighter-than-typical turnover rather than a volume spike.[3]
On the fundamental side, Copart last reported quarterly results on May 21, when Q2 FY26 revenue of $1.24 billion and diluted EPS of $0.43 both came in modestly ahead of consensus, yet the stock slipped after the print as investors focused on unit growth commentary and valuation.[1][9] Sector commentary around specialty business services has been mixed through 2025 and 2026, with some underperformance tied to macro uncertainty and tariff chatter that can affect vehicle flows and pricing power.[3][6]
Analyst sentiment is balanced. Yahoo Finance aggregates a Hold consensus on Copart, with a blended price target around 40.3 that still sits well above the current share price, though some targets were trimmed earlier this year as growth expectations cooled.[2][3][4][5] Zacks highlighted a higher mean target of $46.22 in May, but that figure reflected a different price regime and more optimistic assumptions about upside from current levels.[8]
Ownership trends remain supportive. MarketBeat reported in August that Rockland Trust Co. holds a $20.16 million stake in Copart, while other filings show additional institutional buying through late July, reinforcing the stock’s status as a core holding for many long-only managers.[11][12] At the same time, CEO Jeffrey Liaw sold 27,745 shares on Jul 28 for proceeds of about $845,945, a modest sale relative to overall insider ownership of 9.60% that nonetheless gives traders another data point to weigh as the seasonal window approaches.[11]
The chart below situates the latest move in its recent multi-month context and overlays the historical seasonal path for the next 60 days.
What should traders watch in this Copart (CPRT) seasonal window?
First, the calendar. The 47-day midterm-year window opens on Aug 18 and runs through Oct 3, overlapping a period when policy headlines and tariff talk have often been loudest in past cycles.[6] If Copart starts to stall or roll over into that stretch despite a strong year-to-date run, it would be consistent with the historical pattern of late-summer softness.
Second, price levels and volatility. Traders will be watching how the stock behaves around the 50-day moving average near 29.33 and the recent 52-week low at 26.81.[3] A break below that lower band during the window would echo prior midterm-year down legs, while a firm hold above the moving average with contained intraperiod swings would contradict the typical pattern and signal that this cycle may be different.
Third, corporate and macro catalysts. Any updates on unit growth, salvage volumes or pricing from management, even outside of a formal earnings date, could interact with the seasonal bias, especially if they land alongside new tariff or regulatory headlines that affect business services valuations.[1][3][6][9] In prior midterm years, negative surprises in these areas have tended to land during already fragile seasonal stretches.
Finally, insider and institutional behavior. The late-July stock sale by CEO Jeffrey Liaw was small in the context of overall insider ownership, but traders may still track whether insider selling accelerates or pauses as the window unfolds.[11] Continued institutional accumulation through filings like those from Rockland Trust and Epoch Investment Partners would argue that long-term holders are looking through any seasonal chop, while a slowdown in buying or a pickup in selling would align more closely with the historical short-favored pattern.[11][12]
Sources
- ChartMill – Copart (NASDAQ:CPRT) Q3 Earnings Beat Lifted by EPS and Revenue, Shares Still Dip (May 21, 2026)
- Seeking Alpha – Copart, Inc. (CPRT) Stock Forecast, Price Target, and Price Chart (Aug 8, 2026)
- Yahoo Finance – Copart, Inc. (CPRT) Stock Price, News, Quote & History (Aug 13, 2026)
- Yahoo Finance / Simply Wall St – How The Copart (CPRT) Narrative Is Shifting With Lower Price Targets And Earnings Concerns (May 5, 2026)
- Yahoo Finance – What To Expect From Copart’s (CPRT) Q1 Earnings (May 21, 2026)
- Yahoo Finance – Copart (CPRT) Q4 Earnings Report Preview: What To Look For (Feb 17, 2026)
- SEC – cprt-20250731 (Copart Form 10-K / Annual Report) (Sep 26, 2025)
- Zacks – Wall Street Analysts Think Copart (CPRT) Could Surge 36.79% (May 25, 2026)
- The Motley Fool – Copart (CPRT) Q2 2026 Earnings Transcript (May 21, 2026)
- ChartMill – Copart Inc (NASDAQ:CPRT) Passes the Peter Lynch Test for Long-Term GARP Investors (Jun 3, 2026)
- MarketBeat – Rockland Trust Co. Has $20.16 Million Stake in Copart, Inc. $CPRT (Aug 8, 2026)
- MarketBeat – Epoch Investment Partners Inc. Purchases 49,642 Shares of Copart, Inc. $CPRT (Jul 25, 2026)
About this seasonal analysis
Seasonal pattern data is sourced from TradeWave.ai, which analyzes historical price behavior across annual calendar windows going back up to 30 years. Read the full data methodology or the book The 100-Year Pattern by Afshin Moshrefi (2026 edition). Past performance of seasonal patterns does not guarantee future results. This article is for informational purposes only and does not constitute investment advice.