6 of 7 Midterm Aug 18-Oct 3 Windows Have Ended Lower for Copart (CPRT) Shares
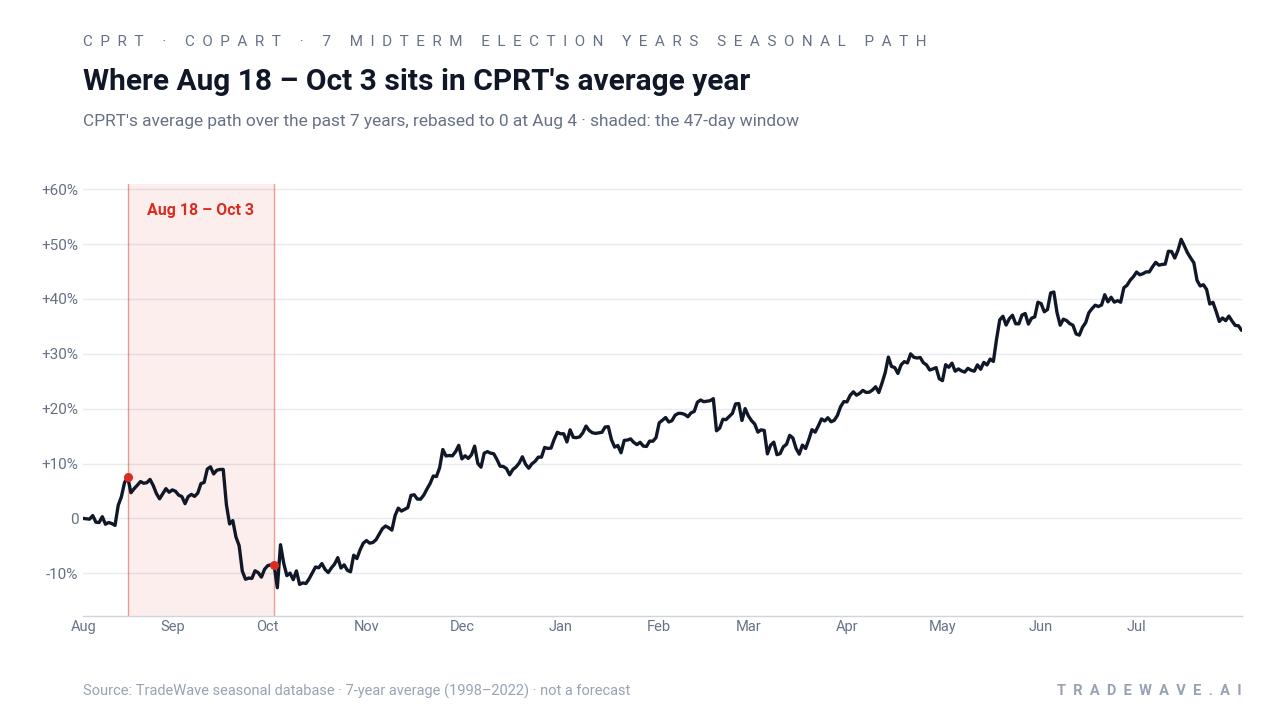
Copart is approaching an Aug 18–Oct 3 stretch that has usually meant downside for the stock, even as shares sit modestly higher for the year and fundamentals lean supportive.
Price as of Jul 24, 2026: $27.94 (last close).

What is the seasonal pattern for Copart (CPRT)?
Copart has fallen in 6 of 7 years during the Aug 18–Oct 3 midterm-year window, with an average gain of 11.61% in winning years for the short side.
- 6 for 7 in this window for shorts, with Copart closing lower in six of the last seven midterm election years.
- Seasonal window runs from Aug 18 through Oct 3, spanning 47 calendar days in the midterm election year.
- Percent Profitable is 86%, with 6 winners and 1 loser for the short trade across the sample.
- Avg Profit in winning years is 11.61%, while Avg Profit - All, including the lone losing year, is still a solid 10%.
- Maximum adverse moves have reached nearly 35% in some years, showing that drawdowns against the short can be sharp even when the window finishes lower.
- TradeWave Ratio of 1.51 and a Sharpe ratio of 1.33 point to a historically efficient short window, but with meaningful volatility inside the range.
According to historical data from TradeWave.ai, this late-summer stretch for Copart behaves differently from a typical month on the calendar, especially in midterm election years.
How has Copart (CPRT) traded in the upcoming Aug 18–Oct 3 window?
Copart has closed lower in six of the last seven midterm election years during the Aug 18–Oct 3 window, making this one of the stock’s more reliable short-friendly stretches on the calendar. Shares finished the prior session at 27.94, up 2.7% on the day and roughly 1.7% higher year to date, leaving the stock just above its 52-week low of 26.81 and well below the 50.11 high. That mix of a modest bounce off the lows and a historically weak late-summer window gives traders a clean contrast between current price action and the election-cycle seasonal backdrop.
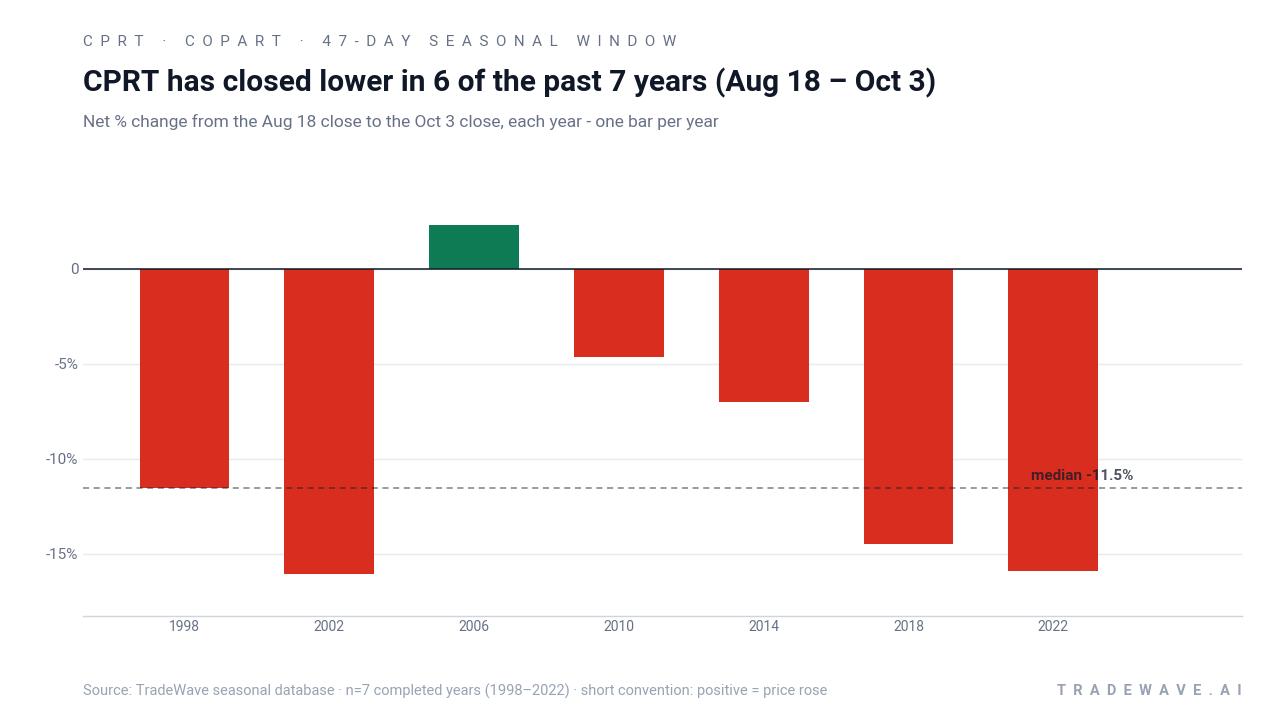
Because this pattern is grouped by presidential election cycle, it only looks at the last seven midterm election years for Copart rather than every single calendar year. That matters in 2026, which is itself a midterm election year in this framework, with the market transitioning toward the historically stronger pre-election year once this window ends.
The trade direction for this setup is short, and the numbers line up with that bias. Percent Profitable sits at 86%, with six winning short years against just one losing year, and the all-years average outcome is a 10% gain for the short side over the 47-day stretch. In the winning years, the average profit for shorts is 11.61%, which is sizable for a stock that typically trades with lower day-to-day volatility.
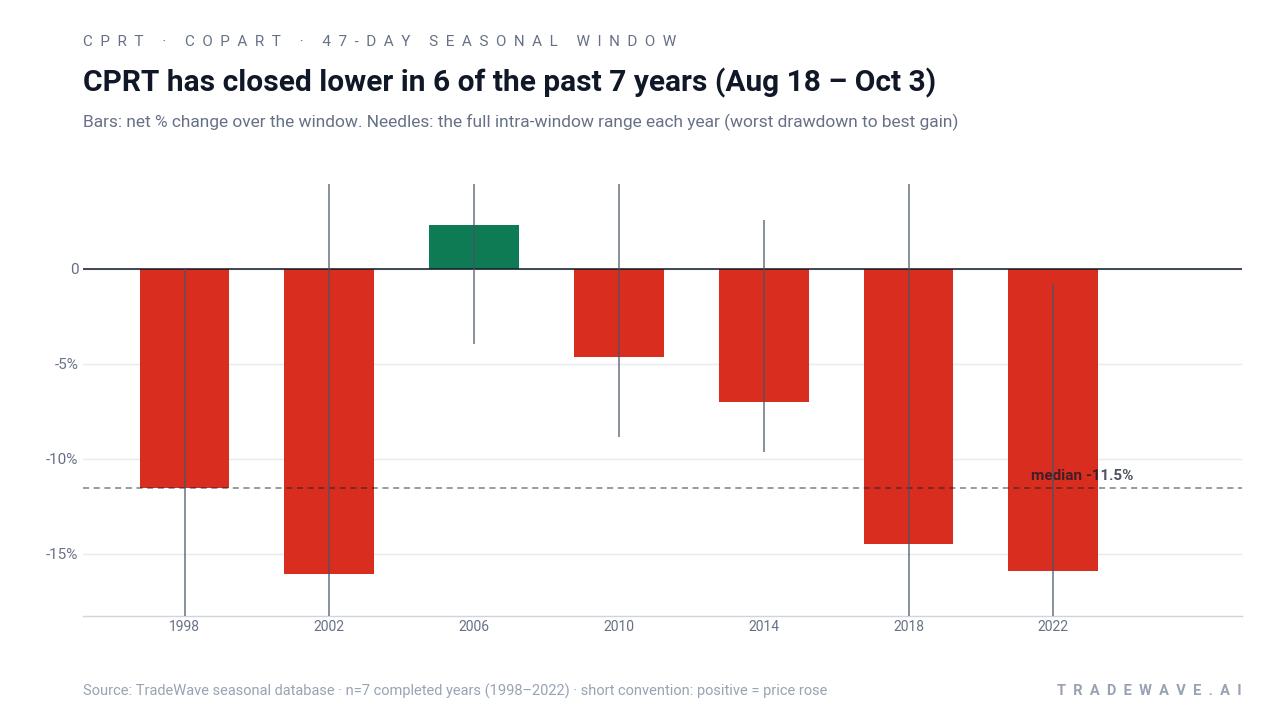
The lone losing year in the sample still matters for risk management. In 2006, Copart finished the window up 2.27%, which translated into a loss for the short even though the maximum adverse move against the position was only 3.98% at its worst point. By contrast, some of the best short years, such as 2002 and 2022, saw net declines of 16.05% and 15.92% respectively, but they also featured deep intraperiod swings, with worst drawdowns from entry of 32.1% and 19.82% before the trade moved back in the short’s favor.
That MAE and MFE profile is what makes this window stand out. Maximum favorable excursions for shorts have been large, but maximum adverse excursions have also been meaningful, including a nearly 34.62% move against the short in 1998 before the stock ultimately finished the window lower. In plain English, the pattern has rewarded patience for traders positioned with the seasonal trend, but it has not been a smooth ride.
The next chart stacks net results with both best and worst intraperiod swings to show how far Copart has tended to travel inside this window.
The cumulative view is just as striking. Compounding the results of this 47-day short window across the seven midterm election years in the sample adds up to an 88% cumulative gain for the strategy. Add it up: a trader who only showed up for this specific late-summer stretch in those years, and sat out the rest of the calendar, would have built a meaningful return profile from this one slice of Copart’s seasonal trend.
History does not guarantee future results; adverse excursions can be large even in winning windows, and Copart has shown it can move sharply against the seasonal pattern before ultimately aligning with it.
Why does Copart (CPRT) follow this seasonal pattern?
One likely driver is the way insurers and salvage yards manage inventory and pricing into the heart of hurricane season, when total-loss claims and vehicle flows can spike or stall in clusters.[1] Analysts have also pointed to institutional portfolio repositioning around the fiscal year for many property and casualty carriers, which can affect demand for auto-salvage exposure at the margin.[1] Layer in broader midterm election-year uncertainty for cyclicals, and this late-summer window may be catching a recurring mix of risk-off positioning and operational noise for Copart.
What is driving Copart (CPRT) today?
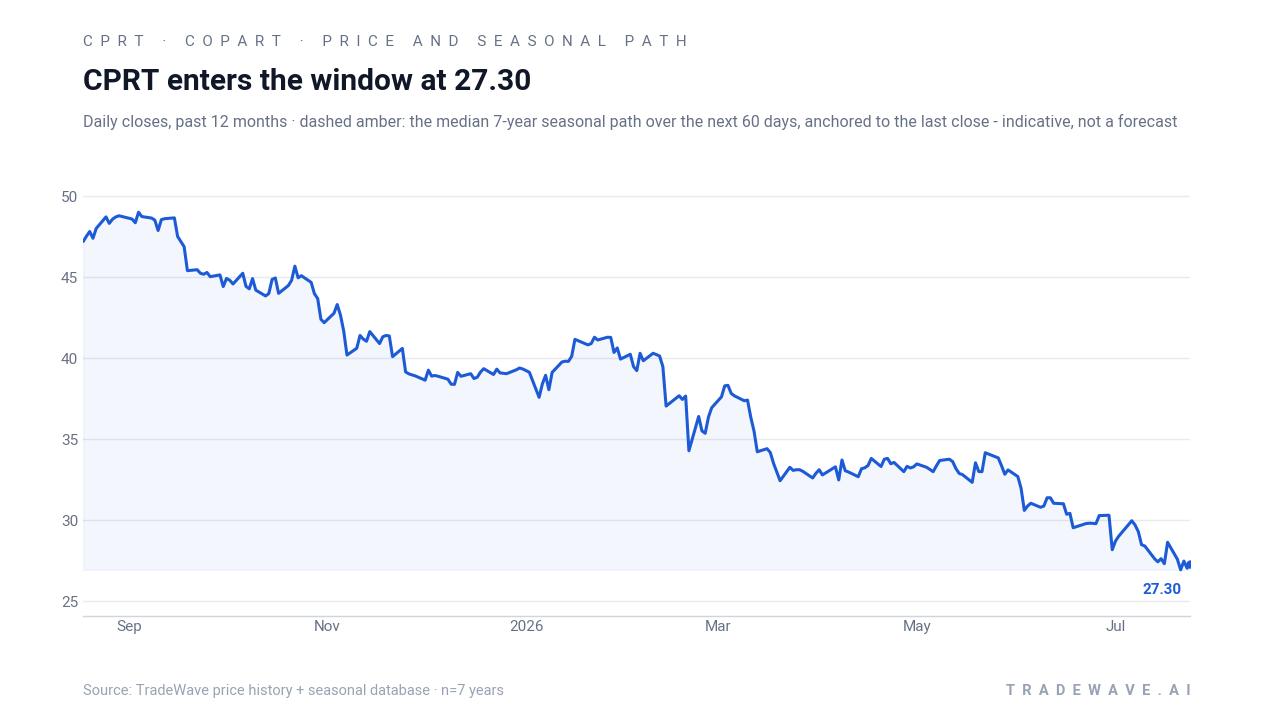
Copart ended the prior session at 27.94, flat on the day after an earlier 2.7% intraday gain, leaving the stock about 1.7% higher year to date and trading just above its 52-week low of 26.81 on volume slightly below its 20-day average of roughly 13.3 million shares. The company’s near-term fundamentals are a mix of modest top-line growth and strong margin support: Q1 FY26 revenue grew 0.7% as fewer catastrophic events and some insurance pullbacks weighed on volumes, but average selling prices for salvage vehicles climbed 8% year over year and the VB3 online platform continued to drive efficiency gains.[1] Rising total loss frequency, which reached 22.6% for the first nine months of 2025, is also keeping a steady stream of damaged vehicles flowing into Copart’s auctions, supporting inventory depth even as macro conditions shift.[1]
The chart below situates the latest move in its recent multi-month context alongside the historical seasonal projection.
What should traders watch as the Aug 18 window approaches?
First, the calendar: this 47-day window opens on Aug 18, so any sharp rally into that date would leave Copart starting the historically weak stretch from a higher perch, which has often amplified the size of prior short-side gains. Second, price levels matter; traders will be watching whether the stock can reclaim and hold above its 50-day moving average near 30.25 ahead of the window, or whether it stalls closer to the 27–29 band that has defined recent trading. Third, fundamentals and policy: updates on total loss frequency, salvage pricing, and any regulatory shifts affecting insurers could either reinforce or blunt the typical midterm-year pattern for the auto-salvage sector.[1] Finally, behavior inside the window will be the real test of this historical seasonality; if Copart grinds lower with intermittent sharp countertrend rallies, it would rhyme with the last seven midterm cycles, while a sustained breakout through prior resistance would mark a clear departure from the established pattern.
Sources
About this seasonal analysis
Seasonal pattern data is sourced from TradeWave.ai, which analyzes historical price behavior across annual calendar windows going back up to 30 years. Read the full data methodology or the book The 100-Year Pattern by Afshin Moshrefi (2026 edition). Past performance of seasonal patterns does not guarantee future results. This article is for informational purposes only and does not constitute investment advice.