J.M. Smucker Company (The) (SJM) Has Dropped 10 of 10 Years in This 29-Day Late-August Window
J.M. Smucker Company (The) is trading just below a 52-week high ahead of a 29-day seasonal window that has delivered lower finishes in every year of the past decade, setting up a sharp contrast with its strong year-to-date rally.
Price as of Aug 12, 2026: $118.79 (last close).

What is the seasonal pattern for J.M. Smucker Company (The) (SJM)?
J.M. Smucker Company (The) has fallen in 10 of 10 years during the Aug 18 to Sep 15 window, with an average 5.98% gain for short positions in winning years.
- 10 for 10 in this window, with short trades averaging 5.98% profit across the past decade.
- The late‑August to mid‑September SJM seasonal pattern has been consistently bearish for the stock price, favoring a short trade direction.
- Percent Profitable is 100%, with 10 winners and 0 losers for the short setup over the last 10 years.
- Average winner profit of 5.98% comes with a 4.3% standard deviation and a Sharpe ratio of 1.32 for the window.
- The TradeWave Ratio of 2.14 signals that price has typically traveled meaningfully in the trade direction within this 29‑day stretch.
- Maximum adverse moves inside the window have still been sizable in some years, underscoring that even a strong seasonal edge carries drawdown risk.
According to historical data from TradeWave.ai, this late‑August stretch has behaved very differently from an average month for SJM, and the next iteration is only days away.
How has J.M. Smucker Company (The) (SJM) traded in the Aug 18 to Sep 15 window?
J.M. Smucker Company (The) has finished lower in this Aug 18 to Sep 15 window in 10 of the past 10 years, with short positions averaging a 5.98% profit and no losing years. Shares closed Thursday at 118.79, up 1.2% on the day and about 6.9% below their 52-week high of 127.65, after a strong 21.9% year-to-date run that has outpaced the broader consumer staples sector.[4] That combination of a decade-long bearish seasonal trend and a stock sitting near the upper end of its one-year range is what makes this upcoming 29-day SJM trading window stand out on the calendar.
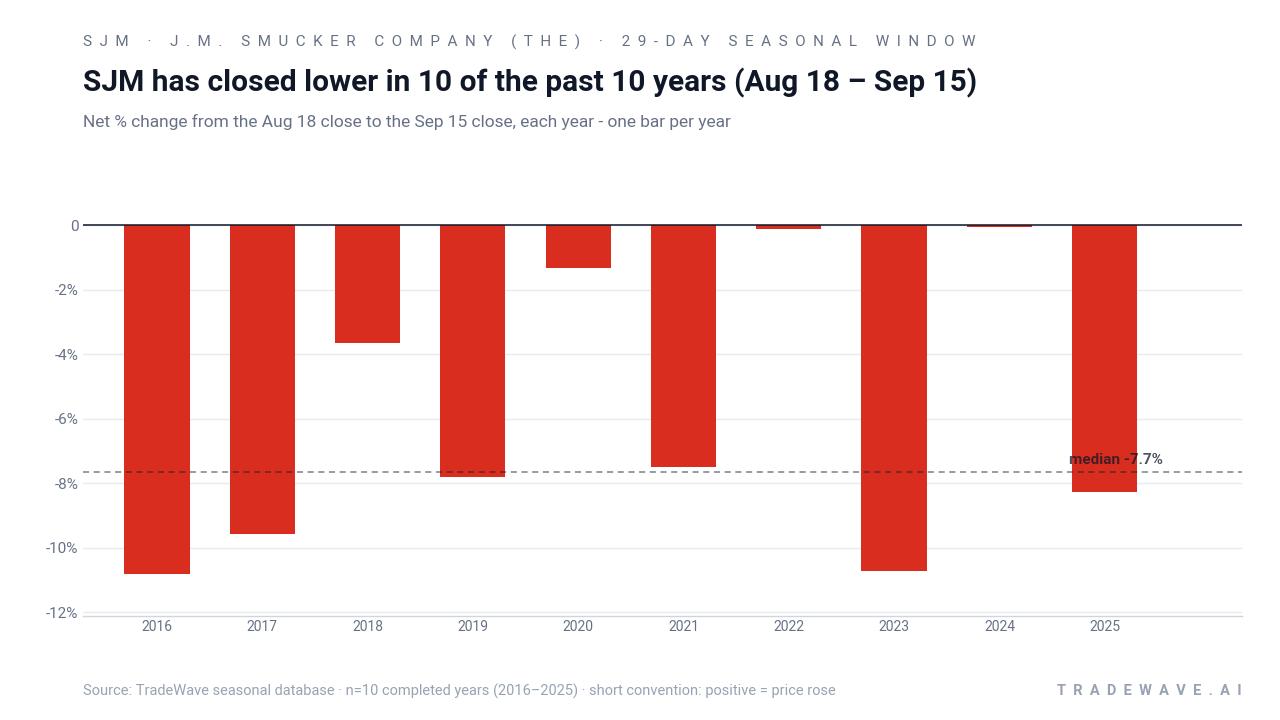
Historically, this SJM seasonal trend has been clean and one-sided. Percent Profitable sits at 100%, with 10 winners and 0 losers for the short trade direction, and the median profit for those short positions is 7.65%, slightly above the average, which hints at a few milder years but no outright failures. The annualized return of 5.9% and cumulative 77% gain for the strategy across the decade show how stacking this single 29-day window has added up over time.
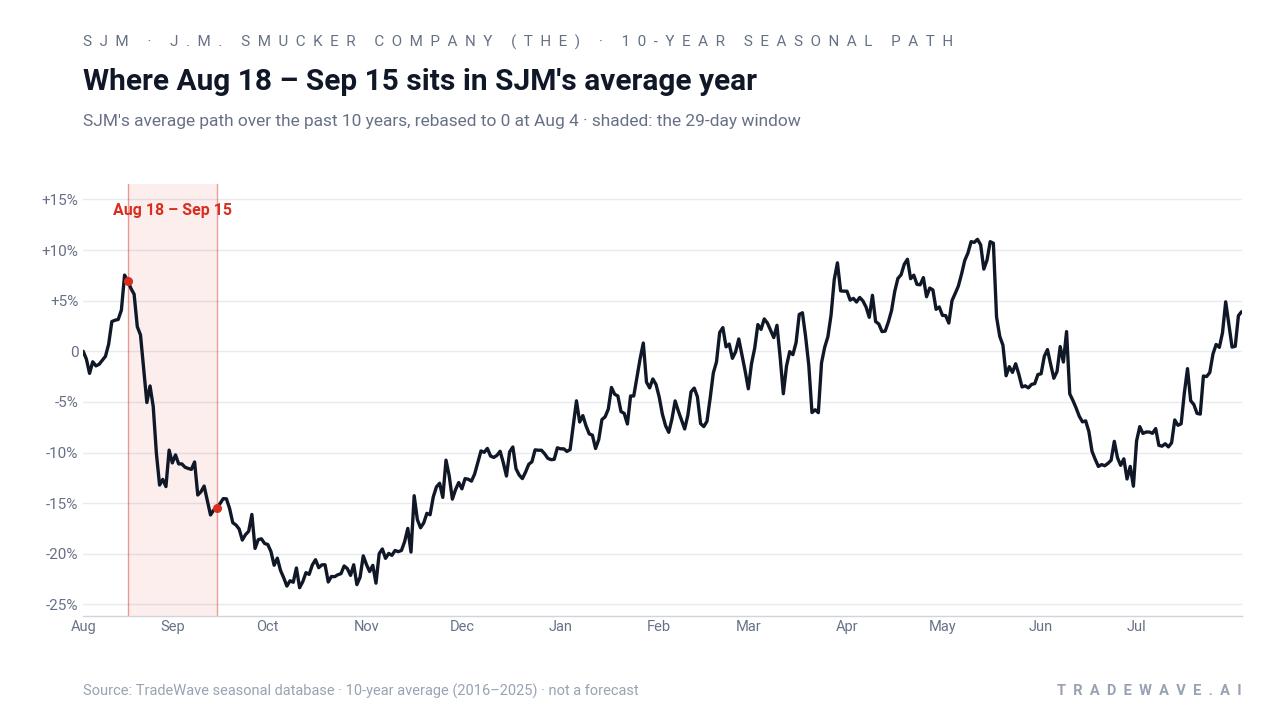
A second view that layers in both best and worst intraperiod swings shows how much room SJM has historically had to move inside this window.
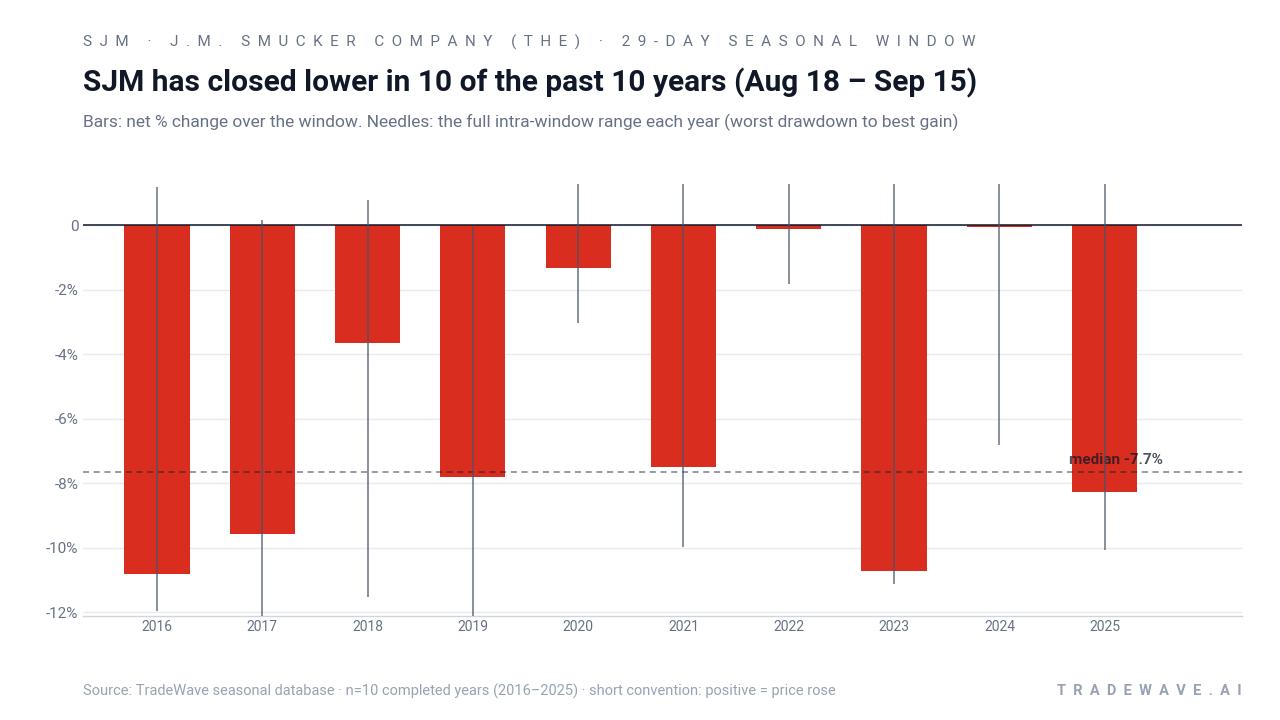
The per-year breakdown shows that some of the strongest years for the pattern, such as 2016 and 2023, saw net declines of 10.81% and 10.71% respectively, with worst intraperiod drawdowns from the entry of roughly 11% to 12% and only modest countertrend rallies. Softer years like 2020 and 2022 still ended slightly lower, but they featured maximum favorable moves against the short of 8.36% and 4.01%, reminding traders that SJM can squeeze higher before rolling over. The TradeWave Ratio of 2.14 captures that the stock has typically traveled a meaningful distance in the trade direction during the window, while the 4.3% standard deviation and 1.32 Sharpe ratio suggest the edge has been strong but not free of volatility.
The cumulative chart for this J.M. Smucker Company (The) trading window compounds those yearly results into a smooth downward staircase for the stock price, from the perspective of a short seller. There are no flat years in the series, only varying degrees of downside, which is unusual for a single 29-day slice of the calendar in a defensive consumer staples name. Add it up: a 77% cumulative gain for the short strategy across ten late‑August windows is a rare level of consistency for any individual stock pattern analysis.
History does not guarantee future results; adverse excursions within the window can still be large even in years that ultimately finish in line with the seasonal pattern.
Why does J.M. Smucker Company (The) (SJM) follow this seasonal pattern?
This SJM seasonal trend likely reflects a mix of portfolio repositioning and consumer staples sector rotation as investors move out of defensive names late in the summer and into higher-beta areas ahead of the fall. Another contributor may be the company’s fiscal calendar, with investors digesting guidance and resetting positions after the fiscal year-end earnings cycle. The pattern may also capture commodity and input-cost headlines that often surface around this time, which can pressure margins and sentiment for packaged food stocks.
What is driving J.M. Smucker Company (The) (SJM) today?
SJM closed at 118.79, up 1.24% on the day, leaving the stock about 6.9% below its 52-week high and up 21.9% year to date, a run that has handily beaten the Consumer Staples sector’s roughly 10.2% gain.[4] The move caps a strong stretch since fiscal fourth-quarter results in June, when J.M. Smucker Company (The) delivered adjusted EPS of 2.77 dollars versus 2.64 dollars expected and slightly topped revenue forecasts, with management saying it is entering fiscal 2027 with “meaningful momentum.”[2] In the same period, analysts highlighted that the company’s initial fiscal 2027 outlook centered on about 10 dollars in EPS at the midpoint, reinforcing the view that earnings growth can continue even as the stock re-rates higher.[2]
On the capital-returns side, SJM just declared a quarterly dividend of 1.12 dollars per share, underscoring its appeal to income-focused investors at a time when bond yields have been volatile.[12] Fresh filings also show institutional interest, with a recent MarketBeat summary noting that Bank of America Corp DE added more than 43,000 shares, even as insiders collectively sold 18,533 shares worth just over 2.1 million dollars in the last quarter, leaving insider ownership at 2.80%.[11] That mix of steady dividends, institutional buying and modest insider selling fits with a stock that has rallied but is not yet priced as a high-growth story.
Street views remain constructive but not euphoric. Yahoo Finance’s consensus framework characterizes SJM as a “Moderate Buy,” with an average price target of 123.18 dollars, only modestly above where the stock trades today, suggesting analysts see limited upside after the recent run rather than a deep value gap.[4] In June, UBS raised its target following the earnings beat, while earlier in May JPMorgan trimmed its target to 120 dollars from 130 dollars as it reset food group valuations and flagged slightly softer organic growth assumptions, a reminder that even solid staples names are not immune to multiple compression when the macro narrative shifts.[1][2]
Macro and category debates are also in play. In March 2026, commentary around SJM’s earnings reaction pointed to questions about how GLP‑1 weight-loss drugs might affect demand for indulgent snacks, including the Hostess portfolio, even though management has not quantified a direct hit to sales.[10] So far, SJM’s outperformance versus the Consumer Staples Select Sector SPDR ETF over the past three months, 9.6% versus 1.6%, suggests investors are giving the company credit for execution and synergy capture despite those concerns.[3] The seasonal window that begins on Aug 18 will test whether that confidence can withstand a period that has historically been a soft patch for the stock.
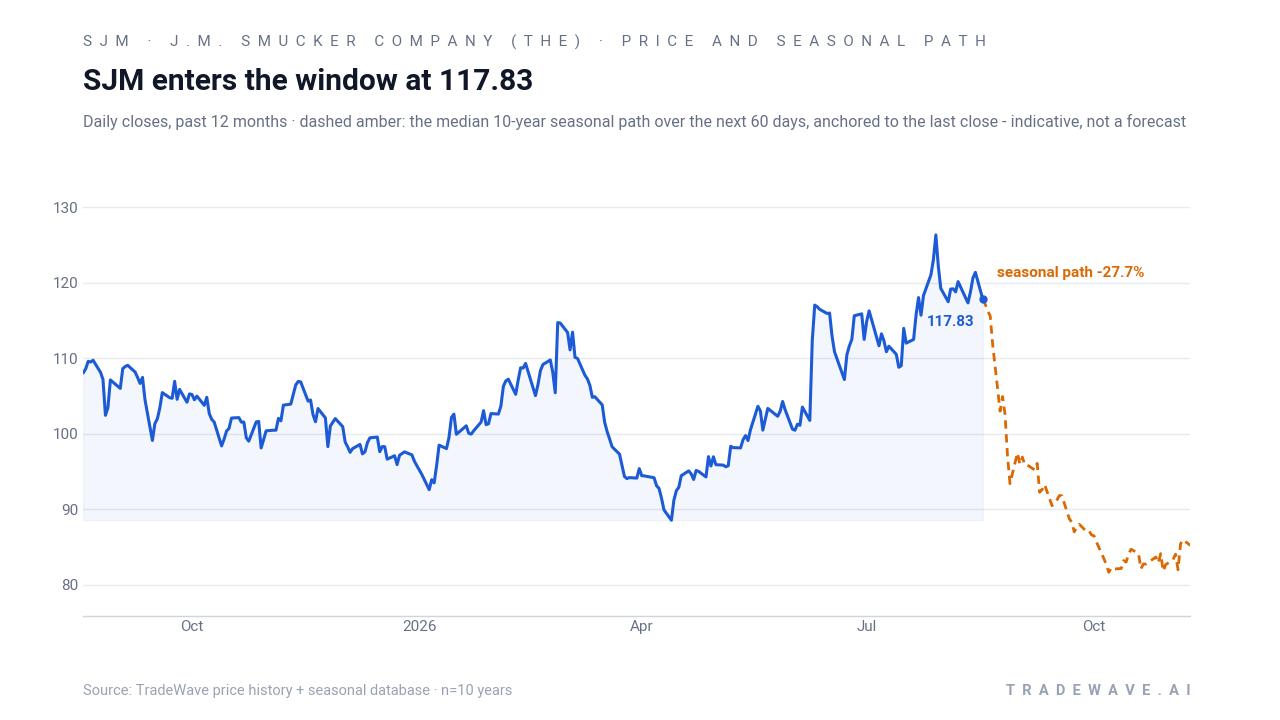
The chart below situates the latest move against SJM’s past year of trading and the median 10-year seasonal path.
What should traders watch in this SJM seasonal window?
For traders focused on the Aug 18 to Sep 15 J.M. Smucker Company (The) trading window, the first checkpoint is whether the stock respects or defies its 10-for-10 record of finishing lower over this stretch. A sustained break above the recent 52-week high near 127.65 during the window would mark a clear departure from the historical seasonality, while a slide back toward the 50-day moving average around 113.62 would be more in line with the past decade’s pattern. Volume and day-to-day volatility will matter too, given that prior years have seen sizable intraperiod swings even when the final outcome favored the short side.
Fundamentally, investors will be watching for any updates to the fiscal 2027 outlook, especially around the 10-dollar EPS target and the integration of recent acquisitions, as well as any fresh commentary on GLP‑1-related demand risks for snacks and sweets.[2][10] On the capital-returns front, confirmation that the 1.12-dollar quarterly dividend remains intact and that institutional interest stays firm would support the longer-term bull case even if the stock hits a seasonal air pocket.[11][12] The key tell for this window will be whether SJM’s strong year-to-date momentum can overpower a decade of late‑August weakness, or whether the historical seasonality reasserts itself once again.
Sources
- Yahoo Finance (Insider Monkey) – J.M. Smucker (SJM) Faces Lower Forward Estimates as JPMorgan Cuts Price Target (May 24, 2026)
- Yahoo Finance (Insider Monkey) – UBS Raises its Price Target on J. M. Smucker (SJM) (Jun 17, 2026)
- Yahoo Finance (Zacks) – Is The J. M. Smucker Co. (SJM) Stock Outpacing Its Consumer Staples Peers This Year? (Aug 7, 2026)
- MarketBeat – SJM Stock Jumps After Earnings Beat, Outlook Holds (Mar 3, 2026)
- MarketBeat – Bank of America Corp DE Buys 43,043 Shares of The J. M. Smucker Company $SJM (Aug 10, 2026)
- MarketBeat – The J. M. Smucker Company (NYSE:SJM) to Issue Quarterly Dividend of $1.12 (Aug 12, 2026)
- MarketBeat – SJM Stock: Dividend Yield, Debt Reduction, and a Bullish Outlook (Jun 9, 2026)
- MarketBeat – The J. M. Smucker Company (NYSE:SJM) Receives Average Recommendation of "Hold" from Analysts (Jul 31, 2026)
About this seasonal analysis
Seasonal pattern data is sourced from TradeWave.ai, which analyzes historical price behavior across annual calendar windows going back up to 30 years. Read the full data methodology or the book The 100-Year Pattern by Afshin Moshrefi (2026 edition). Past performance of seasonal patterns does not guarantee future results. This article is for informational purposes only and does not constitute investment advice.