Pending Kenvue Deal Weighs on Kimberly-Clark (KMB) Just as a Historically Weak 60-Day Stretch Opens
Kimberly-Clark is trading well below its 52-week high as it heads toward a late-August seasonal window that has often favored the bears.
Price as of Aug 12, 2026: $108.93 (last close).

What is the seasonal pattern for Kimberly-Clark (KMB)?
Kimberly-Clark has fallen in 8 of 10 years during the Aug 23 to Oct 21 window, with an average 7.02% gain in winning years for the short side.
- 8 for 10 in this window, with the short side averaging 7.02% gains in winning years across the past decade.
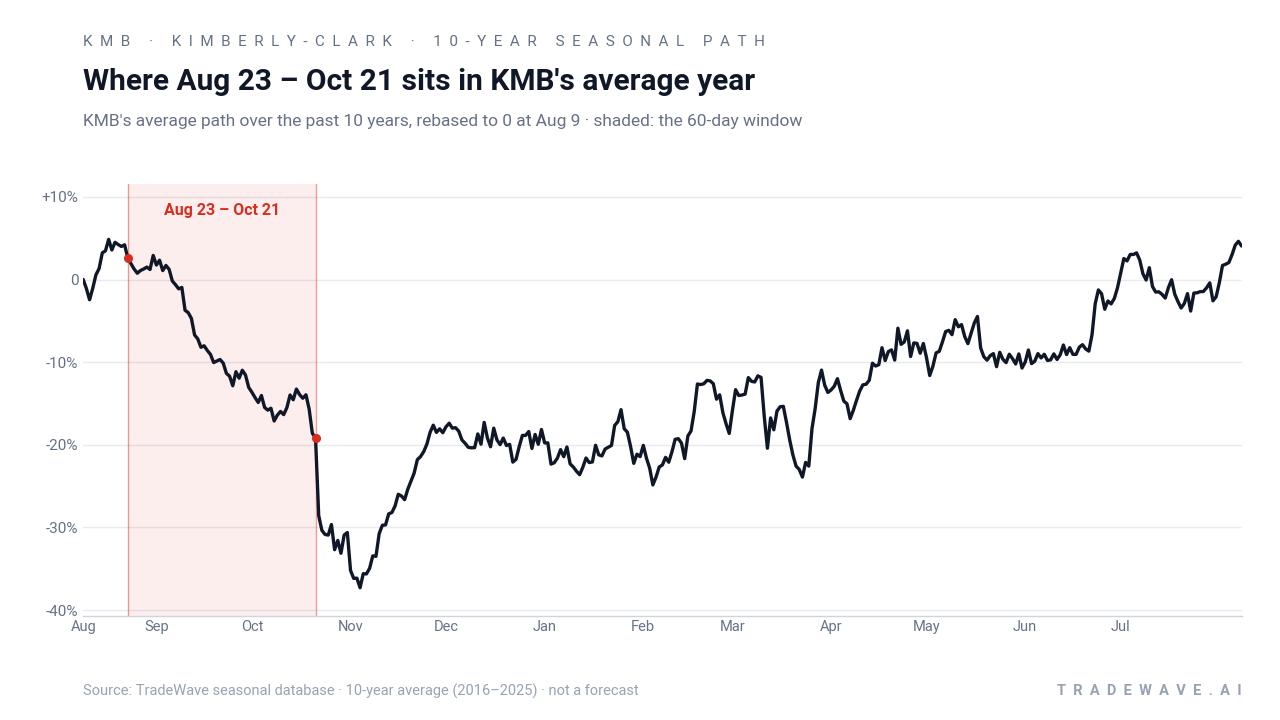
- The 60-day window runs from Aug 23 to Oct 21 and has been a historically weak late-summer stretch for KMB.
- Percent Profitable is 80%, with 8 winning short years and 2 losing ones in the 10-year sample.
- Average profit across all years, including losers, is 5%, showing the down years have outweighed the up years.
- Maximum favorable and adverse moves inside the window have both been sizable, pointing to meaningful volatility around this pattern.
- The TradeWave Ratio of 1.96 and a Sharpe ratio of 1.04 signal a historically efficient short window rather than a random drift.
According to historical data from TradeWave.ai, this late-August stretch has behaved very differently from an average month on the calendar for Kimberly-Clark, and the next iteration is about to open again.
How has Kimberly-Clark (KMB) traded in the late-August seasonal window?
Kimberly-Clark has closed lower in 8 of the past 10 years during the Aug 23 to Oct 21 window, with the short side posting an average 7.02% gain in winning years. Shares finished Thursday at 108.93, up 0.3% on the day and about 12.1% below the stock’s 52-week high of 123.93, even after an 11.57% gain year to date. That combination of a soft late-summer stock pattern and a still-recovering price base turns this upcoming 60-day stretch into a tactical test of whether the recent rebound can withstand a historically weak part of the calendar.
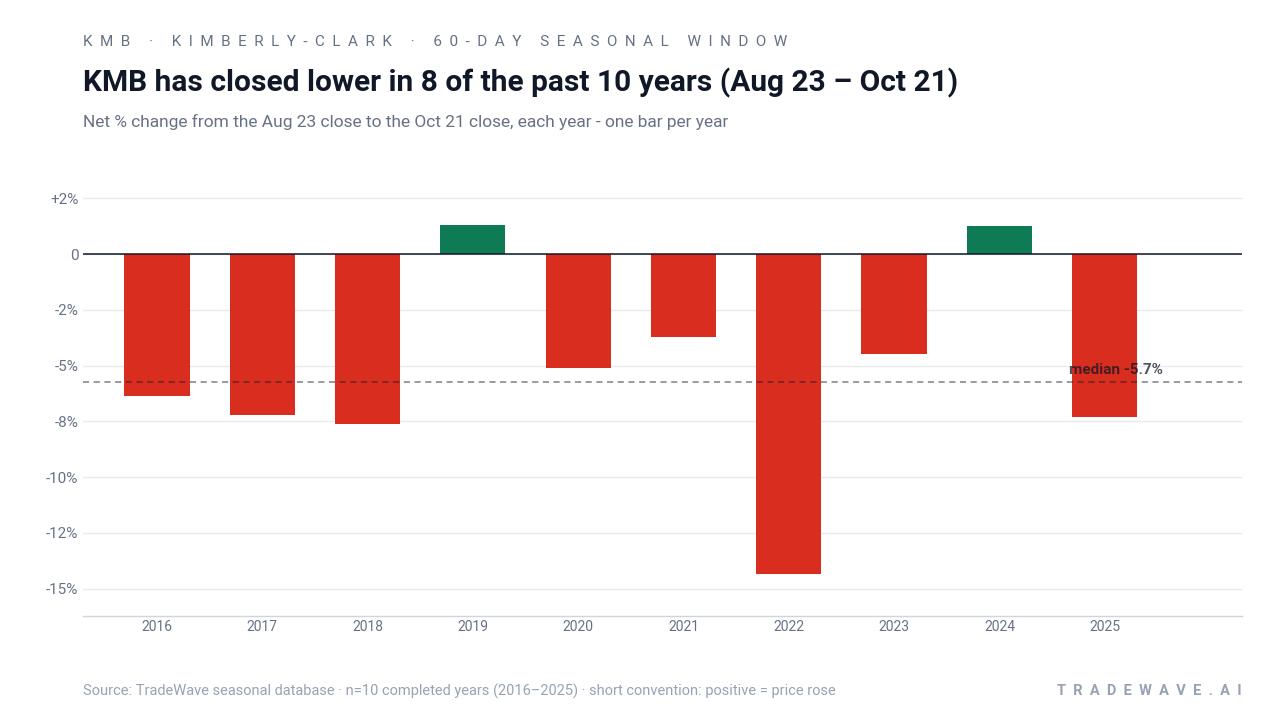
Historically, this has been a clean short-biased window rather than a coin flip. Percent Profitable sits at 80%, with 8 winning short years and just 2 losing ones, and the all-years average outcome is a 5% gain for the short side. The median profit of 5.74% lines up with that story, suggesting the typical year has delivered a mid-single-digit decline from late August into late October rather than a rare outlier doing all the work.
The per-year breakdown shows how consistent that pattern has been. In 2016, 2017 and 2018, KMB fell between 6.38% and 7.63% over the window, giving shorts a steady run of mid-single-digit wins. The standout year for the pattern was 2022, when the stock dropped 14.33% between Aug 23 and Oct 21, while the weakest year for shorts was 2019, which finished up 1.29% as the stock squeezed higher into the close of the window.
The maximum favorable move and maximum adverse move inside the window underline the risk-reward profile. In strong years for the pattern, the best intraperiod move in favor of the short has often been deep, with 2022 showing a worst drawdown from entry of 18.25% for longs, which is the same as a 18.25% favorable excursion for shorts. In softer years like 2019 and 2024, the stock still swung several percentage points both ways, with favorable moves for shorts of 4.43% and 4.14% at best, but also adverse moves against the trade of 6.64% and 2.71% respectively.
A second view combines net results with the full intraperiod range to show how far KMB has swung inside this window.
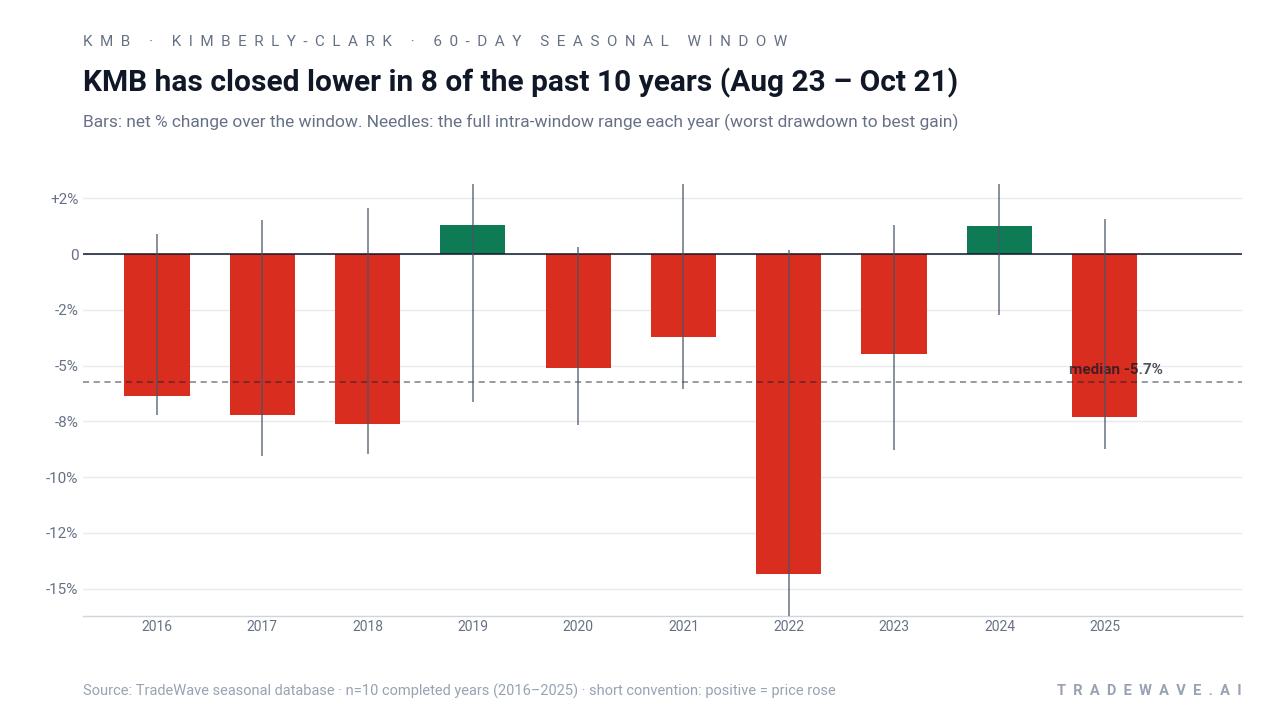
History does not guarantee future results; adverse excursions (MAE) can be large even in winning windows.
Put together, the pattern is clear: this late-August to late-October window has favored shorts in 8 of 10 years, with mid-single to low-double-digit declines not uncommon when the weakness shows up.
Why does Kimberly-Clark (KMB) follow this seasonal pattern?
One likely driver is the way consumer-staples stocks trade around the back-to-school and early holiday reset, when retailers and investors reassess demand for everyday products. Analysts have also pointed to portfolio repositioning in the Consumer Defensive sector in early autumn, as managers rotate toward or away from bond-like dividend names depending on the interest-rate backdrop.[1] For a mature, dividend-heavy stock like Kimberly-Clark, that combination of demand checks and asset-allocation shifts may help explain why late summer has so often been a soft spot on the calendar.
What is driving Kimberly-Clark (KMB) today?
Kimberly-Clark shares closed Thursday at 108.93, up 0.3% on the session, leaving the stock about 12.1% below its 52-week high of 123.93 and up 11.57% so far in 2026.[1] That puts the tissue and personal-care maker ahead of many defensive peers this year, even as it continues to trade at a discount to its prior highs.
The latest leg of the move has been shaped by mixed second-quarter results on Aug 4. Revenue came in at $4.19 billion, slightly below the roughly $4.22 billion analysts were looking for, but adjusted earnings of $2.12 per share topped expectations of about $2.01 as margins held up better than feared.[5] Management highlighted flat organic revenue, an operating margin near 15.1% and a free cash flow margin around 13.3%, framing the quarter as evidence that its transformation program is cushioning inflation and input-cost pressure.[6]
On the corporate side, coverage has flagged a pending acquisition of Kenvue as an overhang, with some investors wary of integration risk and balance-sheet leverage if the deal proceeds.[1] At the same time, the stock’s income profile remains a draw: Kimberly-Clark has declared a quarterly dividend of $1.28 per share, or $5.12 annualized, with an ex-dividend date of Sep 4, 2026, implying a yield in the mid-4% range at current prices.[3] That payout has helped keep the name in the mix for income-focused funds even as growth investors look elsewhere.
Institutional flows have been quietly supportive. Recent filings show firms such as Royal Fund Management, Kentucky Retirement Systems and Janus Henderson adding to positions in late July and early August, a sign that some long-only managers are leaning into the combination of yield and relative value.[10][12][13] Those allocations have arrived against a macro backdrop where inflation remains a headwind but also reinforces the appeal of steady cash generators in the Consumer Defensive sector.[1][4]
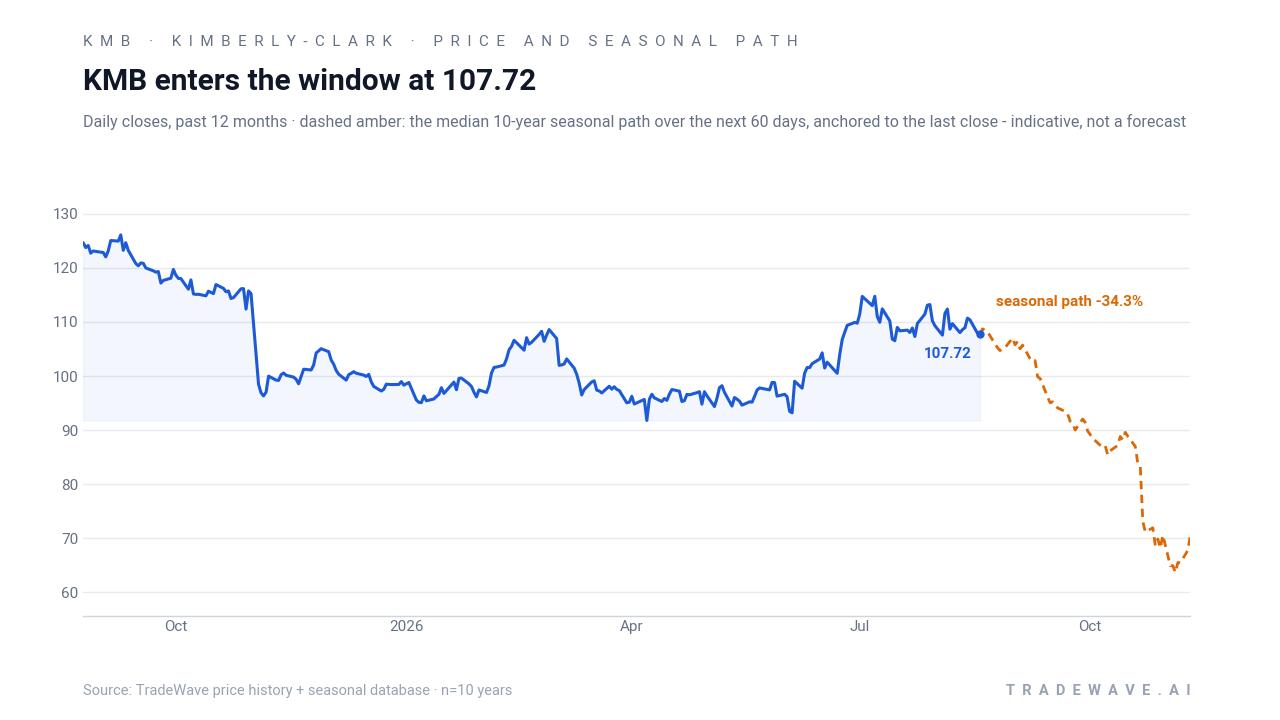
The chart below situates the latest move in its recent multi-month context alongside the historical seasonal path.
What should traders watch in this late-summer window for KMB?
First, the calendar. The 60-day seasonal window opens on Aug 23 and runs through Oct 21, a period that has historically leaned bearish for Kimberly-Clark. If the stock starts to roll over into that stretch, especially after failing to retake the low-120s area that capped rallies earlier in the year, it would line up with the established KMB seasonal trend.
Second, earnings and guidance. The next scheduled earnings report is on Nov 3, just after this window closes, so any pre-announcements on pricing, volumes or cost inflation would land squarely inside the historically weak period.[5][6] Traders will be watching whether management’s transformation narrative and margin resilience can keep defensive buyers engaged if the broader Consumer Defensive sector wobbles.
Third, levels and volatility. On the downside, prior support in the high-90s to low-100s has been a key battleground; a decisive break below that zone during the window would echo some of the deeper historical drawdowns. On the upside, a sustained push back toward the 52-week high near 123.93 during a window that has usually favored shorts would be a clear sign that this year is breaking the pattern.
Finally, institutional positioning. Recent buying from pension funds and asset managers has helped underpin the stock, and follow-through or reversal in those flows will matter if volatility picks up.[10][12][13] If long-only demand stays firm even as the seasonal window opens, it could blunt the typical late-summer weakness; if those buyers step back, the historical pattern suggests the path of least resistance has often been lower.
Sources
- Yahoo Finance: Kimberly-Clark Corporation (KMB) Stock Price, News, Quote & History (Aug 12, 2026).
- Yahoo Finance (Canada): Kimberly-Clark Corporation (KMB) Stock Price, News, Quote & History (Aug 12, 2026).
- Yahoo Finance (UK): Kimberly-Clark Corporation (KMB) stock price, news, quote and history (Aug 12, 2026).
- Yahoo Finance article: What Are Wall Street Analysts' Target Price for Kimberly-Clark Stock? (Feb 11, 2026).
- Yahoo Finance / StockStory: Kimberly-Clark (NASDAQ:KMB) Reports Sales Below Analyst Estimates In Q2 CY2026 Earnings (Aug 6, 2026).
- MarketBeat: Kimberly-Clark Q2 Earnings Call Highlights (Aug 9, 2026).
- MarketBeat: Royal Fund Management LLC Boosts Holdings in Kimberly-Clark Corporation $KMB (Jul 30, 2026).
- MarketBeat: Kentucky Retirement Systems Purchases 10,646 Shares of Kimberly-Clark Corporation $KMB (Jul 31, 2026).
- MarketBeat: Janus Henderson Group PLC Acquires 32,891 Shares of Kimberly-Clark Corporation $KMB (Aug 7, 2026).
About this seasonal analysis
Seasonal pattern data is sourced from TradeWave.ai, which analyzes historical price behavior across annual calendar windows going back up to 30 years. Read the full data methodology or the book The 100-Year Pattern by Afshin Moshrefi (2026 edition). Past performance of seasonal patterns does not guarantee future results. This article is for informational purposes only and does not constitute investment advice.