Merck & Co. (MRK) Has Rallied in 15 of 15 Midterm Fall Windows, Averaging 13.24% Gains
Merck & Co. is pressing fresh highs ahead of an Aug 22 seasonal window that has delivered gains in every midterm election year in the dataset, just as investors weigh patent risk and insider selling.
Price as of Aug 13, 2026: $135.55 (last close).

What is the seasonal pattern for Merck & Co. (MRK)?
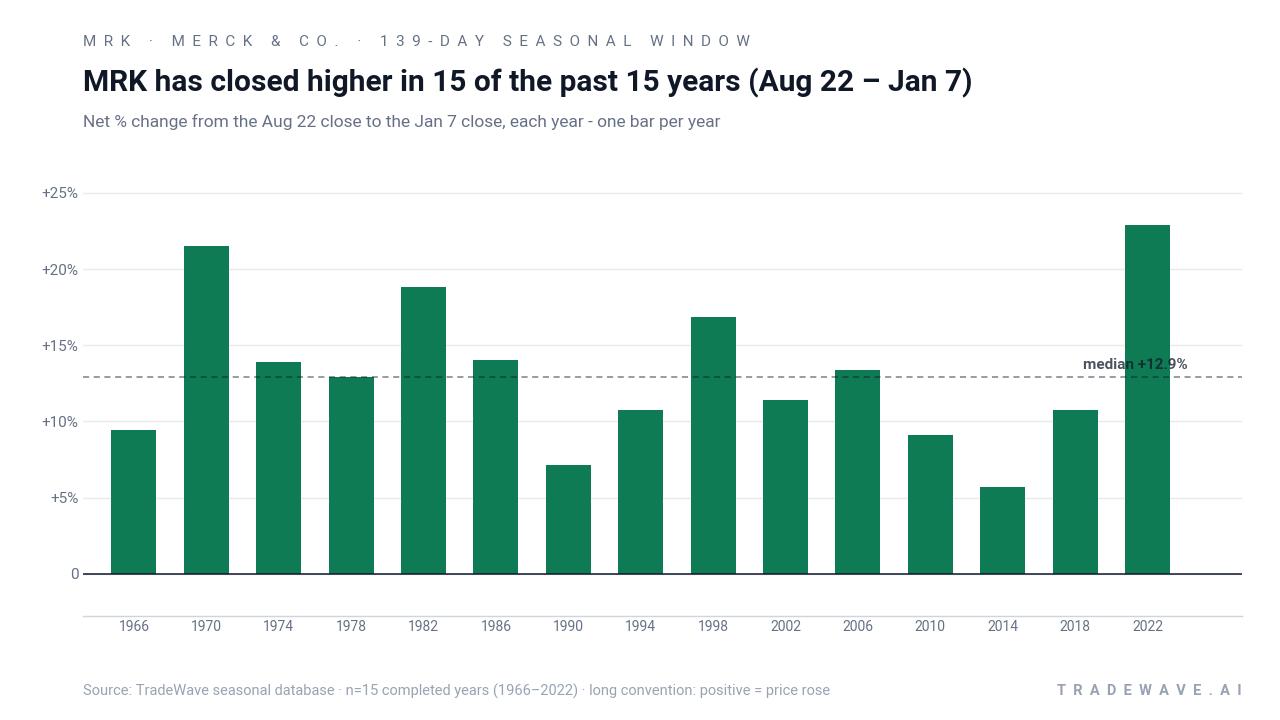
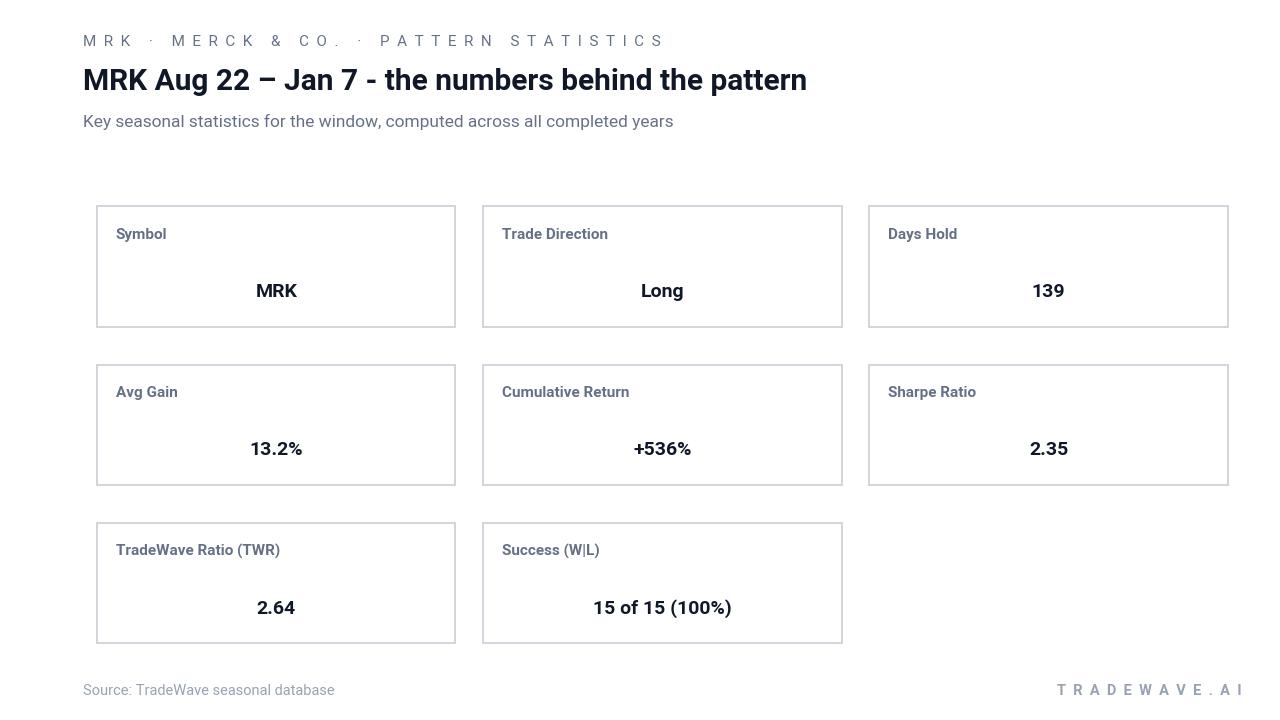
Merck & Co. has risen in 15 of 15 midterm-election-year Aug 22–Jan 7 windows, with an average gain of 13.24% in winning years.
- 15 for 15 in this window, averaging 13.24% gains in winning years across the last 15 midterm election years.
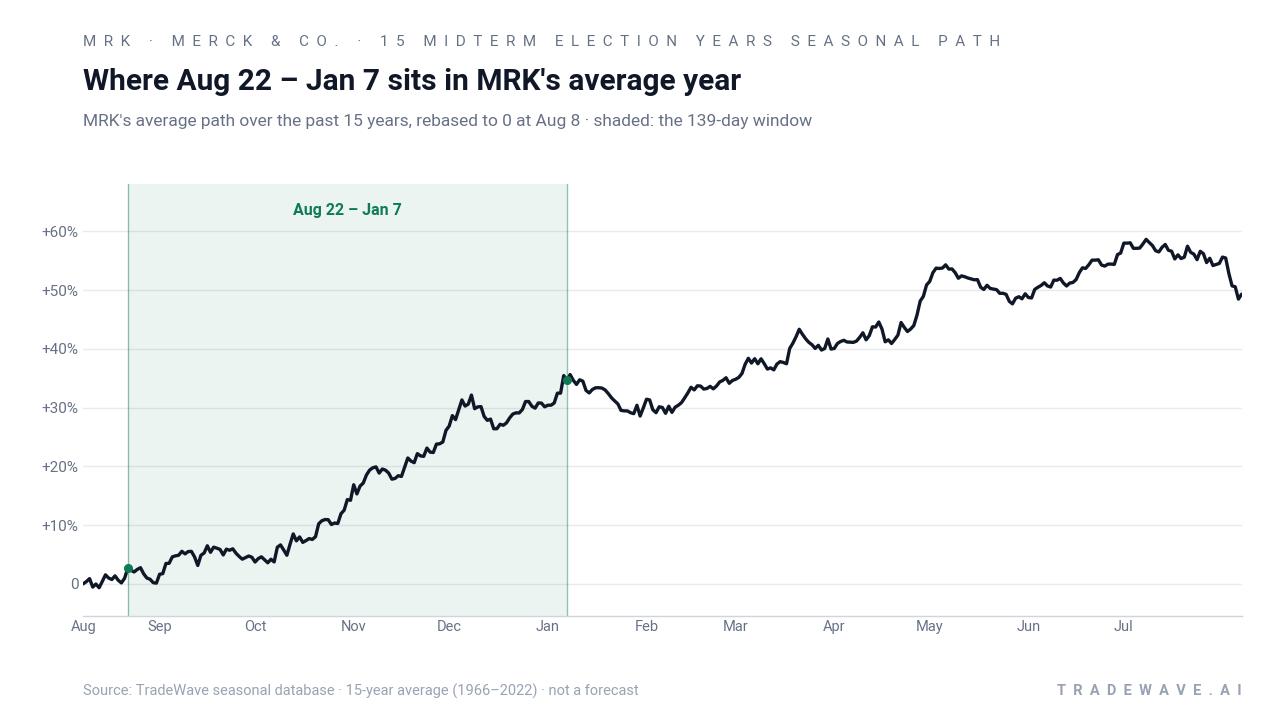
- Seasonal window runs from Aug 22 through Jan 7, spanning 139 calendar days in the heart of the midterm election year.
- Percent Profitable is 100%, with 15 winners and 0 losers for the long trade direction in this MRK seasonal trend.
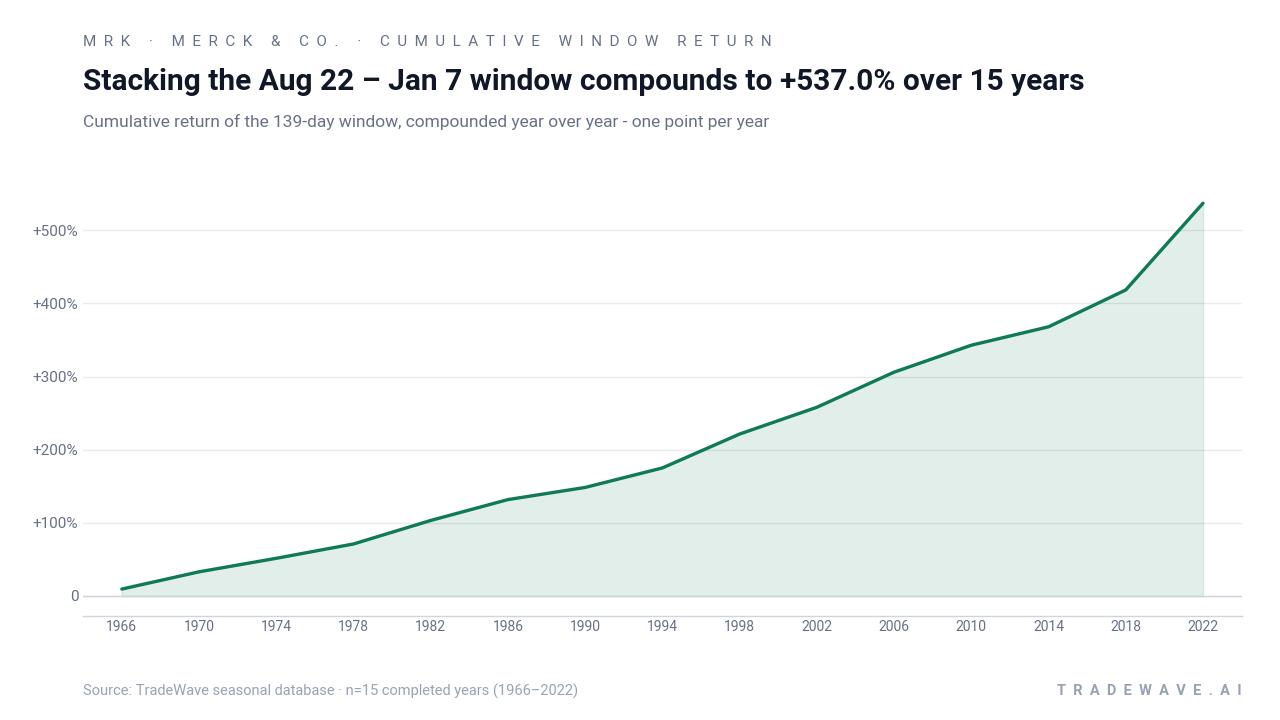
- Median profit clocks in at 12.93%, with a cumulative return of 536% when stacking the window across all 15 years.
- TradeWave Ratio (TWR) of 2.64 and a Sharpe ratio of 2.35 point to strong upside moves relative to volatility in this Merck & Co. trading window.
- Intraperiod swings have still been meaningful, with individual years showing double-digit drawdowns even as the window finished higher.
According to historical data from TradeWave.ai, this midterm-year stretch for Merck & Co. has behaved very differently from an average autumn in the stock.
How strong is Merck & Co. (MRK) in the upcoming Aug 22 seasonal window?
Merck & Co. has posted gains in every single Aug 22 to Jan 7 window across the last 15 midterm election years, averaging a 13.24% rise for the long trade. Shares finished Friday at 135.55, up 1.98% on the day and essentially flat to their 52-week high of 135.68, leaving the stock about 0.1% below its peak while sitting 17.8% higher year to date. Insider filings this week showed Executive Vice President Richard R. Deluca selling roughly 45,000 shares between Aug 6 and Aug 12, a modest headwind for sentiment as the stock grinds into record territory.[9]
Because this pattern is grouped by the presidential election cycle, it only looks at midterm election years, when policy uncertainty, drug-pricing rhetoric and budget debates often reshape the healthcare sector’s risk premium. The current calendar is in the midterm election year, and this 139-day window bridges into the year before the presidential election, a phase that has historically seen investors rotate back into large, defensive growth names like big pharma as visibility on policy and earnings improves.
Across the 15 completed midterm-year windows, the long trade direction has been unambiguously favorable. Percent Profitable sits at 100%, with 15 winners and no losing years, and the median gain of 12.93% is close to the 13.24% average, which suggests the outcome has been consistently positive rather than skewed by a single outlier. The annualized return of 13.14% and a Sharpe ratio of 2.35 indicate that, on a risk-adjusted basis, this has been one of the cleaner seasonal stretches in Merck’s historical seasonality profile.
Looking at individual years, the strongest midterm-year window in the sample was 2022, when MRK gained 22.87% between late August and early January, with a best intraperiod run-up of 28.56% before a modest pullback.[1] On the softer side, 2014 still finished higher by 5.68%, but the stock endured a 10.64% drawdown at one point during the window, a reminder that even “all green” patterns can involve uncomfortable volatility along the way.[1]
A per-year view of net returns and intraperiod swings shows how upside and drawdowns have coexisted in this window.
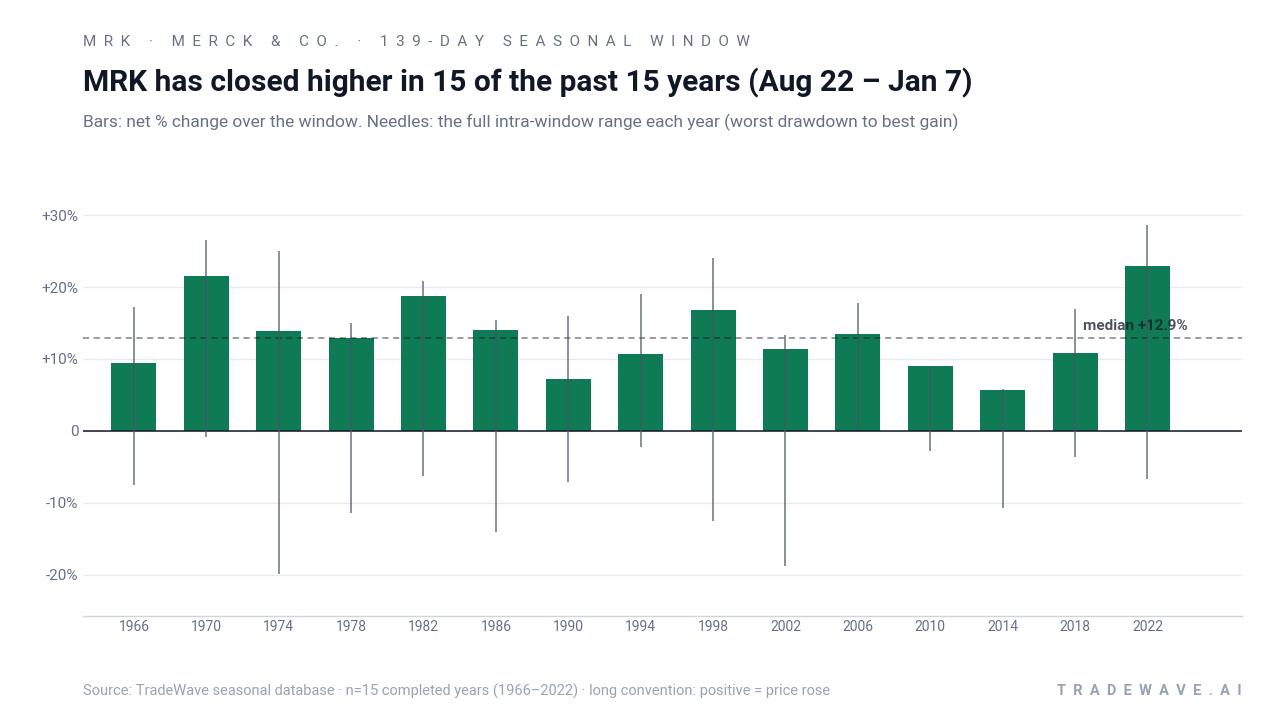
The maximum favorable move in strong years has often been several percentage points above the final gain, which means traders who timed entries and exits inside the window could have seen even larger swings than the closing stats suggest. At the same time, maximum adverse moves have reached into the low double digits in several years, underscoring that the path to those positive finishes has not been a straight line. Add it up: 15 for 15 with a 536% compounded return across these midterm-year windows is a rare combination of consistency and magnitude for a single stock pattern analysis.
History does not guarantee future results; adverse excursions can be large even in winning windows, and MAE shows that MRK has occasionally dropped sharply before recovering during this stretch.
Why does Merck & Co. (MRK) follow this seasonal pattern?
One likely driver is the way Merck’s earnings calendar and guidance updates cluster around late October, which often land inside this Aug 22–Jan 7 window and can reset expectations for the coming year.[2] Analysts have also pointed to institutional portfolio repositioning in the back half of the midterm election year, when investors often rotate toward defensive growth and healthcare ahead of the typically stronger year before the presidential election.[1] For a mega-cap pharmaceutical name with a dominant oncology franchise, that combination of earnings visibility and sector rotation may help explain why this specific slice of the calendar has repeatedly favored the long side.
What is driving Merck & Co. (MRK) today?
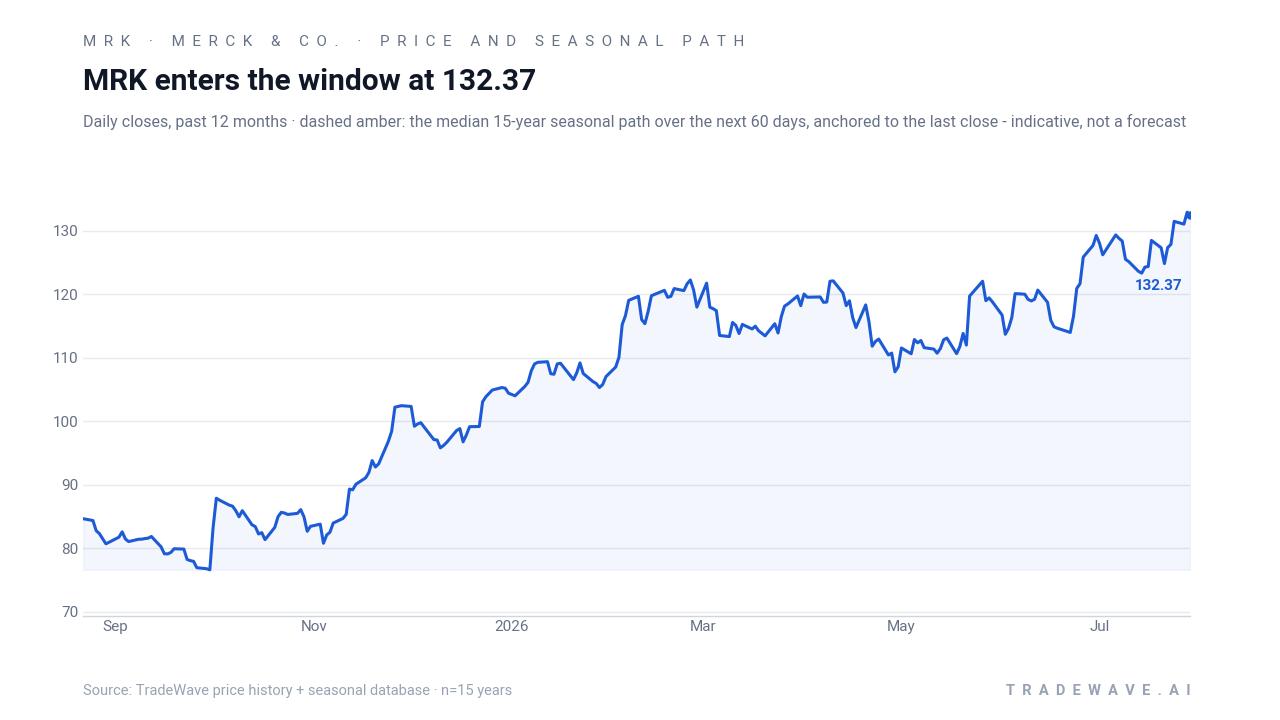
MRK closed at 135.55 on Friday, up 2.63 points or 1.98% on the session, and sits about 0.1% below its 52-week high of 135.68 while holding a 17.8% gain for 2026 so far. The move extends a run that has already outpaced the broader healthcare sector, with Barchart data showing Merck outperforming the XLV health-care ETF over three-month, 52-week and year-to-date periods.[1][12] The stock is trading well above its 50-day moving average of roughly 124.79 on solid liquidity, with 20-day average volume around 8.5 million shares.
Fundamentally, the latest leg higher followed stronger-than-expected Q2 2026 results on Aug 4, when Merck reported $16.61 billion in revenue versus $16.27 billion expected and a smaller-than-feared loss of $0.13 per share, helped by 5% growth in Keytruda sales to $8.37 billion.[1][5] Morningstar notes that management narrowed and slightly raised 2026 revenue guidance to a range of $66.3 billion to $67.3 billion, reinforcing the view that Merck can manage through looming patent expirations while funding its pipeline.[5] Short interest remains low at about 1.19% of float, suggesting limited outright bearish positioning even as some valuation concerns surface after the rally.[4]
On the positioning side, MarketBeat filings show fresh institutional buying alongside insider selling, with EVP Richard R. Deluca’s roughly $6.7 million in stock sales between Aug 6 and Aug 12 standing out against broader portfolio adjustments.[9] Analysts tracked by Barchart and ChartMill still lean “Moderate Buy,” and the blended consensus price target of about 135.65 sits almost exactly on top of the current quote, reflecting a market that sees Merck as fairly valued after its run rather than obviously cheap or stretched.[1][2] Against that backdrop, the upcoming MRK seasonal trend window adds a distinct layer to the healthcare sector seasonal outlook as traders weigh whether historical seasonality can keep working from record levels.
The chart below shows MRK’s 12-month climb alongside a median 60-day seasonal projection into the new window.
What should traders watch as this Merck & Co. (MRK) window opens?
First, the calendar: the 139-day window begins on Aug 22 and runs through Jan 7, covering Merck’s Oct 29 Q3 earnings release and the heart of the U.S. policy calendar as the midterm election year gives way to the year before the presidential election.[2] Historically, this has been a period when MRK’s returns have accelerated rather than faded, but the pattern has included double-digit intraperiod drawdowns, so how the stock behaves around earnings and any drug-pricing headlines will be key tells.
Second, levels matter. With MRK essentially at its 52-week high and well above its 50-day moving average, traders will be watching whether the stock can hold the low-130s on any pullback during the window or whether a deeper dip closer to the moving average appears, similar to the 2014 and 2002 patterns that saw sizable drawdowns before finishing higher.[1] A firm base above recent breakout levels would be more in line with the smoother years in the historical seasonality, while a sharp break and slow recovery would echo the choppier episodes captured in the MAE needles.
Third, the insider and institutional flow backdrop bears monitoring. If insider selling like Deluca’s continues while institutional filings tilt more heavily toward net buying, it would reinforce the idea that large funds are using any weakness inside the window to add exposure despite executive diversification.[9] A reversal in that pattern, with insiders stepping up sales and institutions pulling back, would cut against the historical bias and could make any seasonal softness more persistent.
Finally, the macro and policy narrative around Keytruda and Merck’s pipeline will sit in the background of every move. Morningstar estimates that Keytruda accounted for roughly 49% of 2025 sales, and its 2028 patent cliff remains a central risk factor even as management leans on new indications and acquisitions to diversify revenue.[4][5] If the stock can navigate that overhang while respecting the historical Aug 22–Jan 7 pattern, it would add one more data point to a midterm-year seasonal record that is already 15 for 15.
Sources
- Barchart – Merck & Co’s Stock: Analyst Estimates & Ratings (Aug 6, 2026)
- ChartMill – MRK Forecast, Price Target & Analyst Ratings (Aug 4, 2026)
- Barchart – Merck & Co. Stock Outlook: Is Wall Street Bullish or Bearish? (Jan 30, 2026)
- Seeking Alpha – Merck's Post-Keytruda Playbook Is Working, But Valuation Has Caught Up (Jul 2, 2026)
- Morningstar – Merck & Co Inc MRK - Company Report (Aug 10, 2026)
- MarketBeat – Merck & Co., Inc. $MRK Shares Bought by Moody Lynn Lieberson & Walker LLC (Aug 13, 2026)
- Seasonal Market News – Seasonal Methodology Overview (2026)
- Afshin Moshrefi – The 100-Year Pattern (2026 edition)
- TradeWave.ai – MRK Aug 22–Jan 7 Midterm-Year Seasonal Pattern (accessed Aug 14, 2026)
- Seasonal Market News – MRK Aug 22–Jan 7 Seasonal Stats Graphic (2026)
- Seasonal Market News – MRK Aug 22–Jan 7 Cumulative Return Graphic (2026)
- Seasonal Market News – MRK Aug 22–Jan 7 Bars/MAE/MFE Graphic (2026)
About this seasonal analysis
Seasonal pattern data is sourced from TradeWave.ai, which analyzes historical price behavior across annual calendar windows going back up to 30 years. Read the full data methodology or the book The 100-Year Pattern by Afshin Moshrefi (2026 edition). Past performance of seasonal patterns does not guarantee future results. This article is for informational purposes only and does not constitute investment advice.