This 283-Day Midterm Window Has Delivered 10 Straight Rallies for Merck & Co. (MRK)
Merck & Co. is nearing a historically powerful midterm-election seasonal window just as shares trade close to their 52-week high and investors weigh guidance, deal-making and looming patent pressure.
Price as of Jul 16, 2026: $127.63 (last close).

What is the seasonal pattern for Merck & Co. (MRK)?
Merck & Co. has risen in 10 of 10 midterm-election-year windows starting around Aug 6 and lasting 283 trading days, with an average gain of 28.15% in winning years.
- 10 for 10 in this window, with Merck & Co. averaging 28.15% gains in winning years across the last 10 midterm election cycles.
- Seasonal window begins Aug 6, 2026 and runs for 283 trading days, spanning the late midterm year into the pre-election year.
- Percent Profitable is 100%, with 10 winners and 0 losers in the historical sample for this MRK seasonal trend.
- Trade Direction is long, supported by a Sharpe ratio of 1.97 that reflects strong risk-adjusted returns in this Merck & Co. trading window.
- The TradeWave Ratio of 2.2 suggests price has typically traveled meaningfully in the trade direction within the window, even before final outcomes are booked.
- Intraperiod swings have included double-digit drawdowns in some years, so the historical seasonality has combined strong upside with real volatility.
According to historical data from TradeWave.ai, this is not just another calendar stretch for MRK but a recurring election-cycle regime that has behaved differently from an average year.
How strong is the upcoming seasonal window for Merck & Co. (MRK)?
Merck & Co. has posted gains in every one of the last 10 midterm-election-year windows that start in early August and run roughly nine months, averaging 28.15% returns for longs. Shares finished Friday at $127.63, up 3.3% on the day and about 2.0% below their 52-week high of $130.29, leaving the stock near the top of its recent range. That combination of a clean 10-for-10 historical record and a price sitting just under the highs makes this next window hard for traders to ignore.
The presidential election cycle matters here because this pattern is built only from midterm election years, a phase that often brings policy uncertainty, shifting healthcare priorities and portfolio repositioning ahead of the pre-election year. Pattern phase equals “midterm election year,” and the calendar is also in a midterm election year, with this window bridging into the historically more risk-on pre-election period. That makes this stretch a kind of handoff between two distinct political and liquidity regimes for large-cap pharma.
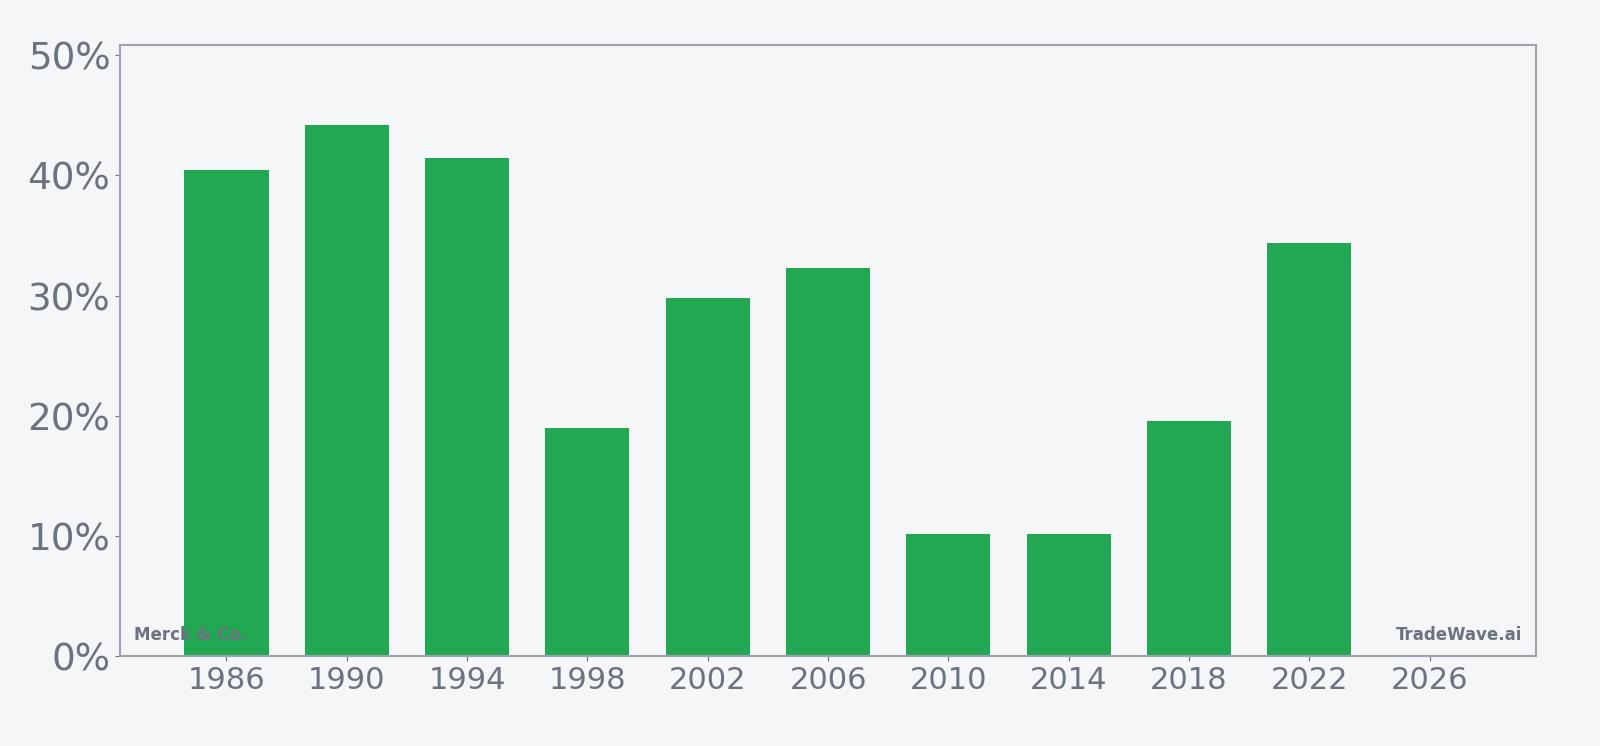
Historically, this 283-day MRK seasonal pattern has been a straightforward long setup. Percent Profitable is 100%, with 10 winners and 0 losers, and the average profit of 28.15% lines up closely with the 28% all-years average because there have been no down years in the sample. The median outcome of 31.02% shows that the typical midterm-year run has been closer to low-30s gains than to the lower double-digit years that pull the average down.
The per-year table shows how broad-based that strength has been. The weakest outcome was still a 10.17% gain in 2010, while the strongest years, such as 1990 and 1986, delivered net returns of 44.22% and 40.45% respectively. In 2022, the most recent midterm year in the sample, MRK logged a 34.37% gain across this same window, with an entry price around $78.44 and an exit near $105.40, underscoring how the pattern has persisted into the modern oncology-driven era.
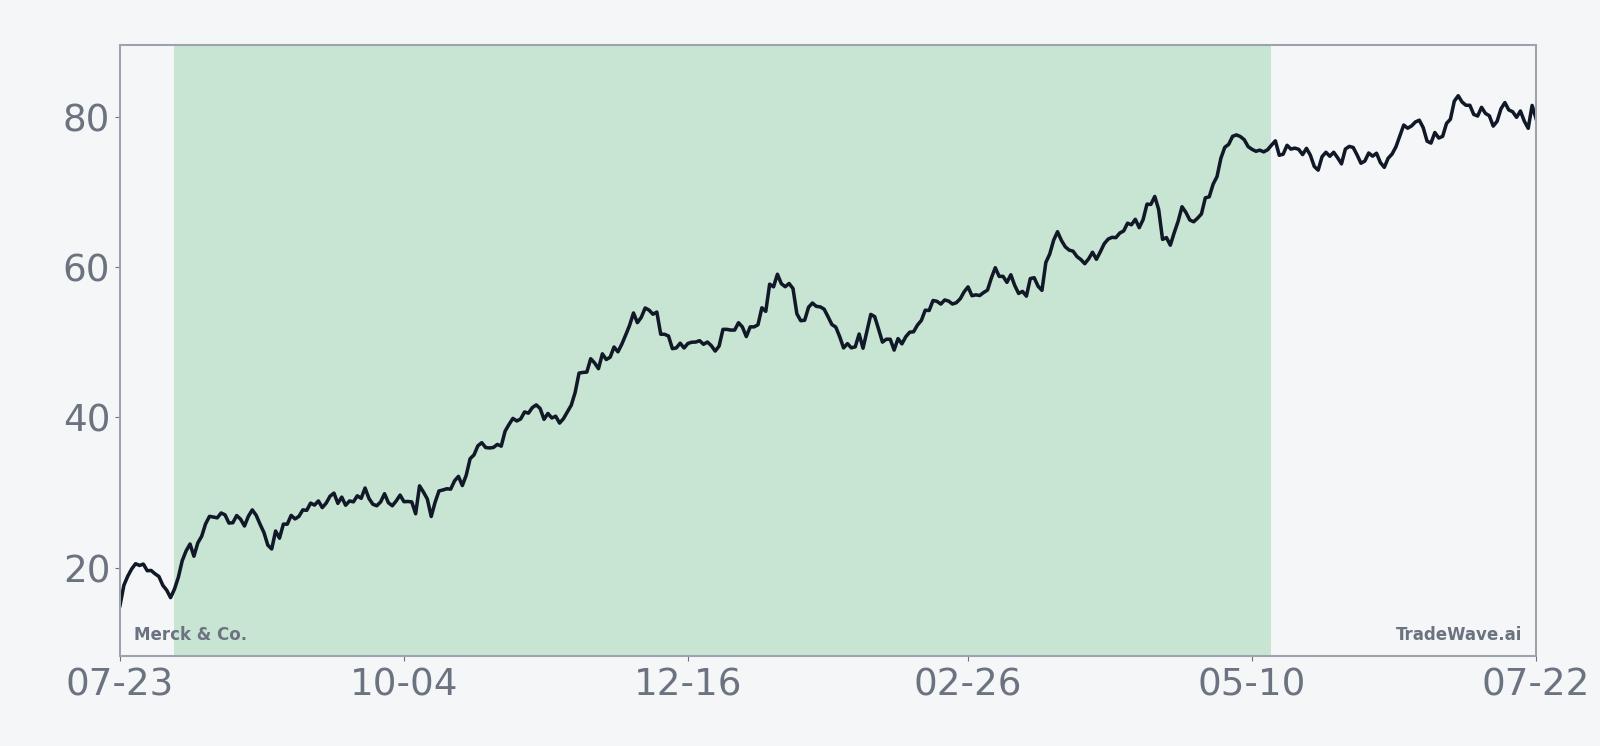
The historical seasonal average trend for this MRK trading window slopes higher in a relatively steady fashion, with gains accruing across much of the period rather than clustering in a single month. That fits with the long 283-day span, which runs from late summer of the midterm year through much of the following pre-election year, a stretch when risk appetite for defensives and healthcare has often improved as policy clarity increases.
Year-by-year bars highlight how consistently MRK has delivered sizable upside in this window, even when intraperiod swings were sharp.
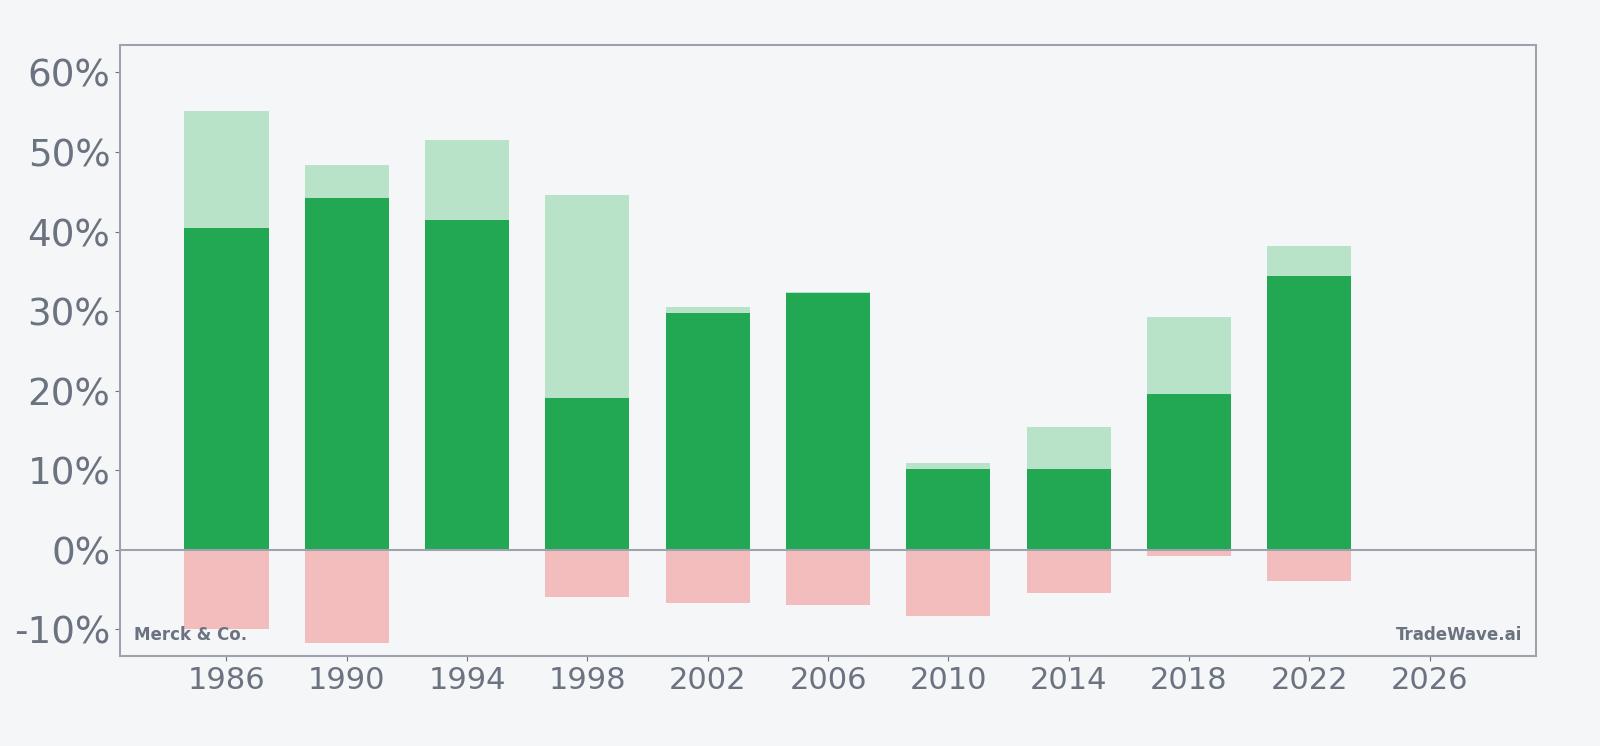
The bars with maximum favorable and maximum adverse excursions show why this pattern has appealed to trend followers but still demands risk control. In strong years like 1986 and 1990, MRK’s best intraperiod rallies reached 55.2% and 48.39% from the entry, while the worst drawdowns were still close to or above negative 10%. Even in quieter years such as 2010 and 2014, the stock saw adverse moves of around negative 8.26% and negative 5.47% before finishing higher, which means traders sitting through the window had to tolerate meaningful volatility on the way to positive outcomes.
History does not guarantee future results; adverse excursions (MAE) can be large even in winning windows.
Why does Merck & Co. (MRK) follow this seasonal pattern?
One likely driver is the way the earnings calendar and policy cycle line up for big pharma in midterm and pre-election years. Merck often delivers key oncology data and guidance updates in the back half of the year, and institutional investors tend to reposition into defensive growth names like MRK as election-related uncertainty peaks and then fades. This pattern may also reflect sector rotation, with healthcare drawing inflows when macro growth looks less certain but long-term drug pipelines, such as Keytruda and follow-on assets, remain intact.
What is driving Merck & Co. (MRK) today?
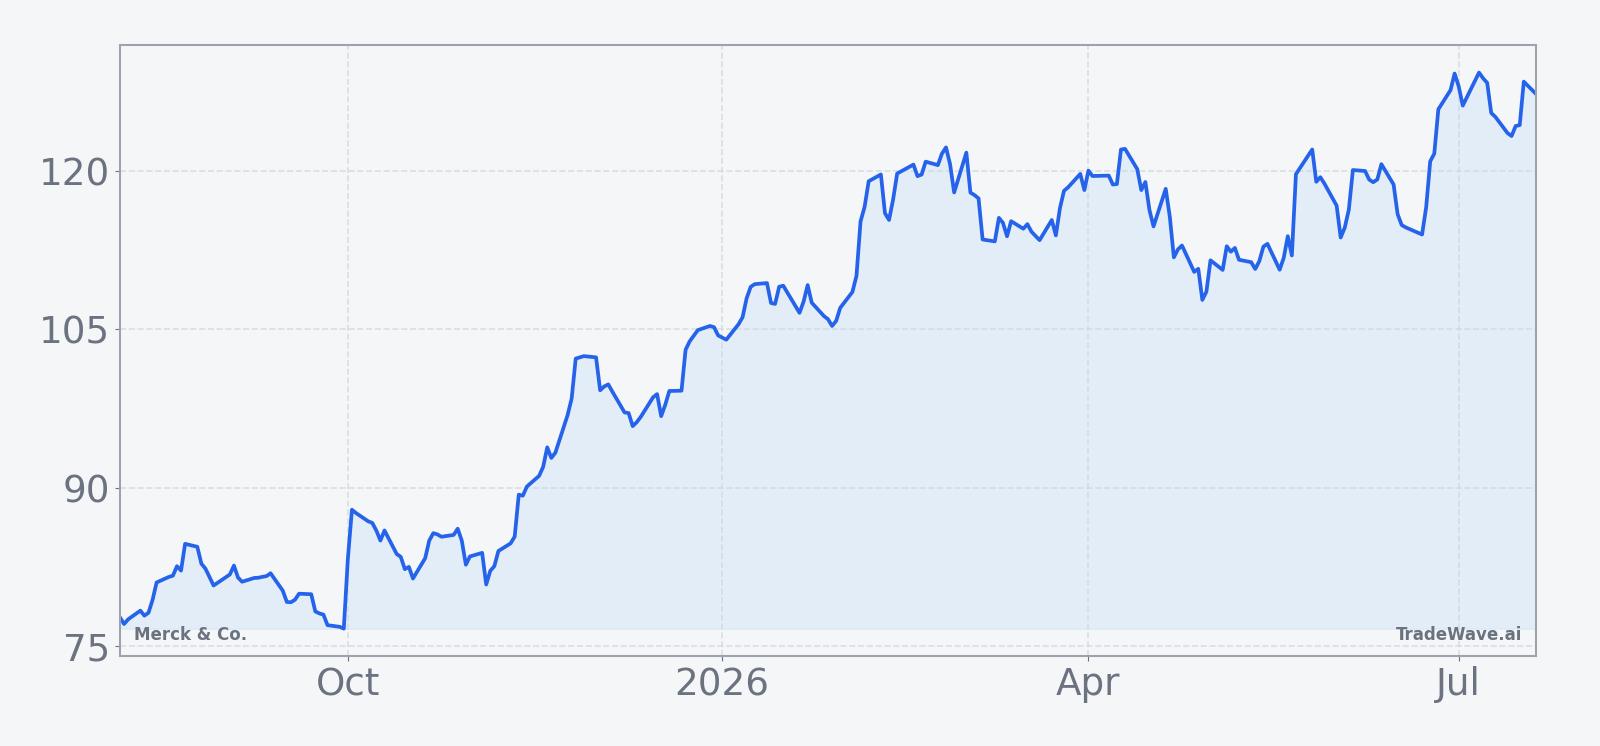
Merck & Co. closed Friday at $127.63, up 3.3% on the session, with roughly 12.4 million shares changing hands versus a 20-day average volume of about 11.1 million, and the stock sits about 2.0% below its 52-week high of $130.29. The move comes against a backdrop of mixed guidance and heavy investment: in February 2026 the company projected 2026 sales of $65.5 billion to $67.0 billion, with the high end still below Wall Street estimates as patent losses on legacy drugs like Januvia weigh on growth expectations.[3] By Apr 30, 2026, Merck had nudged that revenue range to $65.8 billion to $67.0 billion and raised adjusted EPS guidance to $5.04–$5.16, even as it absorbed a charge tied to the Cidara acquisition, signaling management’s willingness to trade near-term margin for pipeline depth.[4]
Those guidance updates sit on top of a busy deal and product backdrop. In November 2025, Merck agreed to buy Cidara Therapeutics for about $9.2 billion to add a long-acting antiviral candidate aimed at flu prevention, part of a broader push to diversify beyond Keytruda’s eventual patent expiry.[9] Around the same time, the company secured an FDA approval for a Keytruda plus Padcev regimen in muscle-invasive bladder cancer and launched a subcutaneous Keytruda formulation in Europe, both of which expanded the flagship drug’s addressable market and helped underpin the stock’s late-2025 surge.[1] Reports in March 2026 that Merck was nearing a roughly $6 billion acquisition of Terns Pharma to bolster its cancer portfolio reinforced the message that management is leaning into oncology and antiviral assets even as it warns that older franchises will drag on 2026 sales.[10]
Earlier earnings set the stage for that strategy. In Q3 2025, Merck delivered revenue of about $17.28 billion versus Street estimates near $16.96 billion, with Keytruda sales climbing roughly 10% to around $8.1 billion while Gardasil slipped to $1.75 billion, underscoring the company’s growing reliance on immuno-oncology to offset vaccine volatility.[5] By early 2026, executives were telling investors they saw a path to roughly $70 billion in revenue by the mid-2030s, driven by new growth opportunities and acquisitions, even as they cautioned that earnings growth would be slower in the near term because of deal spending and patent headwinds.[6][7] Against that backdrop, the upcoming seasonal window arrives with MRK already priced for a robust pipeline but still navigating the trade-off between current margins and future oncology and antiviral franchises.
The chart below places MRK’s latest push toward its highs in the context of the past year and overlays a short-term seasonal projection.
What should traders watch as this MRK seasonal window opens?
First, the calendar: the new 283-day window begins on Aug 6, 2026 and runs deep into the pre-election year, a phase that has historically been friendlier to equities and especially to defensive growth sectors like healthcare. Traders will be watching whether MRK can hold above its 50-day moving average, currently around $117.99, if volatility picks up, and whether any pullbacks stay shallow relative to the double-digit adverse moves seen in some past windows. A sustained break below that moving average during the window would mark a clear departure from the historical pattern of steady upside.
Second, the policy and patent backdrop will be key. The company has already flagged that loss of exclusivity on drugs such as Januvia will pressure 2026 sales, so any additional guidance cuts or sharper-than-expected erosion in legacy franchises could test the stock’s ability to repeat its historical midterm-to-pre-election strength.[3] On the flip side, further oncology approvals, clean readouts from late-stage trials, or confirmation of additional pipeline-boosting deals like the Cidara and potential Terns transactions could reinforce the long bias that has dominated prior cycles.[9][10]
Finally, behavior inside the window will matter as much as the end result. In prior years, MRK has often tolerated mid-window drawdowns of 5% to 10% before finishing strongly higher, so traders may look for whether any early weakness is bought quickly or whether selling pressure persists. If the stock spends much of the window grinding higher with contained downside, it would rhyme with the historical pattern. If instead MRK breaks down and fails to recover, that would be a clear signal that the election-cycle seasonal tailwind has given way to a new regime driven more by fundamentals than by the calendar.
Sources
- 1. Forbes — Why Is Merck Stock Surging? (Nov 26, 2025).
- 2. Seeking Alpha (SA News) — Key deals this week: Merck, Glencore, CrowdStrike, Marvell Technology, Steel Dynamics and more (Jan 10, 2026).
- 3. Reuters &mdash Merck forecasts 2026 sales below estimates on patent losses (Feb 3, 2026).
- 4. CNBC — Merck beats quarterly estimates on strength of Keytruda and new products, narrows outlook (Apr 30, 2026).
- 5. Reuters — Merck posts higher third-quarter sales as Keytruda growth offsets drop from Gardasil (Oct 30, 2025).
- 6. Reuters — Merck says new growth opportunities to drive revenue of $70 billion by mid-2030s (Jan 13, 2026).
- 7. Wall Street Journal — Merck Expects Slower Earnings Growth As It Spends on Acquisitions (Feb 3, 2026).
- 8. Forbes — Is Merck Stock’s Run Legitimate? (Dec 24, 2025).
- 9. Reuters — Merck bets on flu prevention with $9.2 billion deal for Cidara Therapeutics (Nov 14, 2025).
- 10. Reuters — Merck nears $6 billion acquisition of Terns Pharma to boost cancer portfolio, FT reports (Mar 25, 2026).
About this seasonal analysis
Seasonal pattern data is sourced from TradeWave.ai, which analyzes historical price behavior across annual calendar windows going back up to 30 years. Read the full data methodology or the book The 100-Year Pattern by Afshin Moshrefi (2026 edition). Past performance of seasonal patterns does not guarantee future results. This article is for informational purposes only and does not constitute investment advice.