Merck & Co. (MRK) Has Rallied in 15 of 15 Midterm Winter Runs, Averaging 13.24% Gains
Merck & Co. is approaching an Aug 22–Jan 7 stretch that has been quietly powerful for the stock, just as shares hover near a 52-week high and options activity picks up.
Price as of Jul 30, 2026: $129.79 (last close).

What is the seasonal pattern for Merck & Co. (MRK)?
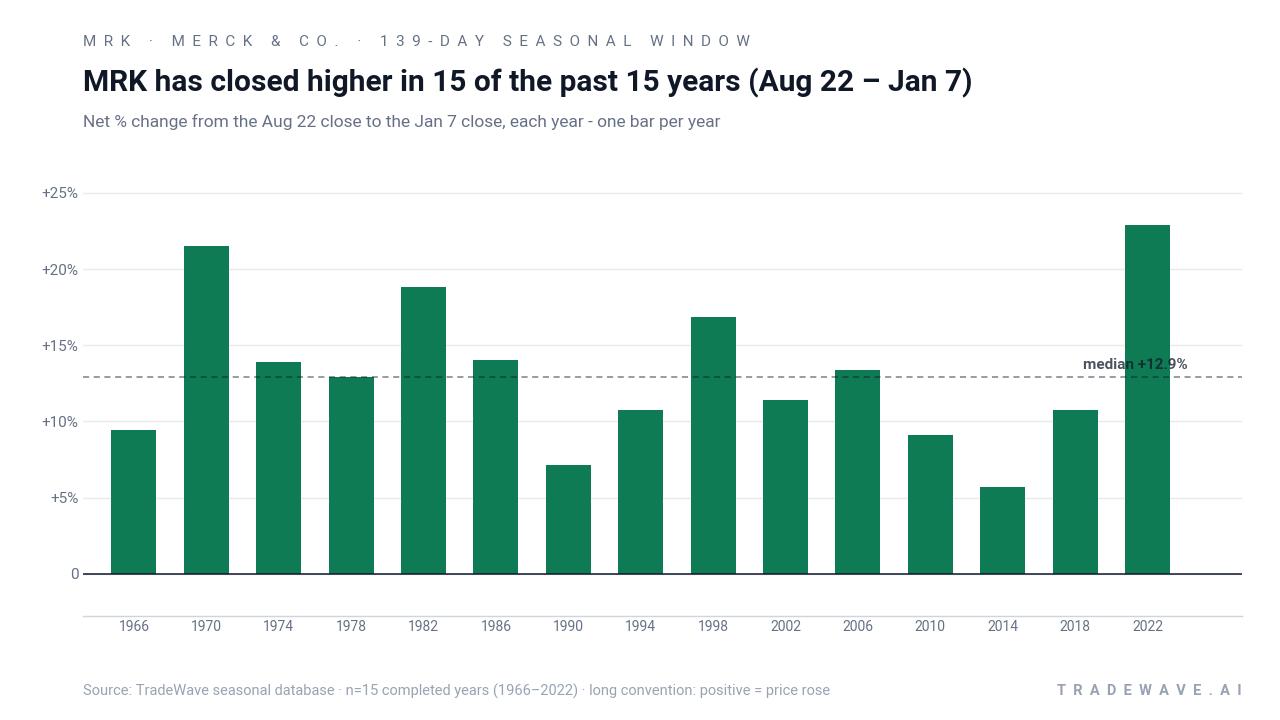
Merck & Co. has risen in 15 of 15 midterm-year Aug 22–Jan 7 windows, with an average gain of 13.24% in winning years.
- 15 for 15 in this window, averaging 13.24% gains in winning years across the last 15 midterm election cycles.
- Seasonal window runs from Aug 22 through Jan 7, spanning 139 calendar days in the heart of the midterm election year.
- Percent Profitable is 100%, with 15 winners and 0 losers for this long-direction pattern.
- Median gain of 12.93% and cumulative return of 536% when stacking only this window across the sample.
- TradeWave Ratio of 2.64 and Sharpe ratio of 2.35 point to strong, historically efficient upside for longs during this MRK seasonal trend.
- Individual years have still seen meaningful drawdowns inside the window, so intraperiod risk has been real even in an all-winner sample.
According to historical data from TradeWave.ai, this midterm-year stretch for Merck & Co. has behaved very differently from an average calendar quarter, with a distinct upside bias that shows up repeatedly across cycles.
How has Merck & Co. (MRK) traded in the Aug 22–Jan 7 midterm-year window?
Merck & Co. has posted gains in every single Aug 22–Jan 7 window across the last 15 midterm election years, averaging a 13.24% rise for longs. Shares finished the prior session at 129.79, leaving the stock about 3.9% below its 52-week high of 135.05 and still elevated after a strong 52-week run that outpaced both the S&P 500 and the health care sector.[2] In late July, Merck also saw an alert for unusually high options volume, a sign that derivatives traders are leaning in more aggressively around this level.[8] The combination of a powerful historical seasonality window, a stock trading near its highs, and fresh options interest gives this upcoming Merck & Co. trading window unusual weight on the calendar.
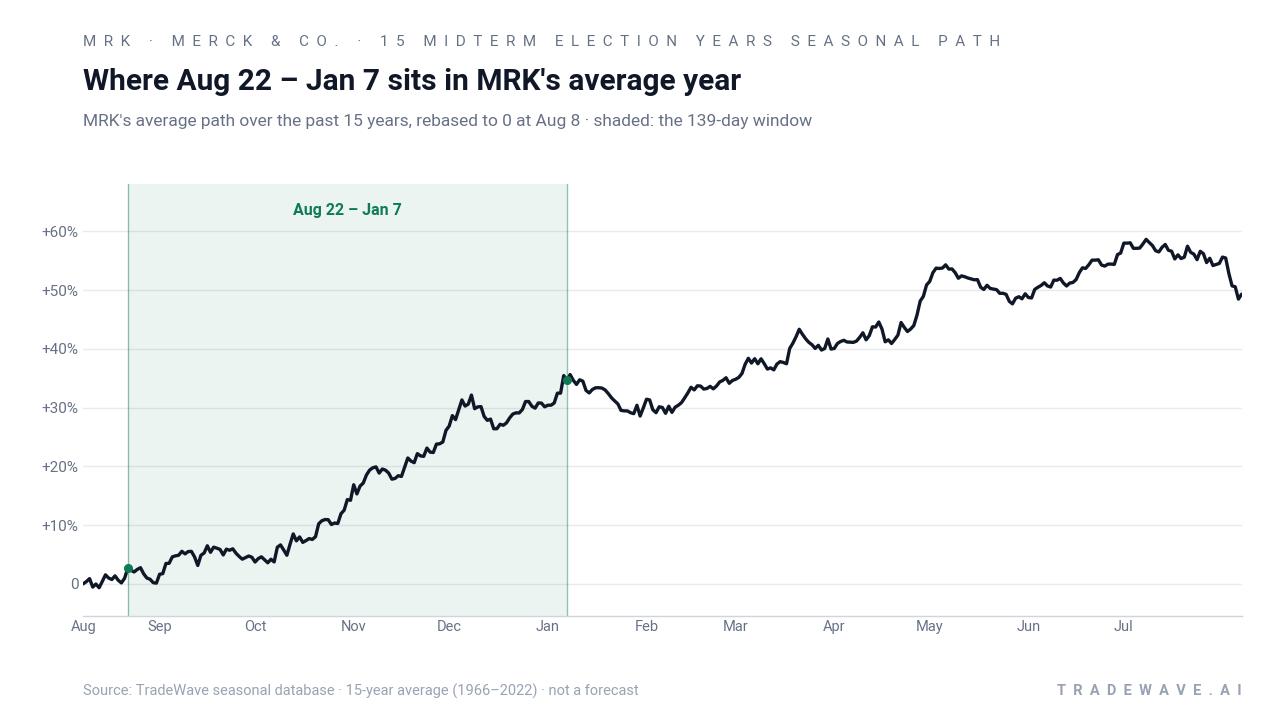
Because this pattern is grouped by the presidential election cycle, it reflects how Merck & Co. has behaved specifically in the year before the presidential election, not just in any random autumn. Midterm election years often bring shifting policy expectations, drug-pricing rhetoric and portfolio repositioning in health care, so a consistent MRK seasonal trend across 15 such cycles stands out.
In raw numbers, the Aug 22–Jan 7 window has delivered a 100% win rate for long positions, with 15 winners and 0 losers. Average profit across those winning years is 13.24%, while the median sits close by at 12.93%, which tells you the distribution is tight rather than driven by a single outlier year. Add it up and stacking only this 139-day slice across the sample compounds to a 536% cumulative gain, a striking result for a single recurring window.
The per-year table shows how that upside has played out in practice. The strongest year in the sample was 2022, when MRK gained 22.87% between the Aug 22 entry and the Jan 7 exit, with a best intraperiod run-up of 28.56% before giving back some ground. On the softer side, 2014 still finished up 5.68% for the window, but it carried a worst drawdown of 10.64% along the way, a reminder that even “all green” years can feel rough in the middle.
Looking at intraperiod swings, the maximum favorable move, or MFE, has often been meaningfully larger than the final net gain, which is what you would expect in a trending but volatile stock pattern analysis. Several years, including 1998 and 2022, saw MRK rally more than 24% at the best point in the window before settling back to lower, but still positive, closes. On the downside, the maximum adverse move, or MAE, has reached into the mid-teens in some cycles, such as 2002 with an 18.81% worst drawdown, even though the final result was an 11.38% gain.
A second view that layers net results with both best and worst intraperiod moves helps frame the upside and downside range traders have faced.
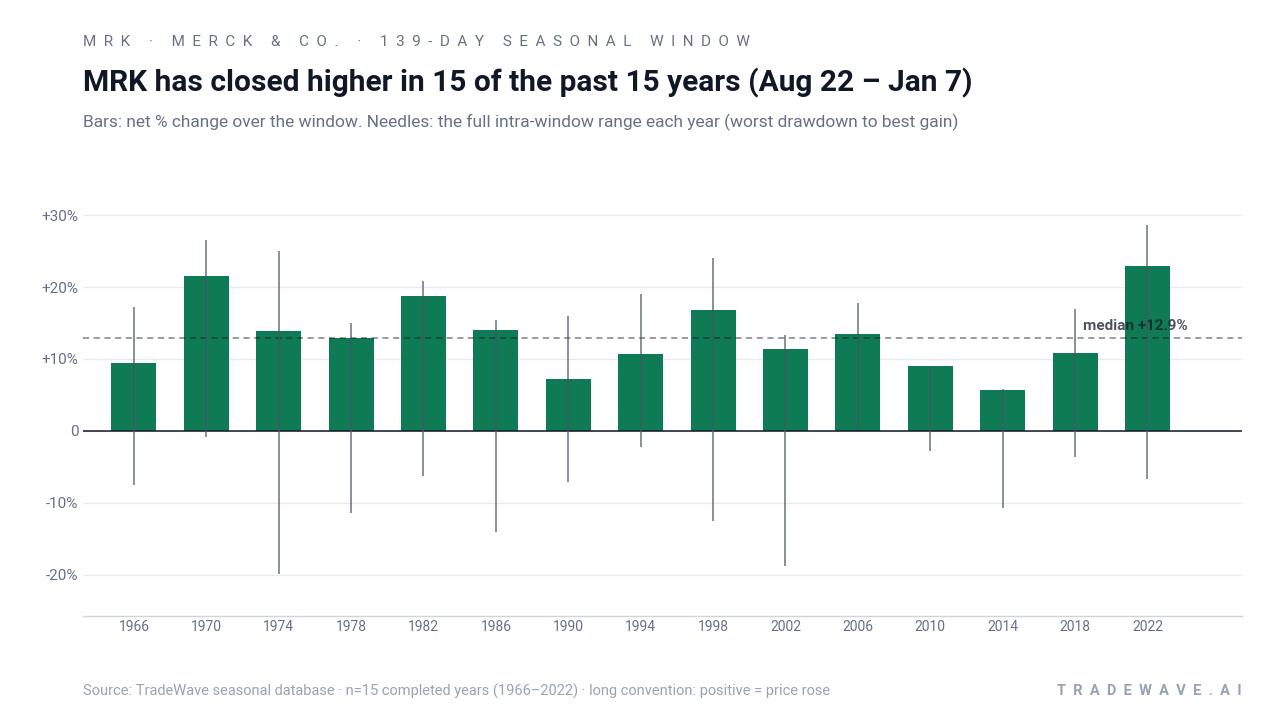
The stacked net / MFE / MAE profile makes the character of this Merck & Co. trading window clear. In most years, the bar for the final gain sits comfortably above zero, while the needles extend both higher and lower, capturing the full swing from worst drawdown to best rally. Large positive needles relative to the bars highlight how often MRK has overshot to the upside before settling, while the negative tails show that double-digit pullbacks have been part of the ride even in winning years.
History does not guarantee future results; adverse excursions (MAE) can be large even in winning windows.
Why does Merck & Co. (MRK) follow this seasonal pattern?
One likely driver is the way Merck’s earnings calendar and guidance updates cluster into the back half of the year, when investors reassess pipelines, patent cliffs and next-year revenue trajectories.[2][3] The midterm election year also tends to concentrate policy headlines on drug pricing and reimbursement, which can trigger sector rotation into or out of large-cap pharma as clarity improves. This pattern may reflect institutional portfolio managers adding exposure to defensive health care names like Merck & Co. as they rebalance into year-end and position for the historically stronger pre-election year that follows.
What is driving Merck & Co. (MRK) today?
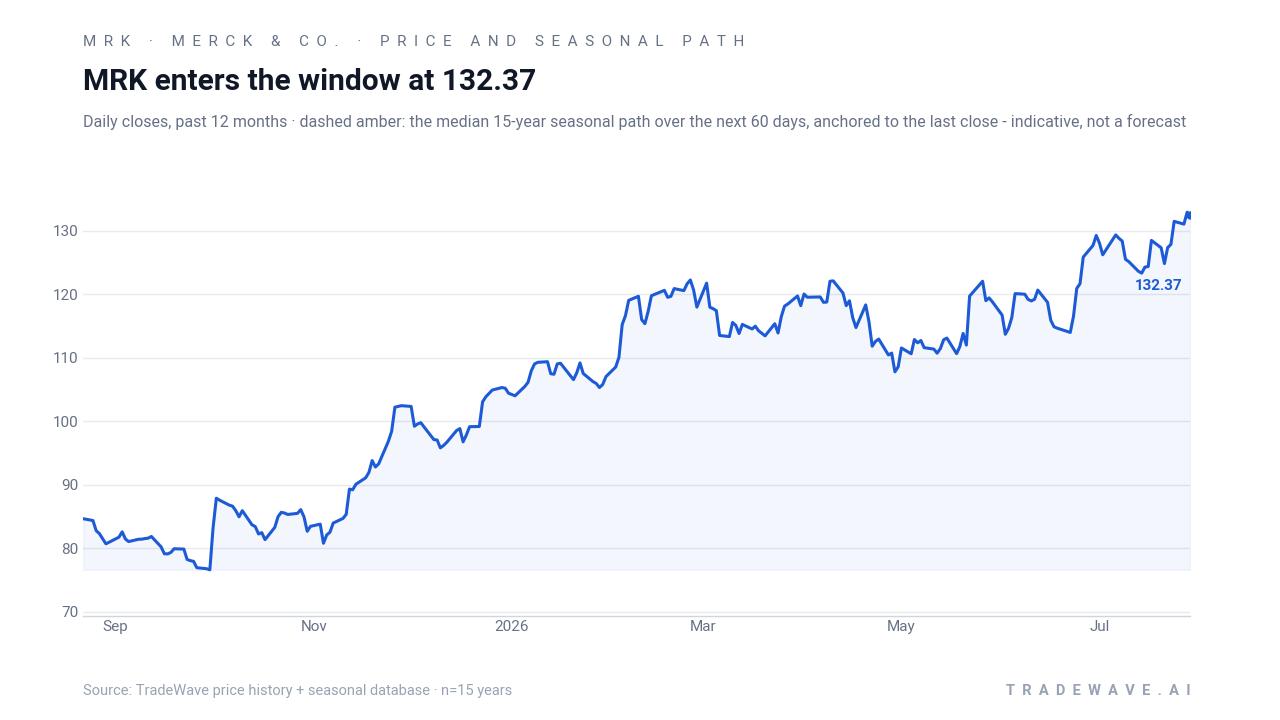
Merck & Co. closed the latest session at 129.79, down 0.4% on the day, after trading between 127.25 and 130.21 on volume slightly below its 20-day average of about 8.7 million shares. That leaves the stock roughly 3.9% below its 52-week high of 135.05 and well above its 50-day moving average near 121.55, capping a 52-week stretch in which MRK has gained 48.8% versus 20.1% for the S&P 500 and 19.4% for the Health Care Select Sector SPDR (XLV).[2] In late July, MarketBeat flagged that Merck set a new 1-year high and highlighted a consensus “Moderate Buy” rating with a blended price target around 133.94 from MarketBeat and Barchart aggregation, with some firms, including Morgan Stanley, projecting further upside.[3][4][5][6]
Fundamentally, Merck is coming off a run of solid, if complex, earnings prints. Q3 2025 results showed adjusted EPS of $2.58 versus a $2.36 estimate and revenue of $17.3 billion against $17.1 billion expected, while management guided full-year 2025 adjusted EPS to $8.93–$8.98 and revenue to $64.5–$65.0 billion.[1][2] The Apr 30, 2026 report delivered a GAAP EPS loss of $1.28 that still beat consensus and revenue of $16.29 billion, up 4.9% year over year, reinforcing the view that headline earnings volatility masks a still-growing top line.[3] MarketBeat data places Merck’s valuation at a price-to-earnings multiple of 36.66 versus a medical sector average near 26.87, with a 2.69% dividend yield, which helps explain why the stock has become a favored defensive growth holding in many portfolios.[4]
Positioning has also been shifting. MarketBeat recently reported that Gerald Baker Financial Group initiated a $1.55 million position in Merck, adding to a long list of institutional holders that have been building stakes as the stock broke out to new highs.[7] On Jul 22, a separate MarketBeat alert flagged unusually high options volume in MRK, suggesting that derivatives traders are either hedging elevated gains or speculating on further moves as the stock hovers near resistance.[8] Earlier technical work from ChartMill at the start of the year framed Merck as a breakout candidate, and the subsequent price action has largely validated that setup, with the stock pushing through prior ranges and holding above key moving averages.[9]
The chart below situates the latest move against the past year of trading and the median 60-day seasonal path.
What should traders watch as this Merck & Co. seasonal window approaches?
First, the calendar. The Aug 22 start date is less than a month away, and it runs deep into the first week of January, overlapping both Merck’s late-year earnings cadence and the broader shift from the midterm election year into the historically stronger pre-election year. Traders watching MRK’s seasonal outlook will want to see whether the stock can hold above its 50-day moving average and continue to respect the breakout zone as that window opens.
Second, catalysts. While the next formal earnings date is not yet set, the company’s prior pattern suggests another update in the autumn, which would land squarely inside this 139-day window.[2][3] Any changes to guidance around key franchises or pipeline assets could either reinforce or challenge the historical seasonality, especially if they alter the narrative on Merck’s premium valuation and dividend support.[1][4]
Third, options and flows. The late-July spike in options activity is an early tell that more sophisticated traders are positioning around MRK’s elevated price and upcoming catalysts.[8] If that unusual options volume continues to build into August, particularly in upside calls or protective puts, it would signal that the market is bracing for larger moves that could either amplify or blunt the typical MRK seasonal trend. A fade in options interest, by contrast, would suggest that the recent alert was more of a one-off hedge than the start of a sustained positioning shift.
Finally, behavior inside the window itself will be the real test. In prior midterm election years, MRK’s strongest seasonal gains often came after absorbing a mid-window pullback, with MAE readings in the mid- to high-single digits before the stock pushed to new highs. If this year’s window again features an early shakeout followed by a grind higher into January, it would fit neatly with the 15-for-15 historical pattern. A sharp break below the 50-day moving average that fails to recover during the window, on the other hand, would mark a clear departure from the past and force traders to reassess how much weight to give this particular Merck & Co. seasonal pattern.
Sources
- Barchart – Merck & Co. Stock Outlook: Is Wall Street Bullish or Bearish? (Jan 30, 2026)
- Barchart – Earnings Preview: What To Expect From Merck & Co.'s Report (Jul 14, 2026)
- MarketBeat – Morgan Stanley Forecasts Strong Price Appreciation for Merck & Co., Inc. (NYSE:MRK) Stock (Jul 9, 2026)
- MarketBeat – Merck & Co., Inc. (MRK) Stock Price, News & Analysis (Jul 23, 2026)
- MarketBeat – Merck & Co., Inc. (NYSE:MRK) Price Target Raised to $145.00 (Jul 13, 2026)
- MarketBeat – Merck & Co., Inc. (NYSE:MRK) Sets New 1-Year High - What's Next? (Jul 27, 2026)
- MarketBeat – Gerald Baker Financial Group LLC Takes $1.55 Million Position in Merck & Co., Inc. $MRK (Jul 17, 2026)
- MarketBeat – Merck & Co., Inc. Sees Unusually High Options Volume (NYSE:MRK) (Jul 22, 2026)
- ChartMill – Technical Breakout Setup for Merck & Co. Inc. (NYSE:MRK) (Jan 31, 2026)
About this seasonal analysis
Seasonal pattern data is sourced from TradeWave.ai, which analyzes historical price behavior across annual calendar windows going back up to 30 years. Read the full data methodology or the book The 100-Year Pattern by Afshin Moshrefi (2026 edition). Past performance of seasonal patterns does not guarantee future results. This article is for informational purposes only and does not constitute investment advice.