Near Record Highs, Merck & Co. (MRK) Enters Aug 22-Jan 7 Window With 100% Win Record
Merck & Co. is approaching a historically powerful Aug 22–Jan 7 trading window just as shares trade near record highs after a strong Q2 beat and raised sales outlook.
Price as of Aug 7, 2026: $128.58 (last close).
What is the seasonal pattern for Merck & Co. (MRK)?
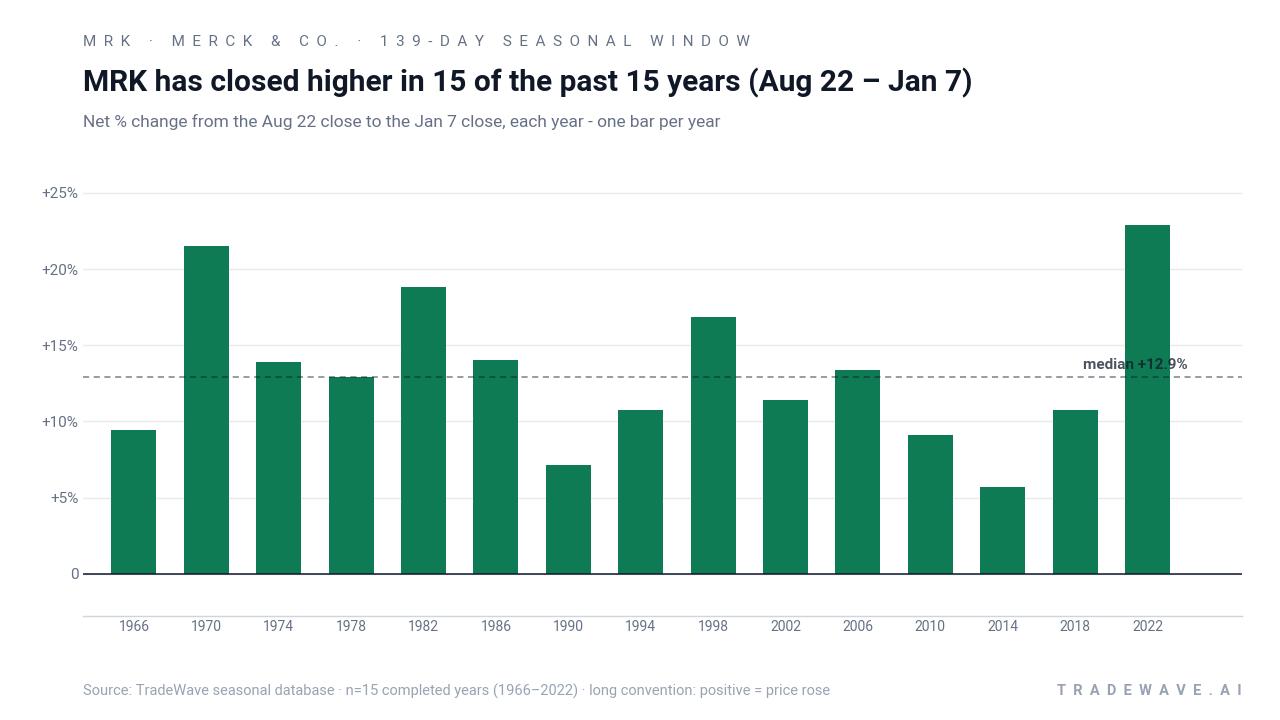
Merck & Co. has risen in 15 of 15 midterm-election-year Aug 22–Jan 7 windows, with an average gain of 13.24% in winning years.
- 15 for 15 in this window, with Merck & Co. averaging 13.24% gains in winning years across the last 15 midterm election cycles.
- Seasonal window runs from Aug 22 through Jan 7, spanning 139 calendar days and aligning with the late-year stretch of the midterm election year.
- Percent Profitable is 100%, with 15 winners and 0 losers in the historical sample for this MRK seasonal trend.
- Annualized return for this Merck & Co. trading window is 13.14%, supported by a Sharpe ratio of 2.35 on a long-direction setup.
- TradeWave Ratio of 2.64 suggests price has typically traveled meaningfully in the long direction within the window, even before final closes are tallied.
- Individual years have still seen notable drawdowns inside the window, underscoring that intraperiod volatility can be sharp even when the final outcome is positive.
According to historical data from TradeWave.ai, this late-summer stretch in midterm election years has behaved very differently from an average calendar quarter for Merck & Co., and the next iteration is about to open again.
How strong is the upcoming seasonal window for Merck & Co. (MRK)?
Merck & Co. has posted gains in every single Aug 22–Jan 7 window across the last 15 midterm election years, averaging a 13.24% rise for the stock over those 139-day stretches. Shares finished Monday at $128.58, up 0.2% on the day and 22.15% year to date, leaving the stock about 4.8% below its 52-week high of $135.05.[3] That combination of a clean 15-for-15 seasonal record and a price sitting just under record territory gives this upcoming window unusual weight for traders watching the healthcare sector’s seasonal outlook.
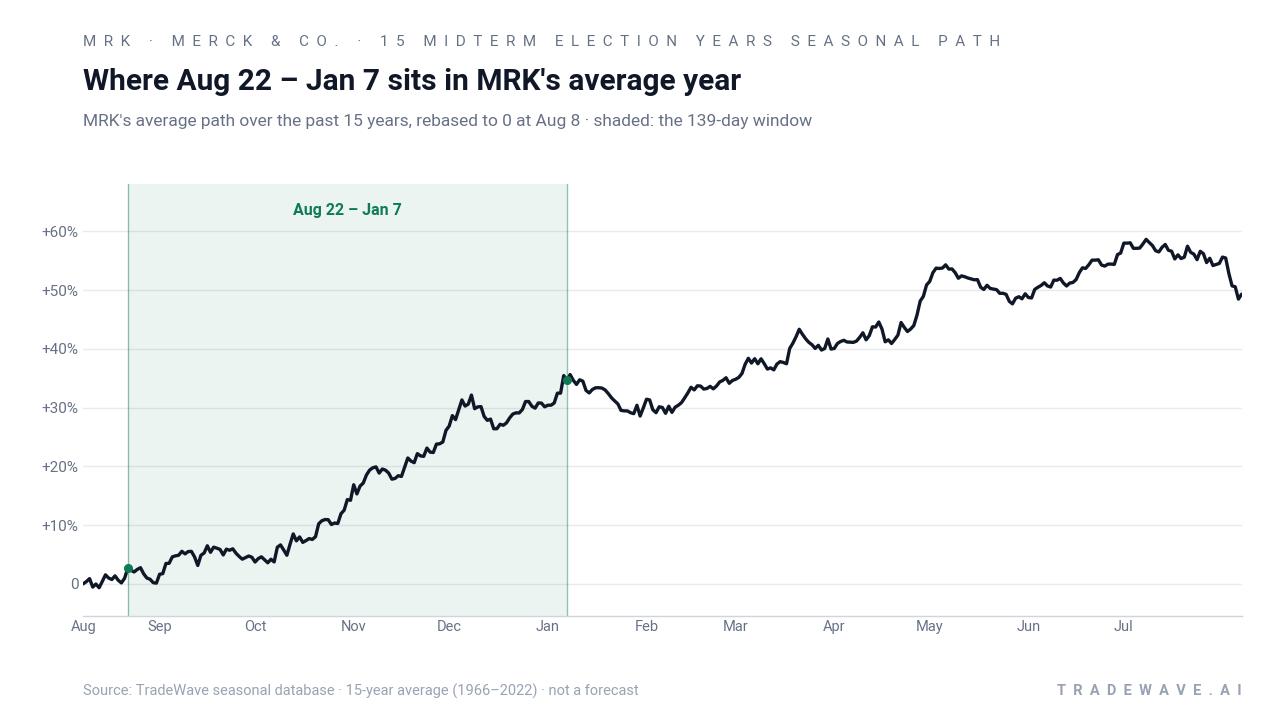
Grouping the data by the presidential election cycle matters here because this window sits in the back half of the midterm election year, a phase that has often seen risk appetite rebuild as policy uncertainty around regulation and drug pricing clears up for large pharmaceutical names.[1] In that context, Merck’s 139-day late-summer to early-January window has historically behaved more like a distinct regime than just another quarter on the calendar.
Across the 15 midterm election years in the sample, the trade direction for this pattern is long, and every completed window finished in positive territory. Percent Profitable is 100%, with 15 winners and 0 losers, and the median gain of 12.93% sits close to the 13.24% average, which suggests the outcome has been consistently positive rather than skewed by a single outlier year.
Average profit in winning years is 13.24%, while the annualized return for repeatedly holding only this slice of the year clocks in at 13.14%. Add it up and stacking this Aug 22–Jan 7 window across the 15 midterm election years would have compounded to roughly 536% cumulative gains, a powerful result for a single recurring Merck & Co. trading window.
The intraperiod path has not been a straight line. In 2022, for example, Merck gained 22.87% over the window, with a best point-to-peak move of 28.56% but also a worst drawdown of 6.68% from the entry level. Earlier cycles show even deeper temporary setbacks, such as 2002, when the stock ultimately rose 11.38% but experienced an adverse move of 18.81% at one point during the window.
On the other side of the spectrum, some years have been smoother. In 2006, Merck’s 13.41% net gain came with almost no downside from the entry, as the worst intraperiod move was a negligible 0.08% dip. That mix of choppy and clean paths is what the TradeWave Ratio of 2.64 is flagging: historically, the stock has tended to travel a meaningful distance in the long direction inside the window, even when the final close does not capture the full swing.
A second view shows how far Merck has typically swung inside the window before settling at its final gain.
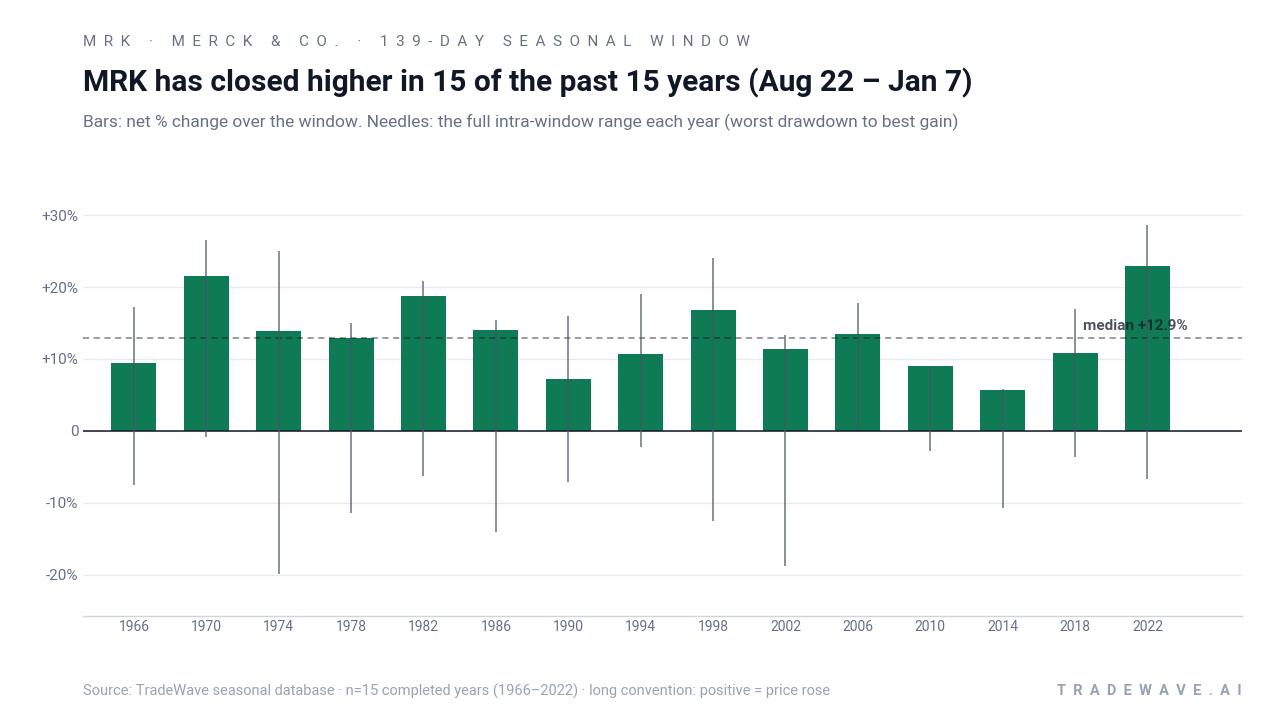
The stacked net-return and intraperiod range chart shows that maximum favorable moves have often stretched well beyond the final gain, while maximum adverse moves have at times been deep enough to test conviction. In several years, the worst drawdown arrived early in the window, followed by a recovery and eventual higher close, which fits the idea of a volatile but ultimately constructive late-year pattern for a large pharma stock in a midterm election year.
The cumulative return chart for this window slopes steadily higher across the 15 midterm election years, with no flat or negative segments, which is unusual for a single stock pattern. The key takeaway is simple: 15 for 15 with double-digit average gains is a rare record for any S&P 500 name in a window this long.
History does not guarantee future results; adverse excursions within the window have at times been large even when the final outcome was positive.
Why does Merck & Co. (MRK) follow this seasonal pattern?
One likely driver is the clustering of Merck’s earnings and guidance updates into the late third and fourth quarters, when management often refines its outlook and investors recalibrate drug pipeline expectations.[1][2] Analysts have also pointed to institutional portfolio repositioning around the midterm election year, as healthcare and oncology names like Merck can benefit when policy risk looks more contained and defensive growth is back in favor.[1] This pattern may also reflect year-end index and sector rebalancing, which can funnel flows into large-cap pharma stocks during the final months of the year.
What is driving Merck & Co. (MRK) today?
Merck & Co. closed Monday at $128.58, up 0.21 on the session, extending a run that has lifted the stock 22.15% so far in 2026 and left it about 4.8% below its 52-week high of $135.05.[3][10] The move comes in the wake of Merck’s Aug 4 Q2 report, where the company beat revenue expectations with $16.61 billion in sales versus $16.27 billion forecast and delivered a smaller-than-expected adjusted loss per share of $0.13, helped by 5% growth in Keytruda to $8.37 billion including early contributions from the subcutaneous Keytruda QLEx formulation.[1][6]
The company also raised its full-year sales forecast, citing momentum from newer drugs such as Winrevair alongside continued strength in its oncology franchise, a shift that has reinforced the stock’s role as a core healthcare holding in many portfolios.[1][6] Sector coverage notes that Merck remains a heavyweight in the healthcare and pharma complex, often trading in tandem with the XLV health care ETF and broader S&P 500 context when macro risk sentiment swings.[1]
On the governance side, filings show executive share sales in early August, including an EVP transaction reported in regulatory Form 4 disclosures, which some traders watch as a sentiment gauge but which has not altered the broader analyst stance on the stock.[11] Analyst compilations still frame Merck as a “Moderate Buy,” with a consensus price target around $135.65 from aggregated Wall Street estimates, modestly above the current share price and broadly consistent with the stock’s recent trading band.[1][2]
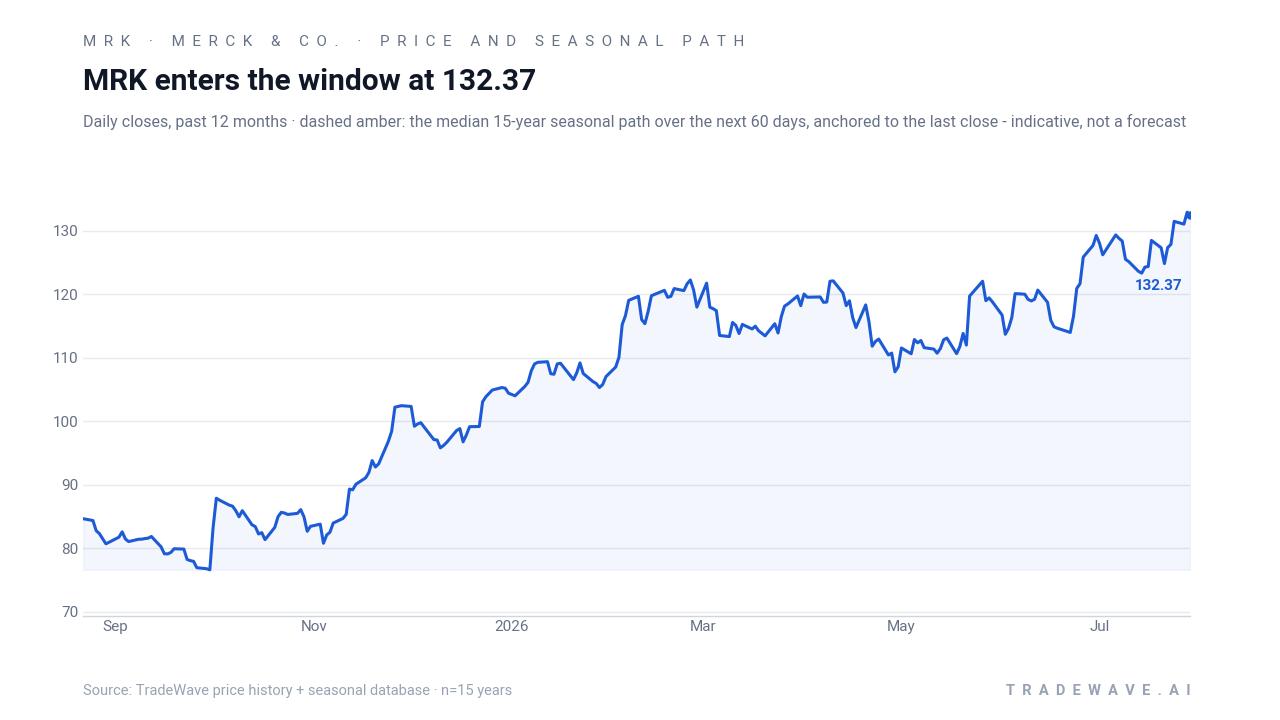
The chart below situates the latest move in its recent multi-month context alongside the historical seasonal projection.
What should traders watch as this Merck & Co. window opens?
First, the calendar: the 139-day window begins on Aug 22 and runs through Jan 7, covering Merck’s next earnings report on Oct 29 and the heart of the year-end positioning season.[2] How the stock trades around that Q3 release, especially if management updates guidance again or provides more detail on newer drugs like Winrevair, will help confirm whether this midterm-year seasonal pattern is tracking its historical script.[1][6]
Second, levels matter. With MRK sitting just under its 52-week high, traders will be watching whether the stock can sustain closes above the low-130s and eventually challenge the $135 area as the window progresses, or whether any pullbacks resemble the deeper intraperiod drawdowns seen in years like 2002 and 2014 before recovering.[3][10] A pattern of higher lows into and through the Oct 29 earnings date would be more consistent with the historical late-year grind higher.
Third, sector and policy signals will be key. Any fresh headlines around FDA decisions, drug pricing, or oncology competition could either reinforce or blunt the typical midterm-year risk-on tilt for large pharma, especially given Merck’s central role in the healthcare/oncology trade and its frequent pairing with XLV in institutional discussions.[1][3] Traders will also keep an eye on insider filings and executive transactions; a slowdown in Form 4 selling after the early-August EVP sale would remove a small overhang, while a cluster of new sales could add noise around an otherwise strong seasonal backdrop.[11]
Finally, behavior inside the window itself will be the real test. If Merck enters late August with rising volume on up days and pullbacks that stay relatively shallow compared with past maximum adverse moves, that would align with the historical pattern of constructive but volatile late-year performance. A sharp break that undercuts prior intraperiod drawdown norms, by contrast, would be an early sign that this midterm-year iteration is diverging from the 15-for-15 record and that traders should treat the seasonal template with extra caution.
Sources
- Barchart – Merck & Co’s Stock: Analyst Estimates & Ratings (Aug 6, 2026)
- ChartMill – MRK Forecast, Price Target & Analyst Ratings (Aug 4, 2026)
- MarketWatch – MRK Stock Price | Merck & Co. Inc. Stock Quote (Aug 9, 2026)
- Seeking Alpha – Merck lifts sales forecast as newer drugs gain momentum (Aug 4, 2026)
- Google-hosted price history – Merck & Co., Inc. (MRK) Stock Chart and Price History 2026 (Aug 7, 2026)
- Google-hosted article – Merck & Co., Inc. (NYSE:MRK) EVP Sells 18,706 Shares (Aug 7, 2026)
About this seasonal analysis
Seasonal pattern data is sourced from TradeWave.ai, which analyzes historical price behavior across annual calendar windows going back up to 30 years. Read the full data methodology or the book The 100-Year Pattern by Afshin Moshrefi (2026 edition). Past performance of seasonal patterns does not guarantee future results. This article is for informational purposes only and does not constitute investment advice.