Guidance Cut Leaves Kimberly-Clark (KMB) Vulnerable Into Historically Weak Aug-Oct Stretch
Kimberly-Clark is trading higher this year but still about 11.3% below its 52-week high as it approaches a late-August seasonal window that has historically leaned lower just as merger, guidance and positioning risks stack up.
Price as of Aug 19, 2026: $109.88 (last close).

What is the seasonal pattern for Kimberly-Clark (KMB)?
Kimberly-Clark has fallen in 8 of 10 years during the Aug 23 to Oct 21 window, with an average 7.02% gain in winning short years.
- 8 for 10 in this window, with winning short years averaging a 7.02% profit and a 5% average across all years.
- Seasonal bias is bearish for the stock from Aug 23 through Oct 21 over the past decade.
- Percent Profitable is 80%, with 8 winners and 2 losers for the short-side pattern.
- Avg Profit reflects only the profitable short years, while Avg Profit - All folds in the two losing years.
- The TradeWave Ratio of 1.96 suggests price has typically moved meaningfully in the trade direction within the 60-day window.
- Sharpe ratio of 1.04 points to a historically favorable risk-adjusted profile for this specific late-summer KMB seasonal trend.
According to historical data from TradeWave.ai, this upcoming stretch has behaved very differently from an average month on the calendar for Kimberly-Clark. The next section walks through how that pattern has played out and where it sits against today’s backdrop.
How has Kimberly-Clark (KMB) traded in the late-August seasonal window?
Kimberly-Clark has closed lower in 8 of the past 10 years during the Aug 23 to Oct 21 window, a short-side pattern that has compounded to a 67% cumulative return for traders following it. Shares finished Thursday at $109.88, up 2.0% on the day and about 11.3% below the stock’s 52-week high of roughly $123.76, even after an 11.77% gain year to date.
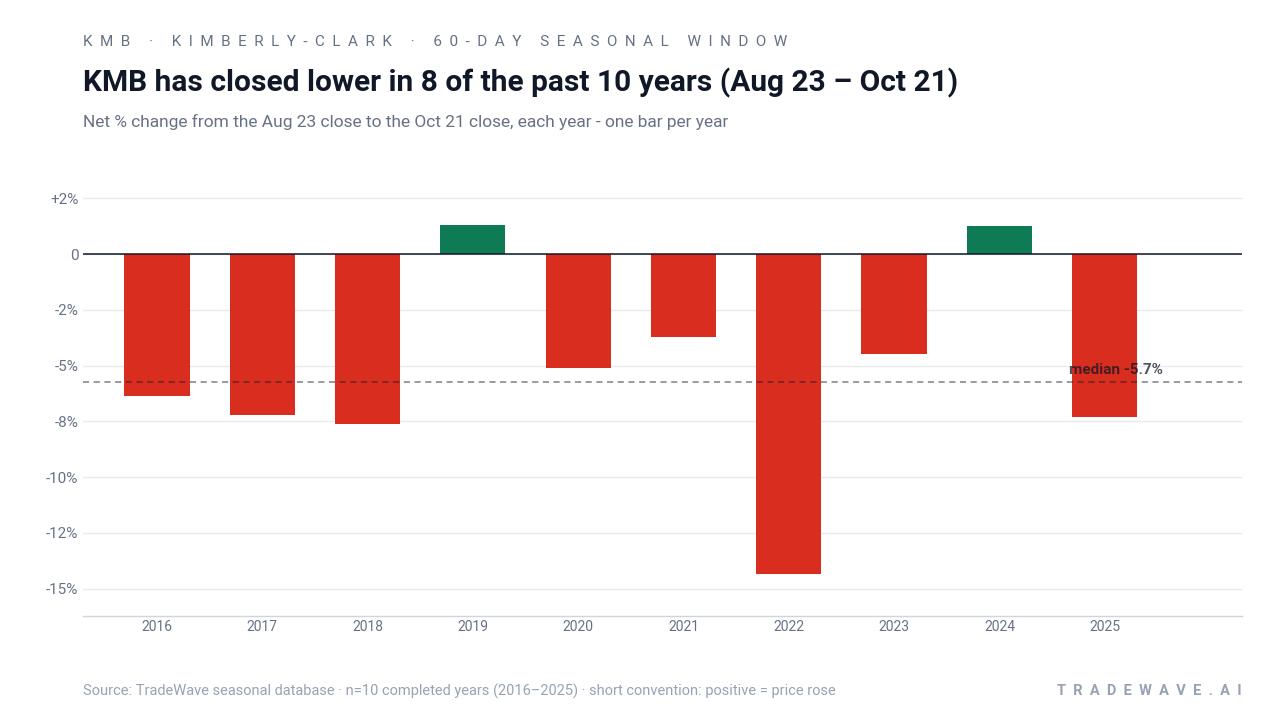
For this short-direction pattern, a “profitable” year means the stock finished the 60-day stretch below its Aug 23 starting level. Across the past decade, that has happened 8 times out of 10, giving the setup an 80% Percent Profitable reading. The average gain in those winning short years is 7.02%, while including the two losing years trims the all-years average to 5%.
The per-year breakdown shows how that has looked in practice. The strongest year for the short pattern was 2022, when KMB fell 14.33% between late August and late October, with the worst intraperiod drawdown from entry reaching 18.25% before the window closed. On the other side, 2019 and 2024 were losing years for shorts, with the stock rising 1.29% and 1.25% respectively over the window even though both still saw several percentage points of favorable downside at some point during the stretch.
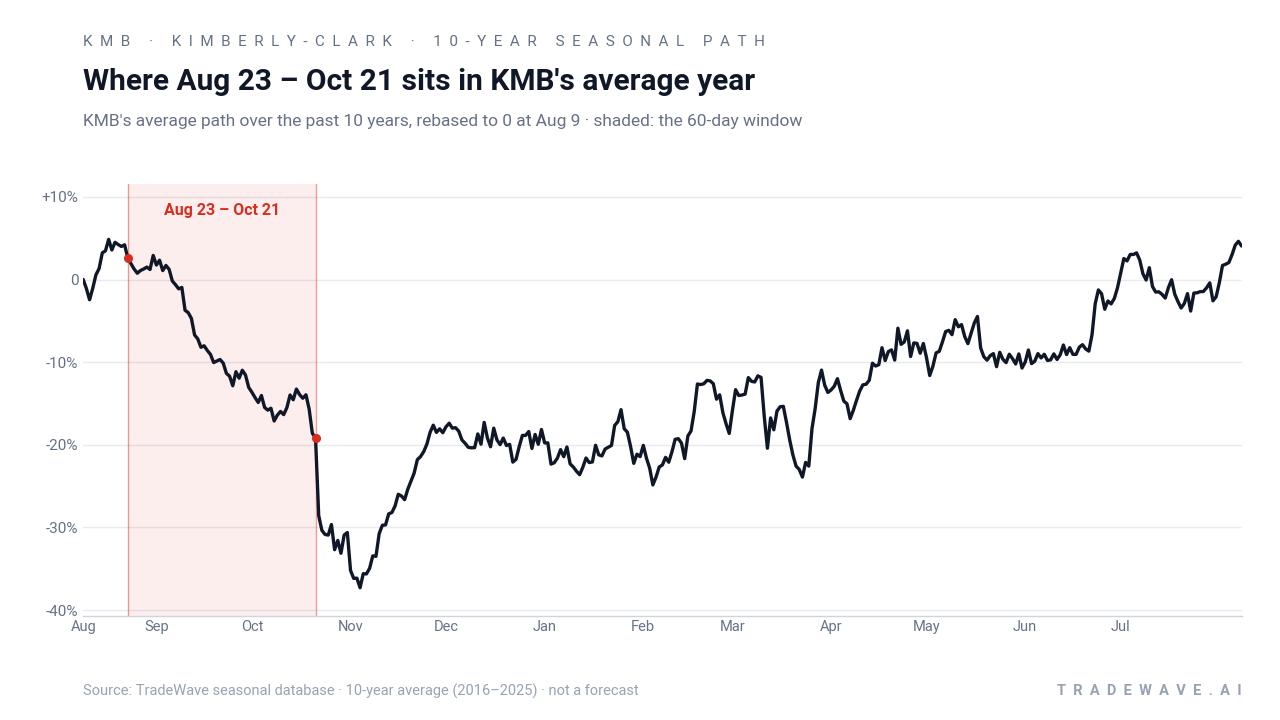
Yearly net and peak moves highlight how downside and upside swings have coexisted inside this 60-day window.
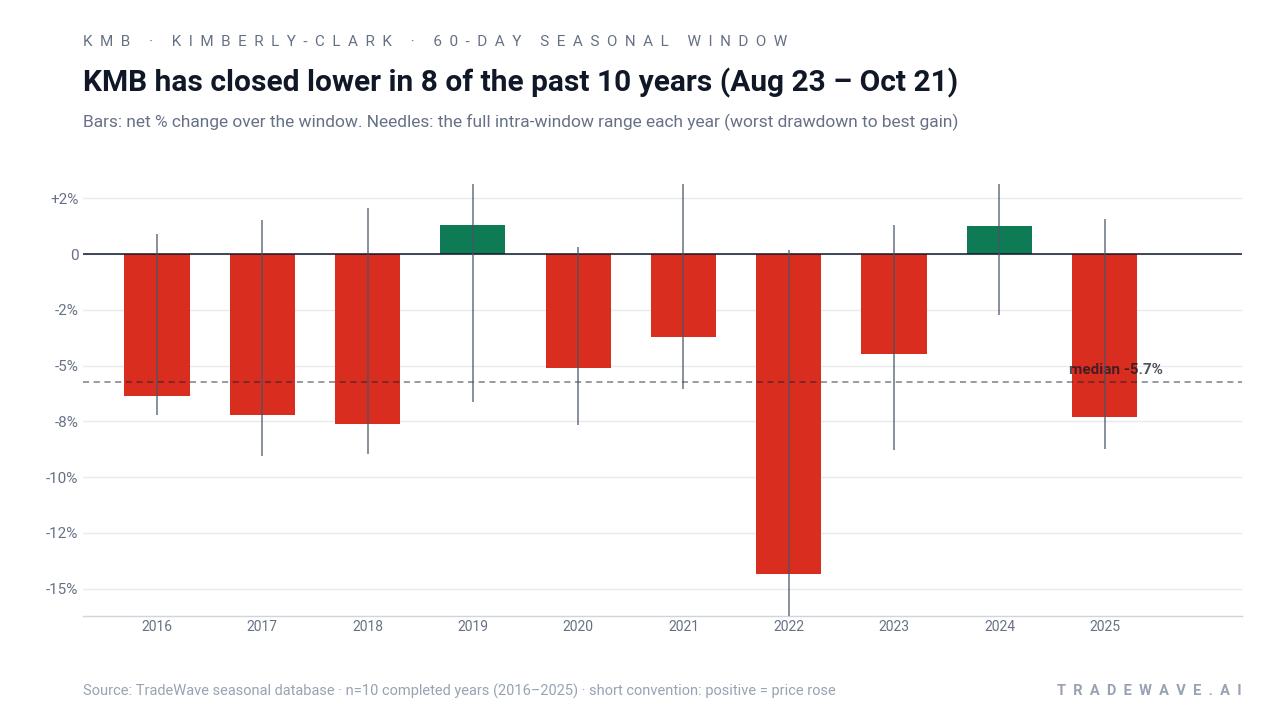
The stacked net, maximum favorable move and maximum adverse move view makes the risk profile clearer. In most years, the worst drawdown from the entry point has been deeper than the final net move, which means intraperiod swings have been larger than the closing result. In 2016, for example, the stock’s worst move against the short position was a 7.21% rally before it ultimately finished the window down 6.38%, while 2022 saw an 18.25% adverse excursion even as the short ended up strongly profitable.
That mix of sizable rallies and deeper selloffs is captured in the TradeWave Ratio of 1.96, which measures how far price typically travels in the trade direction within the window independent of the final close. The Sharpe ratio of 1.04, based on end-of-window outcomes, suggests the pattern has delivered a solid risk-adjusted profile over the past decade despite those swings. Add it up: 8 winning short years out of 10 and a 67% cumulative gain across the decade make this one of the more consistent late-summer seasonal stretches in Kimberly-Clark’s trading history.
History does not guarantee future results; adverse excursions (MAE) can be large even in winning windows.
Why does Kimberly-Clark (KMB) follow this seasonal pattern?
One likely driver is the way consumer-staples earnings and guidance updates cluster around midyear, which can leave late summer and early autumn trading dominated by positioning and estimate resets rather than fresh fundamental news. Analysts have also pointed to portfolio rebalancing and sector rotation as investors shift between defensive and cyclical names heading into the fourth quarter, a process that can pressure steady dividend payers like Kimberly-Clark. The pattern may also reflect how input-cost headlines and back-to-school consumer spending data shape expectations for household and personal products demand in the run-up to the holiday season.
What is driving Kimberly-Clark (KMB) today?
Kimberly-Clark closed at $109.88 on Thursday, up 2.0% on the session and roughly 11.77% higher year to date, leaving the stock about 11.3% below its 52-week high and roughly 22.2% above its 52-week low based on recent trading ranges.[1] The move comes in the wake of Q2 fiscal 2026 results on Aug 4, when the company reported $4.19 billion in revenue, slightly below the roughly $4.22 billion Wall Street expected, and cut its organic sales growth and earnings forecasts, yet the stock traded higher as investors focused on margin progress and the strategic pivot around its Kenvue acquisition.[2] That deal, which commentators have framed as creating a higher-margin consumer-health and personal-care powerhouse, has also drawn in merger-arbitrage players and helped push reported short interest to about 14.56% of float in 2026, up sharply from roughly 1.5% to 2.0% in mid-2025.[3]
Institutional positioning has been active around the name as the merger story has unfolded. Cetera Investment Advisers disclosed buying 75,582 shares of Kimberly-Clark, while Weiss Asset Management LP reported a $33.05 million investment, even as Assenagon Asset Management S.A. sold 163,661 shares, underscoring how views on the combined company’s trajectory are far from unanimous.[5][6][7] Trading volumes have been elevated but not extreme, with one Yahoo Finance snapshot showing 3.63 million shares changing hands against a 4.22 million average, consistent with a stock that is in focus but not in outright frenzy.[1] Against that backdrop, the upcoming ex-dividend date of Sep 4 for a $1.28 per-share payout keeps the dividend story front and center for income-focused holders, even as guidance cuts and merger integration risks keep fundamental analysts cautious.[1]
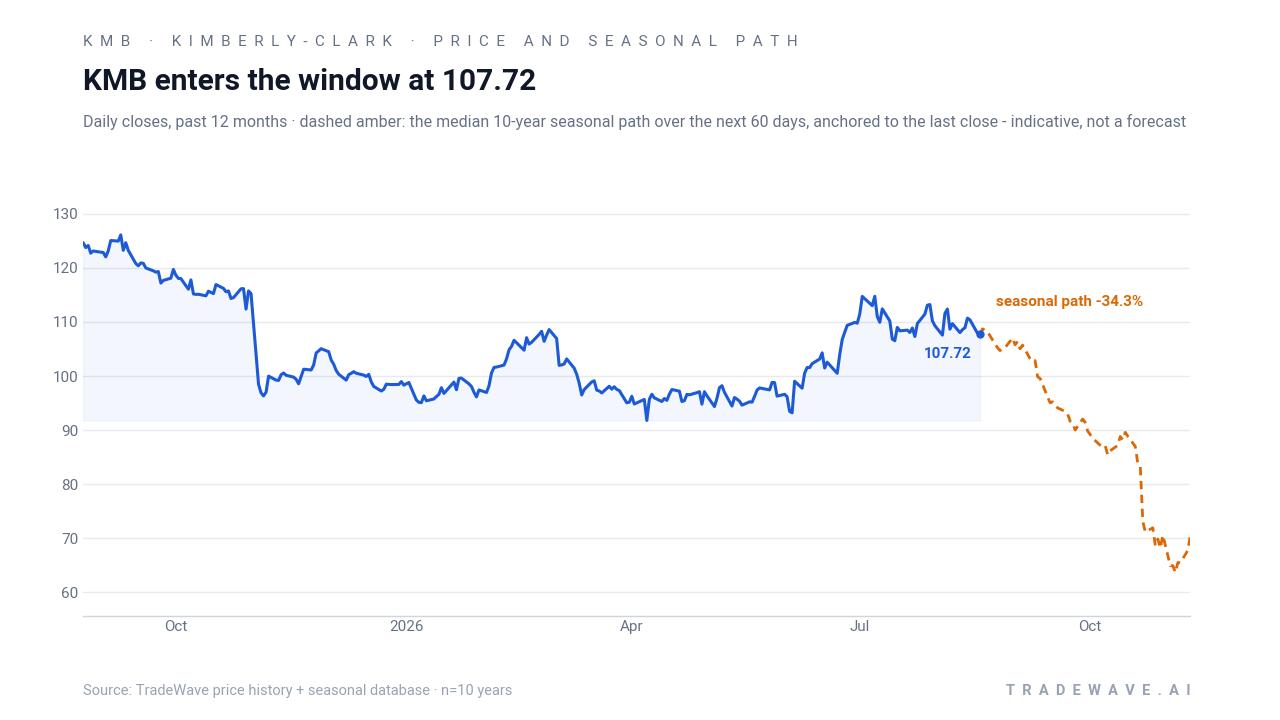
The chart below situates the latest move in its recent multi-month context and overlays the median 10-year seasonal path for the next 60 days.
Sources
- Yahoo Finance - Kimberly-Clark Corporation (KMB) Stock Price, News, Quote & History - Yahoo Finance
- Yahoo Finance (article) - Jim Cramer Said Kimberly-Clark Corporation (NYSE:KMB) + Kenvue Could Take On P&G – But Is He Right?
- Yahoo Finance (article) - Jim Cramer Says Kimberly-Clark’s Acquisition of Kenvue Creates a High-Margin Powerhouse
- ChartMill - KMB Technical Analysis Report
- MarketBeat - Cetera Investment Advisers Acquires 75,582 Shares of Kimberly-Clark Corporation $KMB
- MarketBeat - Assenagon Asset Management S.A. Sells 163,661 Shares of Kimberly-Clark Corporation $KMB
- MarketBeat - Weiss Asset Management LP Invests $33.05 Million in Kimberly-Clark Corporation $KMB
About this seasonal analysis
Seasonal pattern data is sourced from TradeWave.ai, which analyzes historical price behavior across annual calendar windows going back up to 30 years. Read the full data methodology or the book The 100-Year Pattern by Afshin Moshrefi (2026 edition). Past performance of seasonal patterns does not guarantee future results. This article is for informational purposes only and does not constitute investment advice.