M&T Bank (MTB) Faces 35-Day Midterm Stretch With Shorts Averaging 5.06% Profit
M&T Bank is heading into a late‑August to late‑September stretch that has usually meant downside for the stock, just as shares trade near record territory after a strong year-to-date run.
Price as of Aug 19, 2026: $244.55 (last close).
What is the seasonal pattern for M&T Bank (MTB)?
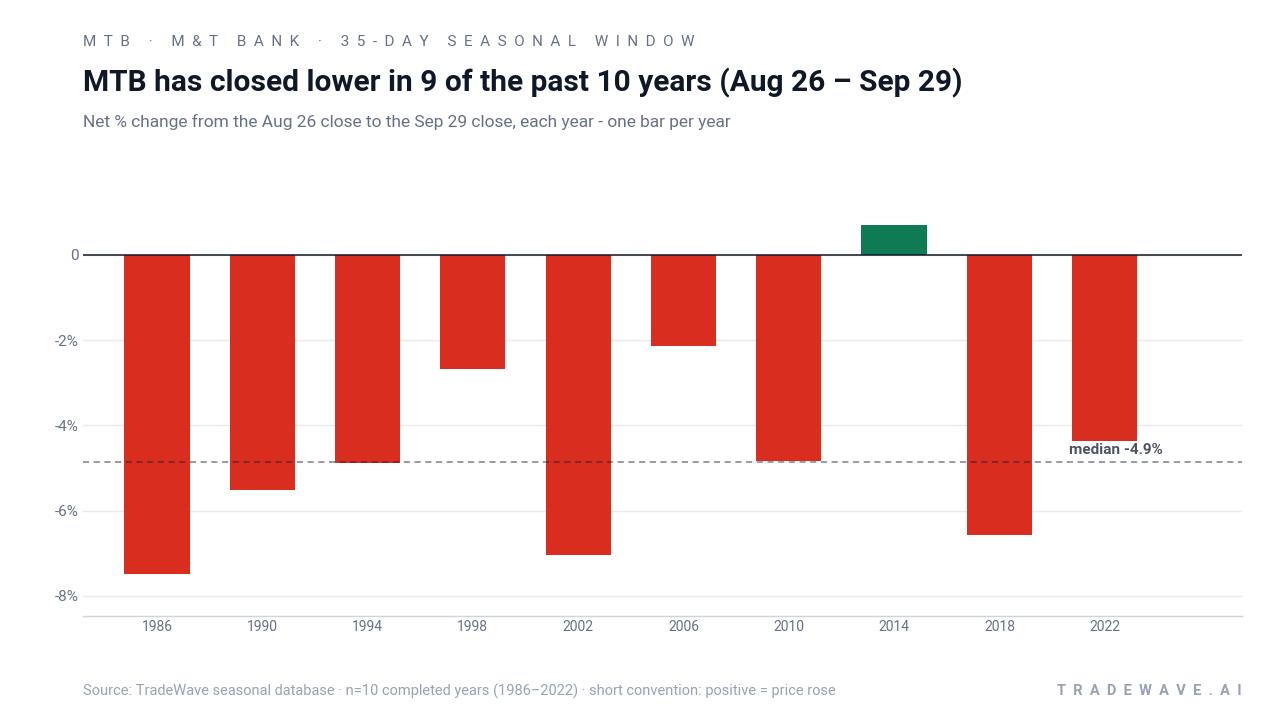
M&T Bank has fallen in 9 of 10 midterm‑year Aug 26–Sep 29 windows, with an average 5.06% gain in winning years for the short side.
- 9 for 10 in this window, with the short side averaging 5.06% profit in winning years across the last 10 midterm election cycles.
- Percent Profitable sits at 90%, with 9 winners and 1 loser for the short trade during the Aug 26–Sep 29 window.
- Including all years, the pattern shows a 4% average profit for shorts, compared with a median move of 4.86% in the trade direction.
- The setup is explicitly short, meaning years when MTB drifts lower or sells off have historically been the favorable outcomes for this pattern.
- Intraperiod swings have been meaningful, with some years showing deep adverse moves before finishing profitable for the short side.
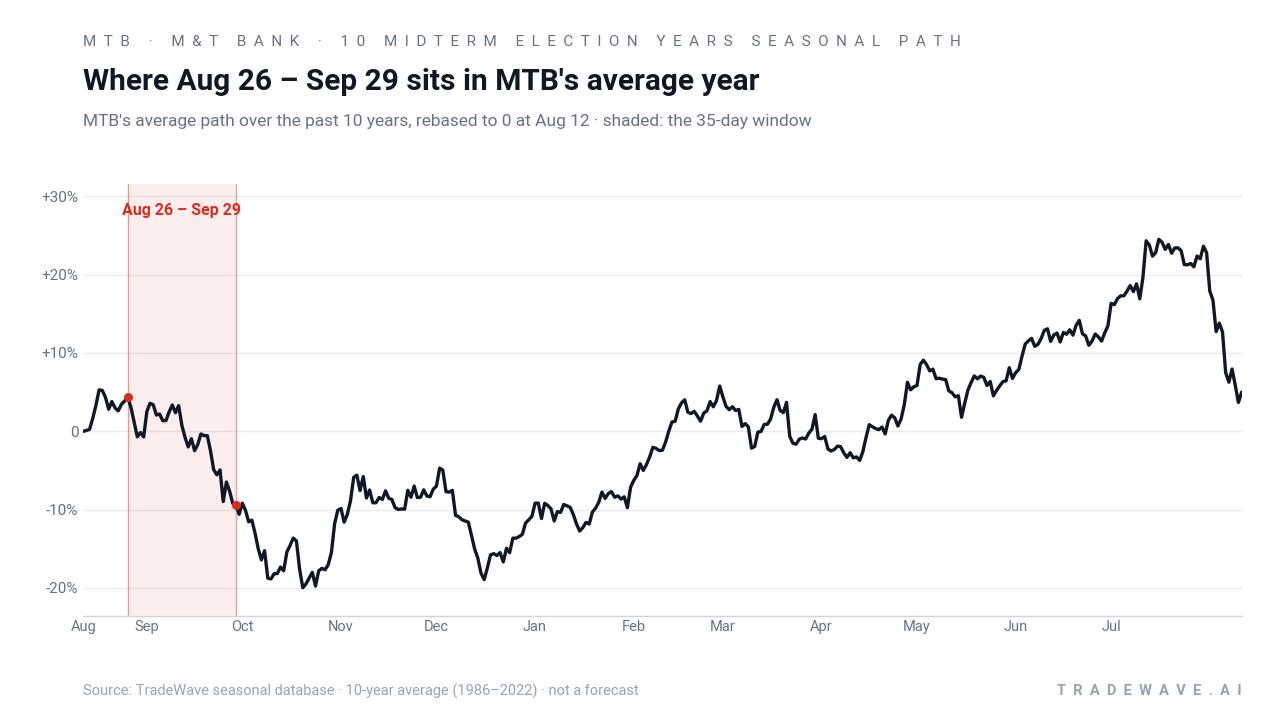
- The window opens Aug 26 and runs 35 days, lining up with the mid part of the midterm election year when policy and rate uncertainty often pick up.
According to historical data from TradeWave.ai, this late‑summer stretch for M&T Bank has behaved very differently from an average month on the calendar. The next section walks through what that election‑cycle pattern has looked like in prior midterm years.
How has M&T Bank (MTB) traded in the late‑August midterm-year window?
M&T Bank has closed lower in 9 of the last 10 midterm election years during the Aug 26 to Sep 29 window, with the short side averaging a 5.06% profit when it works. Shares finished Wednesday at 244.55, down 2.8% on the day and up 26.05% year to date, leaving the stock about 4.5% below its 52‑week high of 255.95.[1]
The pattern is grouped by the presidential election cycle, so it looks only at the last 10 midterm election years rather than consecutive calendar years. That matters because midterm years often feature shifting expectations around regulation, capital rules and the interest‑rate path, all of which hit regional banks like M&T directly.
For this 35‑day stretch, the trade direction is short. In other words, years when MTB has drifted lower or sold off have been the “good” years for the pattern, while sharp rallies have been the losing outcomes. Across those 10 midterm‑year samples, the short side has been profitable 90% of the time, with 9 winners and just 1 loser.
When the short has worked, it has worked meaningfully. Average profit in winning years is 5.06%, while including the lone losing year still leaves the all‑years average at 4%. The median move in the trade direction is 4.86%, which lines up with the idea that this is not just a couple of outliers driving the stats.
The per‑year table shows how that has played out in practice. In 1986, for example, the short trade would have captured a 7.48% gain as MTB slid over the window, even though the stock briefly moved 2.49% against the position before rolling over. By contrast, 2014 stands out as the one losing year, with the stock finishing the window up 0.69% despite an early 1.29% drawdown for shorts.
A second view stacks net results with the full intraperiod range, highlighting how far MTB has tended to swing inside the window.
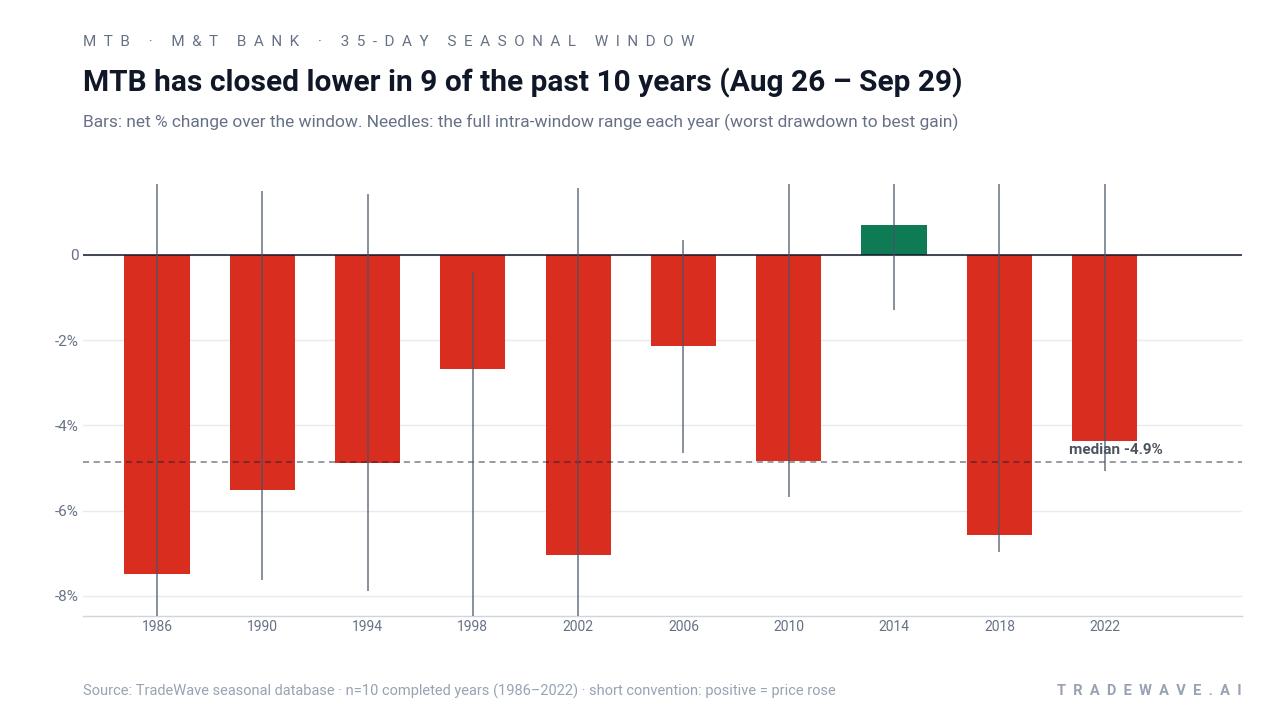
The maximum favorable move in several years has been large, with 2010 showing a 10.52% best intraperiod gain for shorts as the stock trended lower across the window. At the same time, adverse excursions have not been trivial: 1986 and 2002 both saw worst drawdowns for shorts in the mid‑teens before the trade finished profitable, underscoring that the path can be bumpy even when the final outcome lines up with the pattern.
The cumulative chart of this window compounds those yearly results into a 54% gain for the short side across the 10 midterm‑year samples. Add it up and this has been one of the more consistent bearish seasonal stretches for MTB in the election‑cycle framework, even though the broader midterm‑to‑pre‑election regime is often constructive for equities overall.
History does not guarantee future results, and intraperiod drawdowns can be large even in years when the window ultimately favors the short side.
Why does M&T Bank (MTB) follow this seasonal pattern?
One likely driver is the way midterm‑year policy and rate expectations tend to bunch up in late summer, just as investors reassess loan growth and credit quality for regional banks. Analysts have also pointed to portfolio rebalancing around the back‑to‑school period, when institutions trim winners and rotate within financials, which can pressure stocks that have already run hard. For a name like M&T that is tightly linked to the interest‑rate outlook, even small shifts in the macro narrative during this window can translate into outsized price swings.
What is driving M&T Bank (MTB) today?
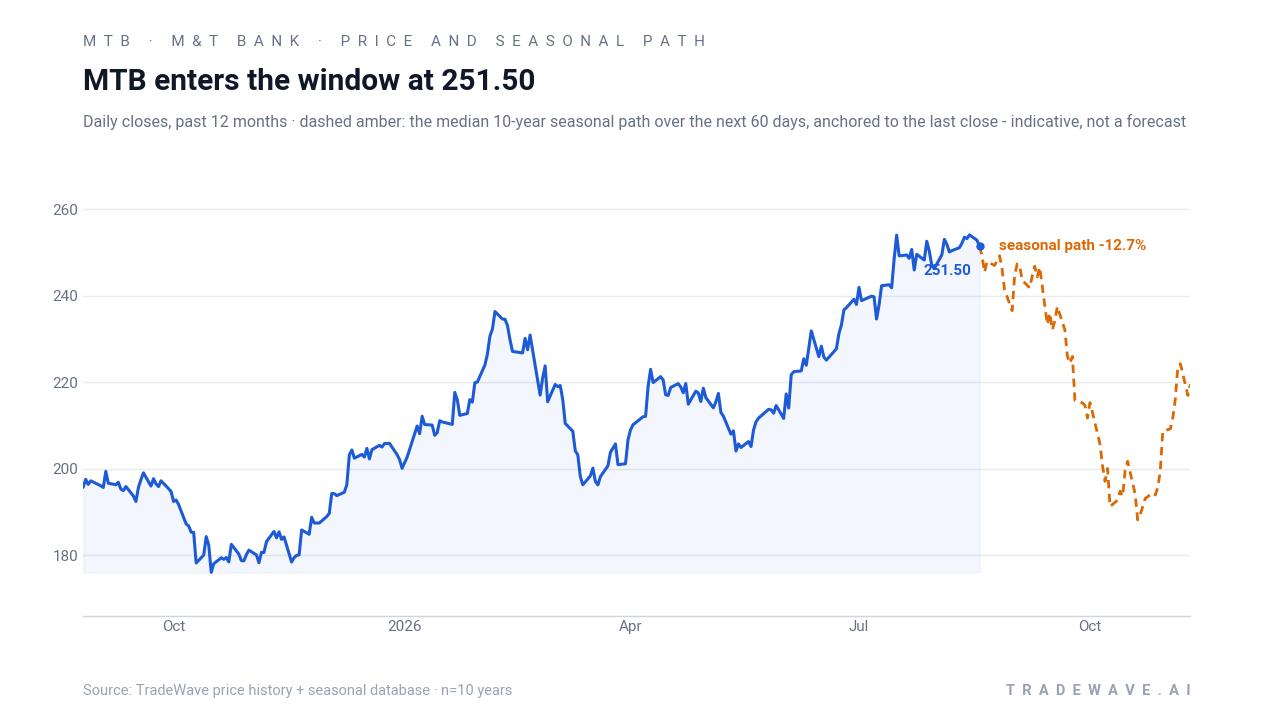
M&T Bank slipped 2.8% in the latest session to 244.55, pulling back from a recent 52‑week high of 255.95 but still up 26.05% so far in 2026.[1] The stock has been one of the stronger regional banks this year as higher interest income and solid loan performance helped deliver record earnings per share in the second quarter, with revenue reported between about $2.48 billion and $2.53 billion and EPS of $5.35.[1][2][10]
The interest‑rate backdrop has been a clear tailwind. Recent coverage has tied M&T’s improved profitability to the lending environment and wider net interest margins, even as investors watch for any signs that credit costs could rise from unusually low levels.[5][6] Valuation work published in mid‑August framed the stock as trading at a discount to some estimates of fair value, with return on equity assumptions and capital deployment plans in focus for long‑only holders.[6]
On the positioning side, broker surveys compiled in late July show an average “Hold” rating on MTB, with a consensus price target around 251.34 from providers such as ChartMill, Yahoo Finance and MarketBeat, only modestly above where the stock trades today.[1][3][9] That muted stance reflects a market that recognizes the earnings strength but is also mindful of how much of the rate‑driven upside may already be in the price.
There has also been some insider‑related activity to digest. A July 26 filing flagged share sales by Entropy Technologies LP, a holder of M&T Bank stock, which some investors read as a signal that at least one sophisticated owner was taking profits after the rally.[8] While the size of that sale is small relative to M&T’s market value, it adds a note of caution as the stock approaches a historically weak seasonal stretch.
The chart below situates the latest pullback against MTB’s strong 12‑month climb and the indicative seasonal projection for the next two months.
What should traders watch as this seasonal window opens?
First, the calendar. The 35‑day window begins on Aug 26 and runs through Sep 29, squarely in the mid part of the midterm election year when policy headlines and rate expectations can shift quickly. Any surprise on regulation, capital rules or the path of short‑term rates could amplify the historical tendency for MTB to soften in this slice of the calendar.
Second, price levels. With the stock only about 4.5% below its 52‑week high, traders will be watching whether pullbacks toward the 50‑day moving average around 242 act as support or give way to deeper selling.[1] A pattern of lower highs and heavier volume on down days inside the window would rhyme with the historical short‑side bias, while a decisive breakout to new highs would look more like the lone losing year in the sample.
Third, earnings follow‑through. The market has rewarded M&T for its record EPS and resilient loan book, but the next few weeks will test whether that enthusiasm can survive any cooling in the macro data or renewed concerns about credit quality.[1][2][10] Watch management commentary at conferences and any mid‑quarter updates for hints on deposit trends, loan demand and margin compression as funding costs evolve.
Finally, positioning and insider signals. The July share sale by Entropy Technologies LP is one early sign of profit‑taking after a strong run.[8] If additional filings show more insiders or large holders trimming stakes while the stock trades inside this historically weak window, that would reinforce the idea that some investors are using late summer to lock in gains rather than press for more upside.
Sources
- Yahoo Finance (US) - M&T Bank Corporation (MTB) Stock Price, News, Quote & History - Yahoo Finance
- Yahoo Finance (Canada) - M&T Bank Corporation (MTB) Stock Price, News, Quote & History - Yahoo Finance (CA)
- ChartMill - MTB Stock Price, Quote & Chart | ChartMill
- Yahoo Finance - News - M&T Bank Corporation (MTB) Latest Stock News & Headlines - Yahoo Finance
- Morningstar - MTB Stock Price Quote | Morningstar
- Simply Wall St via Yahoo - M&T Bank (MTB) Stock Trades At A Discount To Fair Value As Earnings Look Fair
- Yahoo Finance - Article (StockStory) - 5 Revealing Analyst Questions From M&T Bank’s Q1 Earnings Call
- MarketBeat - M&T Bank Corporation $MTB Shares Sold by Entropy Technologies LP
- MarketBeat - M&T Bank Corporation (NYSE:MTB) Receives Average Rating of "Hold" from Brokerages
- MarketBeat - M&T Bank (NYSE:MTB) Hits New 52-Week High - Time to Buy?
- Public.com (bond listing) - Buy M&T Bank Corporation Bond - 10/30/2029 at 4.80% - Public.com
About this seasonal analysis
Seasonal pattern data is sourced from TradeWave.ai, which analyzes historical price behavior across annual calendar windows going back up to 30 years. Read the full data methodology or the book The 100-Year Pattern by Afshin Moshrefi (2026 edition). Past performance of seasonal patterns does not guarantee future results. This article is for informational purposes only and does not constitute investment advice.