10-for-10: Johnson & Johnson (JNJ) Has Rallied in Every 57-Day Midterm Fall Window
Johnson & Johnson is pushing toward record highs just weeks before a 57-day midterm-year fall window that has never produced a losing season in the past decade of cycles.
Price as of Aug 18, 2026: $271.11 (last close).

What is the seasonal pattern for Johnson & Johnson (JNJ)?
Johnson & Johnson has risen in 10 of 10 midterm-year fall windows from Sep 9 to Nov 4, with an average gain of 5.29% in winning years.
- 10 for 10 in this window, averaging 5.29% gains in winning years across the last 10 midterm election cycles.
- Seasonal window runs from Sep 9 through Nov 4, spanning 57 calendar days in the midterm election year.
- Percent Profitable is 100%, with 10 winners and 0 losers over the historical sample.
- Annualized return for the window is 5.28%, with a cumulative gain of 67% when stacking all 10 years.
- TradeWave Ratio of 2.28 suggests price typically travels meaningfully in the long direction within the window.
- Sharpe ratio of 2.72 points to a historically strong risk-adjusted profile for this specific JNJ seasonal trend.
According to historical data from TradeWave.ai, this midterm-year autumn stretch has behaved very differently from an average month on the calendar for Johnson & Johnson, and the next iteration is about to open again.
How has Johnson & Johnson (JNJ) traded in the upcoming Sep 9 to Nov 4 window?
Johnson & Johnson has closed higher in every single Sep 9 to Nov 4 midterm-year window across the last 10 cycles, averaging a 5.29% gain for long positions. Shares finished Wednesday at $271.11, up 3.33% on the day and sitting about 1.4% below their 52-week high of $274.89. Traders also snapped up 34,603 call contracts, roughly 29% above typical call volume, a bullish options surge that suggests some investors are already positioning for more upside into the fall.[6]
The presidential election cycle matters here because this pattern only looks at the last 10 midterm election years, a phase that often brings policy noise, drug-pricing headlines and portfolio reshuffles into defensive healthcare names. Pattern phase and calendar phase are aligned: the market is in a midterm election year, and this 57-day window sits in the late part of that year, just ahead of the transition into the historically stronger pre-election year environment.
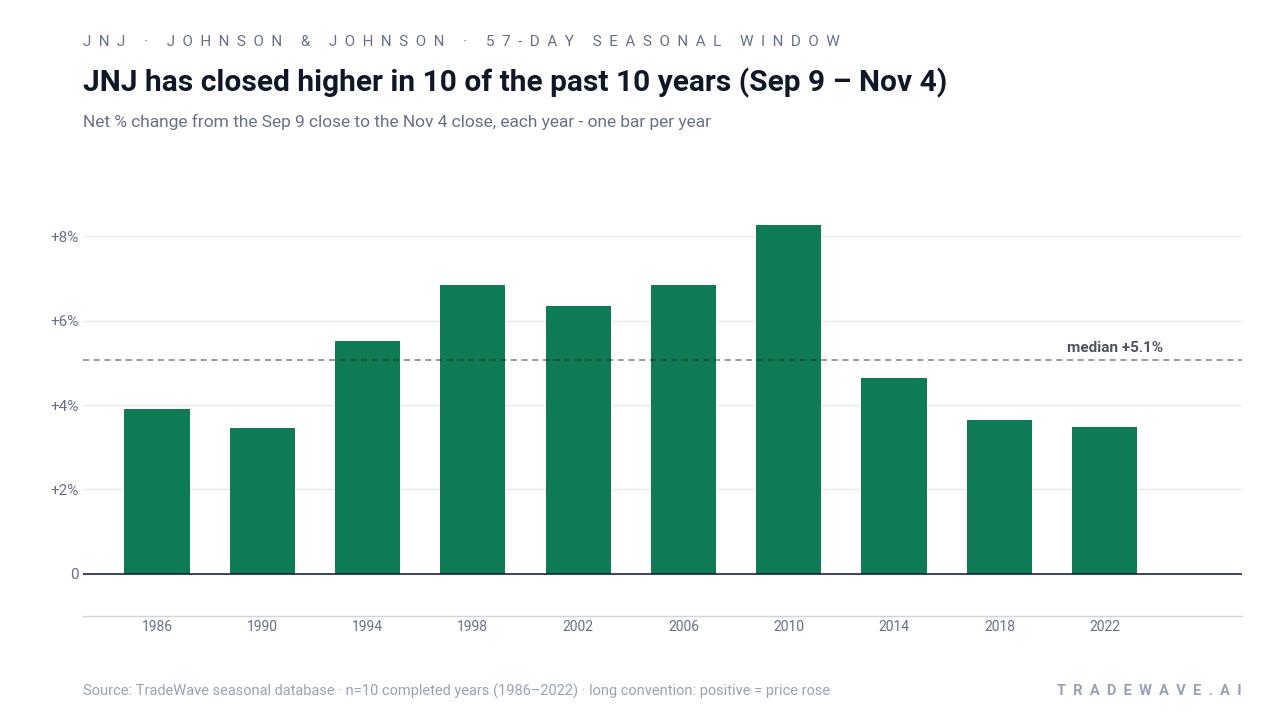
Historically, this window has been a clean long setup for Johnson & Johnson. Percent Profitable is 100%, with 10 winners and 0 losers, and the average gain across those winning years is 5.29%. The median outcome is close, at 5.07%, which tells you the distribution has been tight rather than driven by one outlier year. Annualized, the window translates to a 5.28% return, and stacking all 10 midterm-year windows compounds to a 67% cumulative gain.
The per-year table shows how consistent that behavior has been. The weakest year in the sample was 1990, when the stock still gained 3.45% from entry to exit. The strongest was 2010, with an 8.26% net return over the 57 days. Even in 1986, 1994 and 2018, which were not blockbuster years for the broader market, JNJ still posted gains between roughly 3.6% and 5.5% inside this specific window.
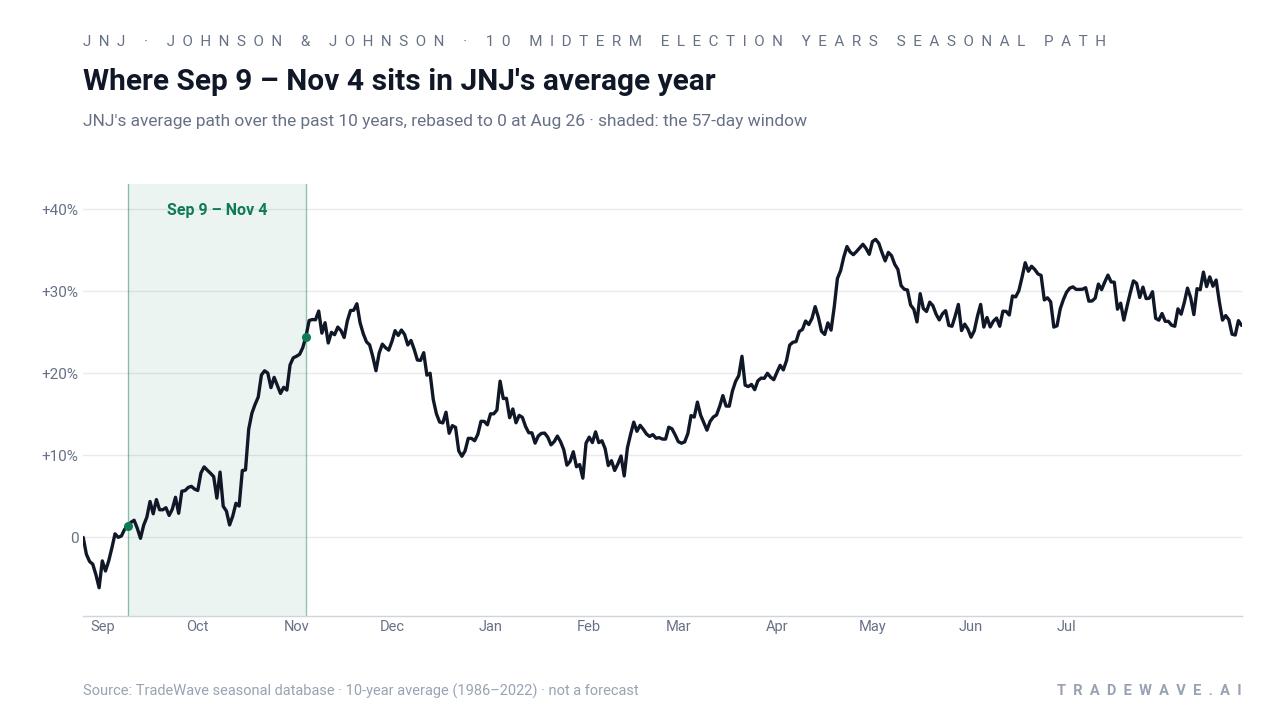
The historical seasonal average chart shows JNJ’s typical year grinding sideways through late summer before tilting higher into this early autumn stretch. The shaded 57-day window captures most of that upswing, with the average path rising steadily rather than spiking in a single burst. That shape suggests the gains have tended to accrue over the full window, not just around one event day.
The next chart layers in both the best rallies and the worst drawdowns that have occurred inside each of those 10 windows.
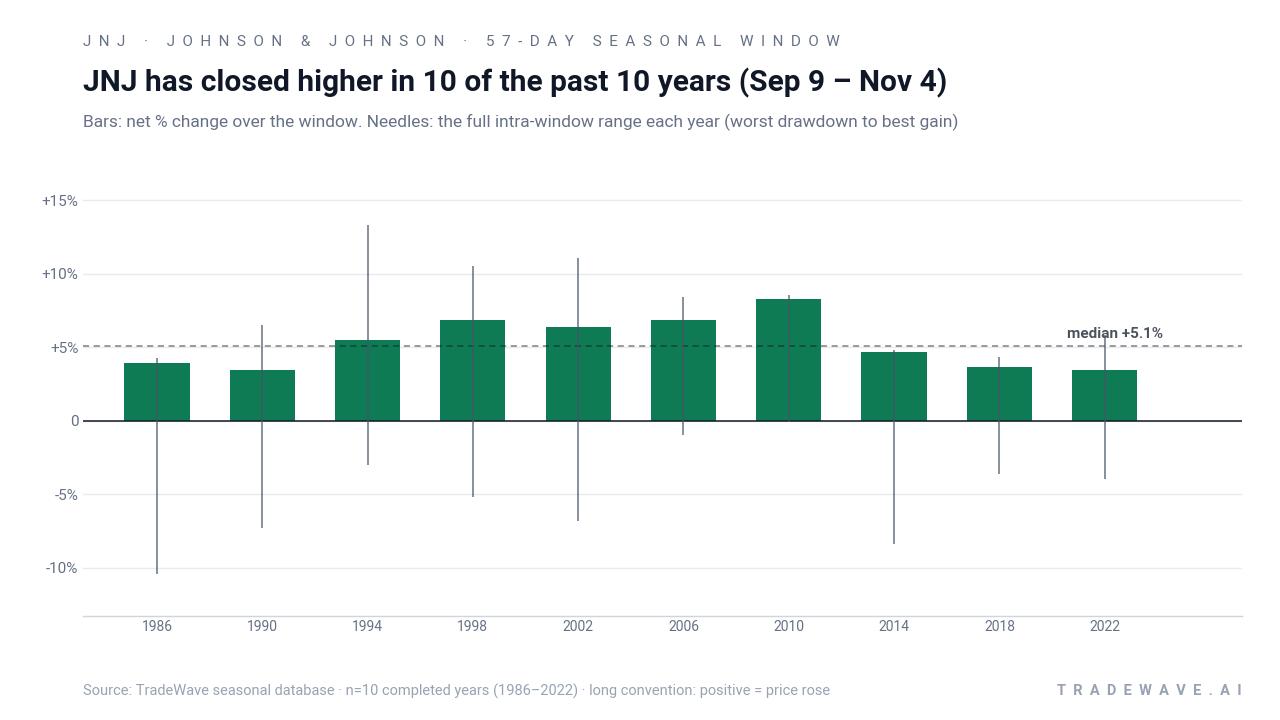
The bars-and-needles view makes clear that this has been a positive but not risk-free stretch. Maximum favorable moves inside the window have often run into the high single digits or low double digits, while maximum adverse moves have ranged from shallow dips of less than 1% to drawdowns of more than 10% in years like 1986. In plain English, the stock has usually finished the window higher, but it has not always been a straight line up.
History does not guarantee future results; adverse excursions (MAE) can be large even in winning windows.
Why does Johnson & Johnson (JNJ) follow this seasonal pattern?
One likely driver is the way the healthcare policy calendar and earnings season cluster in the back half of midterm election years. Analysts have pointed to portfolio rotation into defensive, dividend-paying healthcare names as investors navigate campaign rhetoric and shifting expectations for regulation and reimbursement.[5] This window also captures Q3 reporting and guidance updates, when Johnson & Johnson’s pharmaceuticals and MedTech franchises often reset expectations heading into the pre-election year, a phase that has historically been friendlier to risk assets.
What is driving Johnson & Johnson (JNJ) today?
Johnson & Johnson closed at $271.11 on Wednesday, up 3.33% on the session and trading about 1.4% below its 52-week high of $274.89, with volume of roughly 7.8 million shares versus a 20-day average near 6.1 million. The move extends a one-month gain of 5.45% and comes after a strong second-quarter report on Jul 15 that delivered $25.31 billion in revenue and adjusted EPS of $2.90, both ahead of Wall Street estimates, alongside higher full-year EPS guidance in the $11.60 to $11.75 range.[2][5] That beat-and-raise quarter helped cement a broader rotation into defensive healthcare, with investors leaning into large-cap names like JNJ as growth stocks cooled.[5]
Options and flow data show that enthusiasm spilling into derivatives. On Aug 19, MarketBeat flagged 34,603 JNJ call contracts trading, about 29% above typical call volume, alongside intraday commentary about elevated stock volume as shares pushed toward $271.[6] At the same time, MarketBeat has highlighted a string of insider sales over the past six months, including an EVP sale of roughly $3.95 million, with 21 open-market sales and no reported insider purchases, a reminder that corporate insiders have been taking some chips off the table into strength.[7] Consensus on the name remains constructive, with MarketBeat’s aggregation showing a “Moderate Buy” rating and a consensus price target of $268.22, a figure that now sits slightly below the latest close after the recent rally and likely reflects estimates set before the latest breakout.[3]
The chart below situates the latest move against the past year of trading and the indicative 60-day seasonal projection.
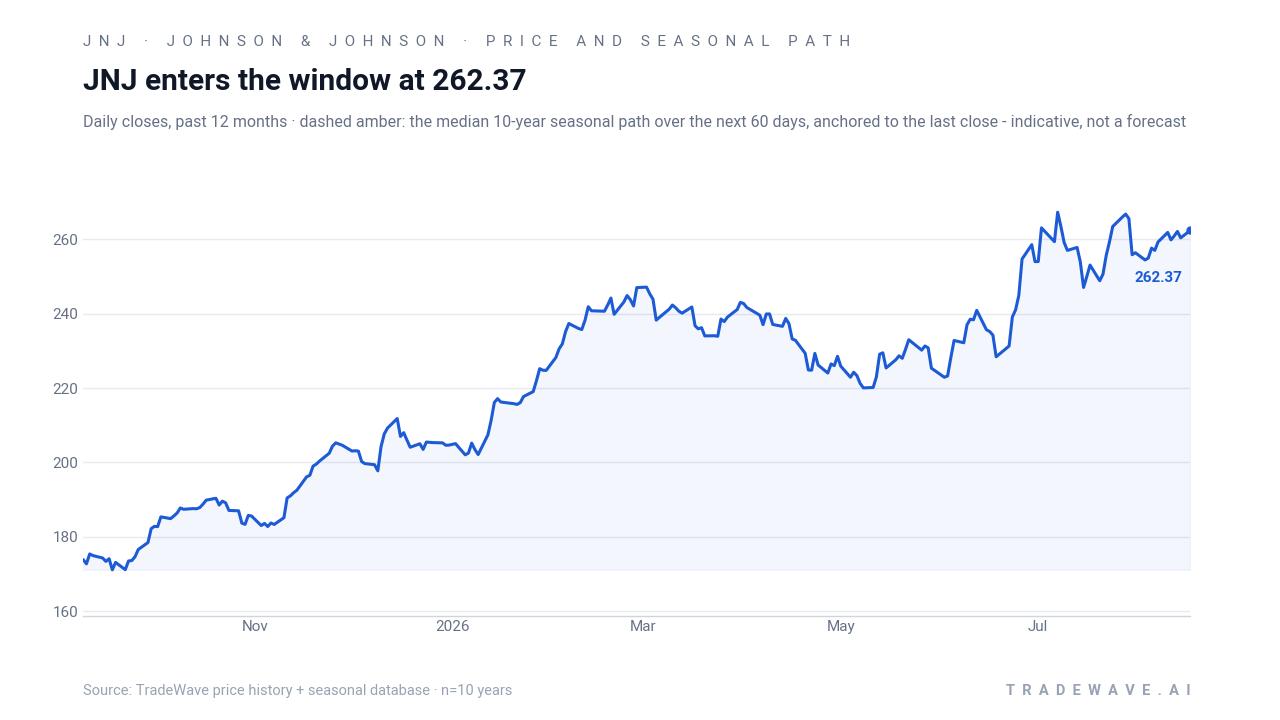
From a sector standpoint, JNJ is riding two overlapping stories. First is the macro rotation into healthcare as investors seek earnings stability and dividends in a late-cycle, midterm-year environment.[5] Second is the company’s own growth narrative, with immunology and neuroscience flagged as new engines and progress in robotic surgery bolstering the MedTech outlook.[6] Put together, those themes help explain why JNJ is pressing toward fresh highs just as it approaches a historical seasonal window that has repeatedly rewarded long exposure.
What should traders watch as this JNJ seasonal window approaches?
Three things stand out as the Sep 9 start date approaches. First, price levels: traders will be watching whether JNJ can decisively clear the $274.89 52-week high and hold above the recent breakout zone around the prior close of $262.37 as the window opens. A firm base above that band would rhyme with prior midterm-year patterns where the stock entered the window from a position of strength and then added mid-single-digit gains on top.
Second, the options tape. The recent 29% jump in call volume, with 34,603 contracts trading, is a clear sign that some investors are leaning into upside.[6] If that call-heavy flow persists or builds as Sep 9 nears, it would suggest the seasonal story is bleeding into positioning. If, instead, options activity normalizes or flips toward puts while insiders continue to sell into strength, that would signal a more cautious stance and could set up a choppier path even inside a historically strong window.[6][7]
Third, the policy and earnings calendar. The back half of a midterm election year often brings louder debate over drug pricing, Medicare reimbursement and healthcare regulation, all of which can swing sentiment for a diversified healthcare giant like JNJ.[5] Any guidance updates around its pharmaceuticals and MedTech franchises, especially on immunology, neuroscience or robotic surgery, will be read against the backdrop of a historical pattern that has favored longs in this exact stretch.[2][6] If the stock can absorb those headlines while respecting its seasonal tendency to grind higher, it will reinforce the idea that this 57-day window remains one of the more reliable bullish pockets in JNJ’s trading year.
Sources
- Yahoo Finance - Johnson & Johnson (JNJ) Analyst Ratings, Estimates & Forecasts - Yahoo Finance
- MarketBeat (instant alert) - Sterling Investment Management LLC Has $369000 Stake ...
- MarketBeat - JNJ Stock: Trend Signal After Earnings Pullback
- Seeking Alpha - Johnson & Johnson (JNJ) Stock Competitors & Similar Stocks Comparison | Seeking Alpha
- Yahoo Finance / GuruFocus (syndicated) - Johnson & Johnson Stock Jumps 3% as Healthcare ...
- MarketBeat (instant alert) - Johnson & Johnson Sees Unusually Large Options Volume (NYSE:JNJ)
- MarketBeat (instant alert) - Insider Selling: Johnson & Johnson (NYSE:JNJ) EVP Sells $3,950,400.00 in Stock
About this seasonal analysis
Seasonal pattern data is sourced from TradeWave.ai, which analyzes historical price behavior across annual calendar windows going back up to 30 years. Read the full data methodology or the book The 100-Year Pattern by Afshin Moshrefi (2026 edition). Past performance of seasonal patterns does not guarantee future results. This article is for informational purposes only and does not constitute investment advice.