IBM Rebounds From Post-Earnings Slide Ahead of August Milestone
IBM is rebounding from a post-earnings slide just as it approaches an Aug 1–Feb 18 seasonal window that has historically delivered strong gains and sizable swings.
Price as of Jul 28, 2026: $227.55 (last close).

What is the seasonal pattern for IBM (IBM)?
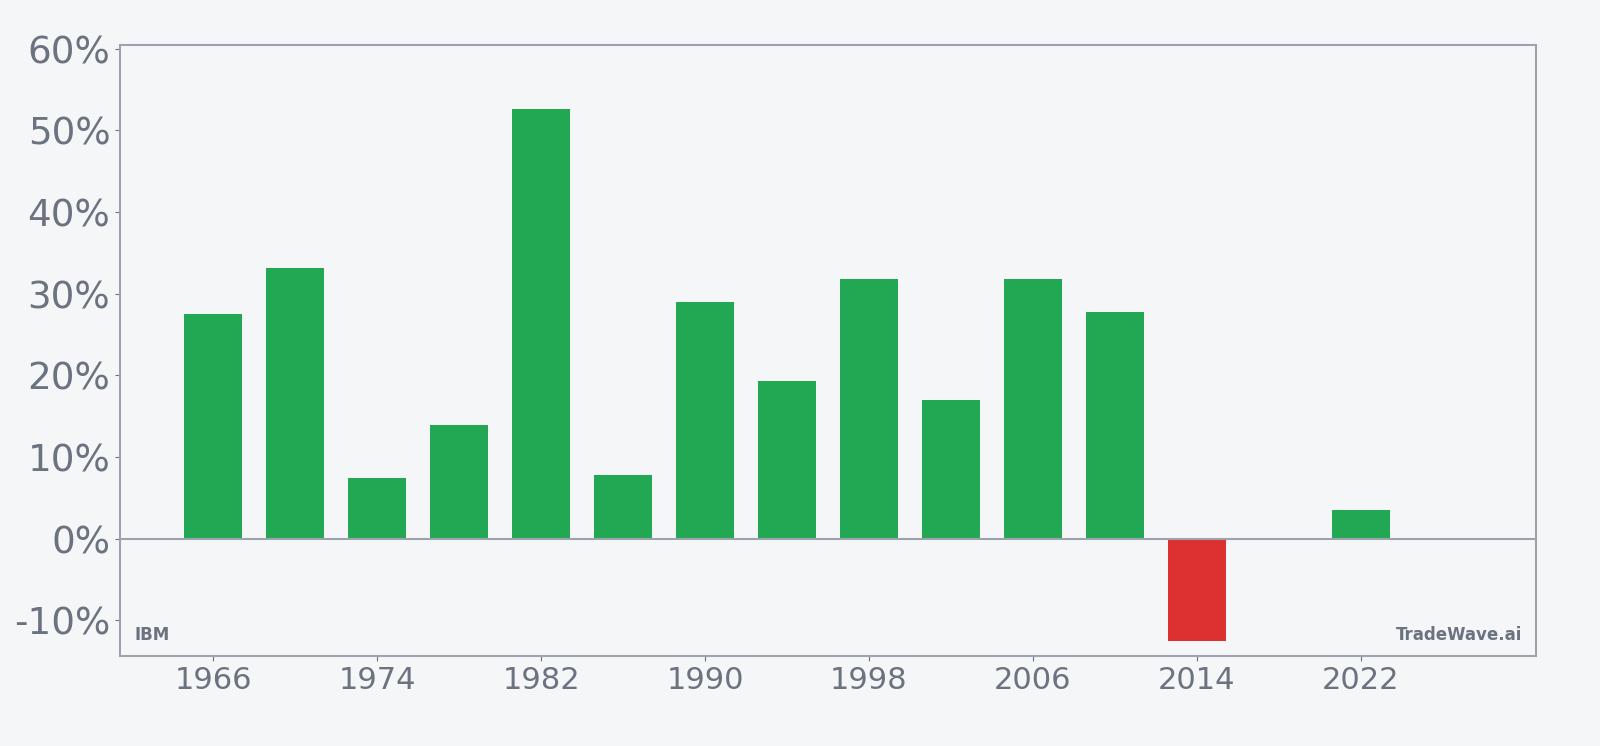
IBM has risen in 14 of 15 years during this Aug 1 to Feb 18 midterm-year window, with an average gain of 21.62% in winning years.
- 14 for 15 in this window, averaging 21.62% gains in winning years across the last 15 midterm election years.
- The Aug 1–Feb 18 IBM trading window is long-biased, with 93% Percent Profitable, 14 winners and just 1 loser.
- Including all years, the window’s Avg Profit - All is 19%, reflecting one down year that lost 12.55%.
- Individual losing or flat years have still seen deep intraperiod drawdowns, with worst-year declines inside the window reaching nearly 25% from entry.
- The pattern sits in the midterm election year phase, a part of the presidential cycle that often precedes stronger pre-election-year risk appetite.
- Trade Direction is long, with a TradeWave Ratio of 1.61 and a Sharpe ratio of 1.04, pointing to historically favorable but volatile upside.
According to historical data from TradeWave.ai, this midterm-year stretch has behaved very differently from an average six-month span for IBM, with a clear long-side bias that traders often overlook.
How strong is IBM (IBM)’s Aug–Feb seasonal window in midterm years?
IBM has closed higher in 14 of the past 15 midterm election years during the Aug 1 to Feb 18 window, averaging 21.62% gains in winning years. Shares finished Tuesday at 227.55, up 5.2% on the day and about 31.6% below their 52-week high of 332.46, after a sharp post-earnings reset.[4] That combination of a bruising drawdown and a historically powerful seasonal tailwind gives this upcoming 202-day stretch unusual weight for investors trying to time entries in a volatile AI and infrastructure cycle.
Grouping the data by presidential election cycle matters here because this window captures the back half of the midterm election year, a phase that often sees policy uncertainty peak before risk appetite improves into the year before the presidential election. For a mature tech and infrastructure name like IBM, that has historically meant investors start looking past near-term earnings noise and toward multi-year spending plans as Washington’s policy path becomes clearer.
Across the 15 midterm election years in the sample, IBM’s Aug–Feb window has a 93% win rate, with 14 winners and just 1 loser. The average gain in winning years is 21.62%, while the all-years average, including the single losing year, is still a robust 19%. The lone down year, 2014, saw a 12.55% loss over the window, underscoring that even a strong IBM seasonal trend can misfire when company-specific issues dominate.
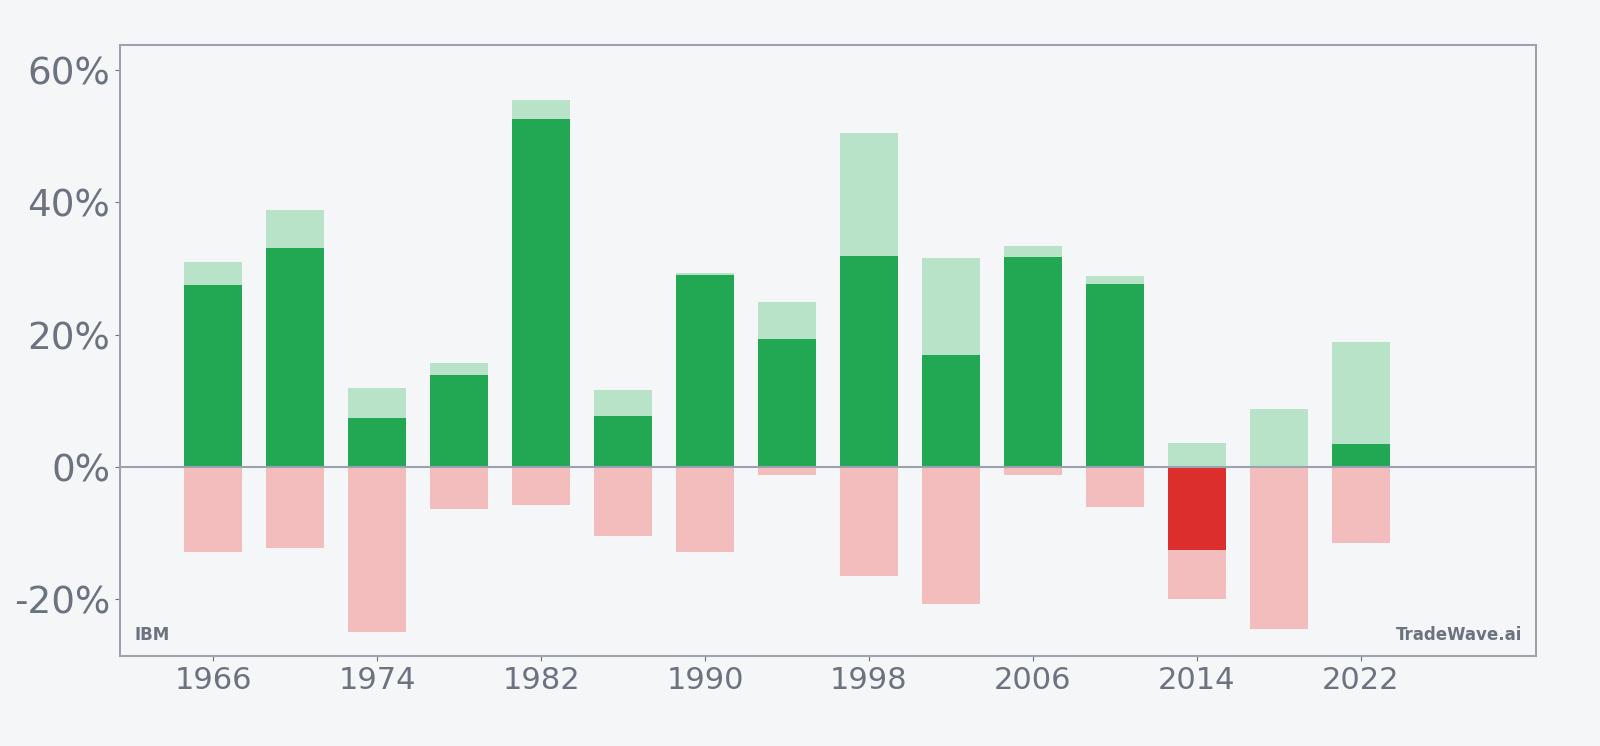
The per-year breakdown shows how wide the range of outcomes can be. In 1998, IBM gained 31.86% over the window, with a best intraperiod run-up of 50.57% from the entry price before giving some of it back by Feb 18. In 2010, the stock added 27.75% with a maximum favorable move of 28.85%, while the 2018 window finished essentially flat at 0.1% despite an 8.73% peak rally and a 24.43% worst drawdown from entry. That mix of strong closes and big swings is exactly what the TradeWave Ratio of 1.61 is flagging.
Looking at the intraperiod path, the maximum favorable excursion and maximum adverse excursion profiles show that IBM has often moved sharply in both directions before settling higher. In 2002, for example, the stock’s best point-to-peak gain inside the window reached 31.61%, but the worst drawdown from entry was 20.69% before the trade finished up 16.93%. In the losing 2014 window, the worst drawdown hit 19.94% and the best rally was only 3.7%, a classic case where the downside excursion dominated.
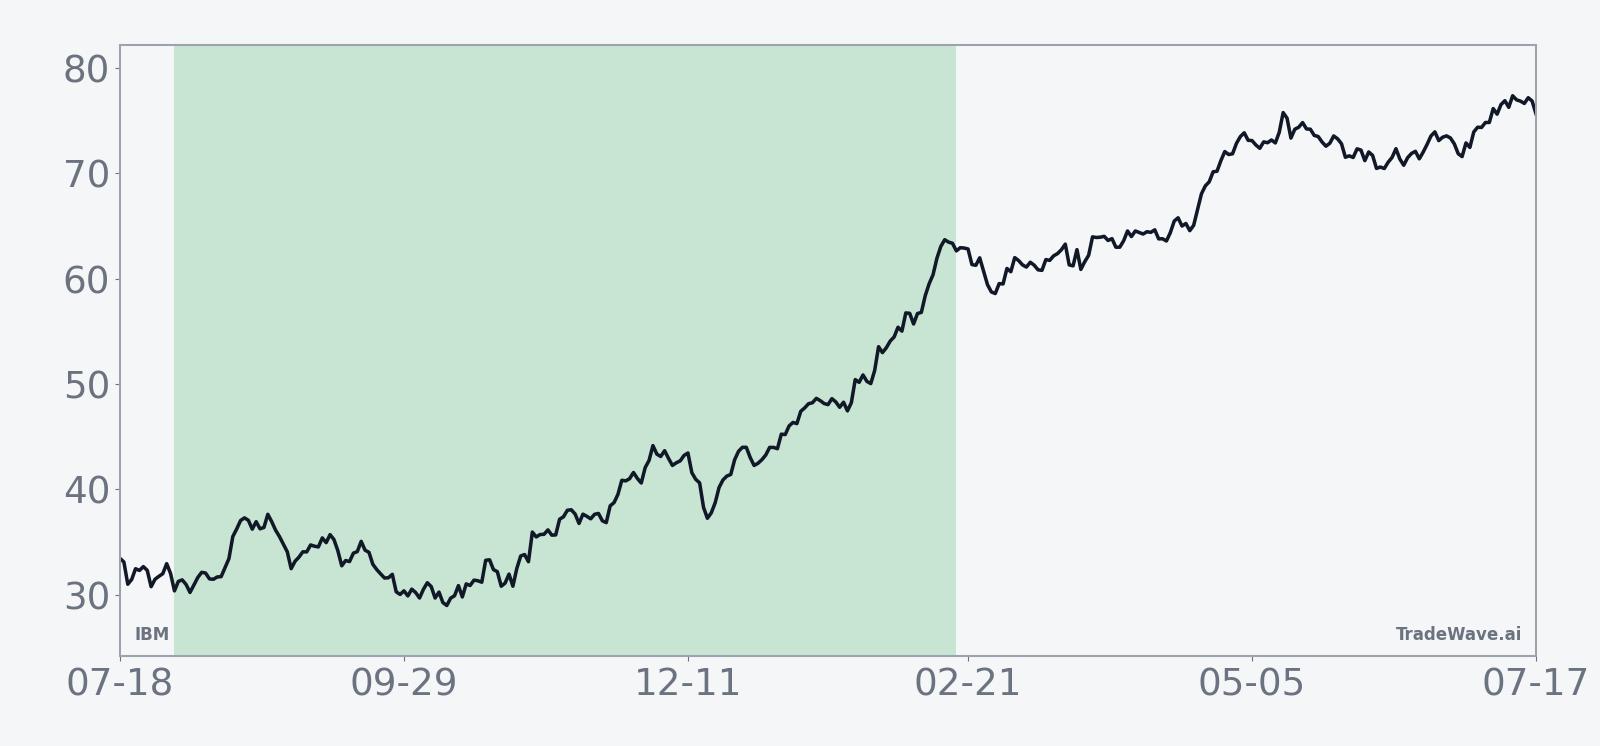
Yearly net and peak moves highlight upside persistence amid typical drawdowns.
The cumulative chart of this IBM trading window compounds to 1,138% across the 15 midterm election years, reflecting how repeatedly stacking a 202-day seasonal edge can add up over decades. Add it up: 14 winning windows, one modestly bad one, and a long-run annualized return of 18.26% for this slice of the calendar. History does not guarantee a repeat, but the consistency of this IBM seasonal pattern is hard to ignore.
History does not guarantee future results; adverse excursions (MAE) can be large even in winning windows.
Why does IBM (IBM) follow this seasonal pattern?
One likely driver is the way IBM’s earnings calendar and enterprise budget cycles line up with the political calendar. Large corporate and government clients often finalize next-year IT and AI infrastructure budgets in the back half of the midterm election year, once policy and tax paths look clearer, which can pull forward orders into the Aug–Feb stretch. Analysts have also pointed to institutional portfolio repositioning into more defensive, cash-generative tech names ahead of the year before the presidential election, a phase that has historically favored steady compounders like IBM.
What is driving IBM (IBM) today?
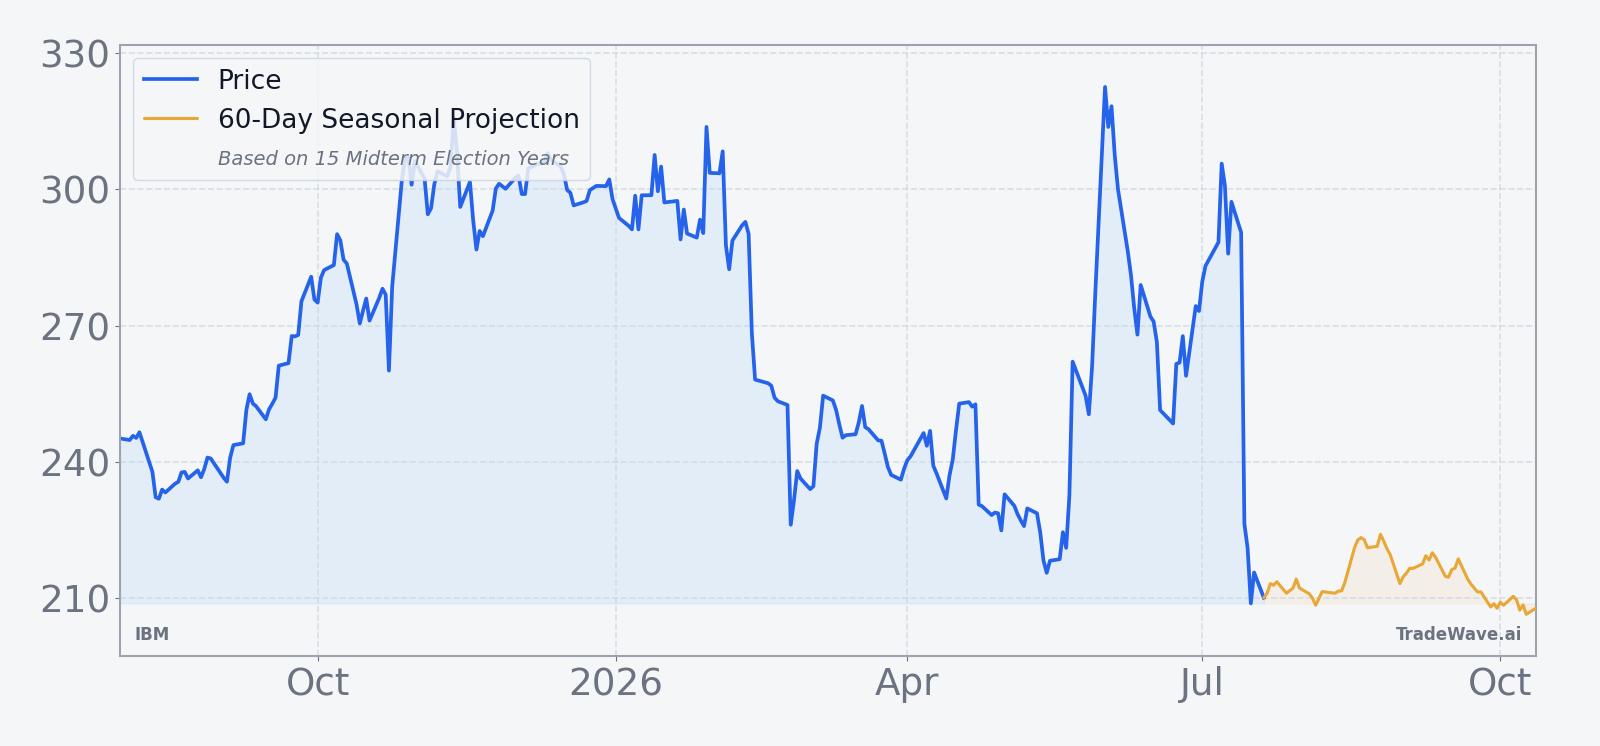
IBM’s stock has been volatile around its latest earnings, plunging after a July warning and then snapping back as investors reassessed the damage. The shares closed Tuesday at 227.55, up 11.27 points or 5.2% on the day, after trading between 215.11 and 228.98 on heavy volume, but they remain well below the 50-day moving average of 260.11 and roughly 31.6% under the 52-week high of 332.46.[4] That leaves IBM in a damaged but stabilizing posture heading into the historically strong Aug–Feb window.
The near-term story is still about earnings and guidance. On Jul 22, IBM cut its 2026 full-year constant currency revenue growth forecast to 4%–5%, down from “more than” 5%, blaming customers’ shift toward AI infrastructure spending that has deferred some larger software and services deals.[4] Management followed up on Jul 24 with Q2 results that showed roughly $17.2 billion in net sales and non-GAAP EPS of $2.93, modestly ahead of internal expectations but framed against a preannouncement that had already lowered the bar.[1] CEO Arvind Krishna acknowledged an execution shortfall and a 42% drop in mainframe revenue, but argued that IBM’s AI strategy and mainframe cycle should support a recovery as customers move from building AI infrastructure to deploying workloads.[3][7]
Options and stock trading activity has reflected that tension. On Jul 24, MarketBeat reported unusually high call option volume and elevated share turnover as traders positioned around the earnings fallout and rebound, highlighting how IBM has become a tactical AI and infrastructure proxy despite its legacy reputation.[10] Opinion pieces have been blunt, with one Jul 24 analysis calling IBM “the world’s worst big tech company” while pointing to the mainframe slump and lagging share performance, even as others note that the company’s software and consulting franchises still throw off significant cash.[6]
The chart below situates the latest move in its recent multi-month context alongside the median seasonal path for the next 60 days.
What should traders watch in this IBM (IBM) seasonal window?
First, the calendar. The 202-day window opens on Aug 1 and runs through Feb 18, spanning the back half of the midterm election year and the early weeks of the year before the presidential election. Historically, that has been a sweet spot for IBM, with 14 of 15 windows finishing higher and cumulative gains above 1,100% when the pattern is stacked over time.
Second, price levels. With the stock trading well below its 50-day moving average and far off the 52-week high, traders will be watching whether IBM can hold the post-earnings rebound and start building a base above the low-220s. A pattern-consistent move would see the stock avoid revisiting the July lows and instead grind higher into year-end, even if the path includes sharp pullbacks similar to the historical maximum adverse excursions.
Third, catalysts. Any updates on AI infrastructure demand, mainframe refresh timing, or large software and consulting deals will matter, especially if management can show that deferred spending from Q2 is converting into signed contracts.[1][3][4] Macro signals around enterprise IT budgets and government tech spending into the pre-election year will also shape how much of the historical IBM seasonal trend can realistically repeat this cycle.
Finally, positioning and liquidity. The elevated call option activity and heavy share turnover around the July earnings period suggest that short-term traders have rediscovered IBM as an AI-adjacent vehicle.[10] If that options and volume intensity persists into August and September, it could amplify the typical swings inside the window; if it fades, the seasonal pattern may play out in a quieter, more grind-like fashion. Either way, the historical record is clear: when this midterm-year window moves for IBM, it has usually moved a lot.
Sources
- Yahoo Finance: What IBM execs think will be different 90 days after a brutal warning (Jul 24, 2026)
- Yahoo Finance / Insider Monkey: Jim Cramer discussed a surprise for IBM CEO (Jul 26, 2026)
- Yahoo Finance: IBM CEO addresses earnings shortfall and historic stock plunge (Jul 24, 2026)
- Reuters: IBM cuts annual revenue growth forecast as customers prioritize AI infrastructure spending (Jul 22, 2026)
- MarketBeat: International Business Machines sees unusually large options volume (Feb 12, 2026)
- MarketBeat: Stock traders buy high volume of call options on IBM (Jul 24, 2026)
- 24/7 Wall St.: IBM is the world’s worst big tech company (Jul 24, 2026)
- Wall Street Journal: IBM lowers its growth outlook as sales of data-center mainframes sink 42% (Jul 22, 2026)
About this seasonal analysis
Seasonal pattern data is sourced from TradeWave.ai, which analyzes historical price behavior across annual calendar windows going back up to 30 years. Read the full data methodology or the book The 100-Year Pattern by Afshin Moshrefi (2026 edition). Past performance of seasonal patterns does not guarantee future results. This article is for informational purposes only and does not constitute investment advice.