Synopsys (SNPS) Has Rallied in 8 of 8 Midterm Windows, Averaging 28.67% Gains
Synopsys is stepping into a historically powerful 273-day trading window just after a fresh earnings beat and while the stock trades well below its 52-week high.
Price as of Aug 26, 2026: $410.00 (last close).

What is the seasonal pattern for Synopsys (SNPS)?
Synopsys has risen in 8 of 8 midterm-year Aug 27–May 26 windows, with an average gain of 28.67% in winning years.
- 8 for 8 in this window, with Synopsys averaging 28.67% gains across all winning years in the Aug 27–May 26 stretch.
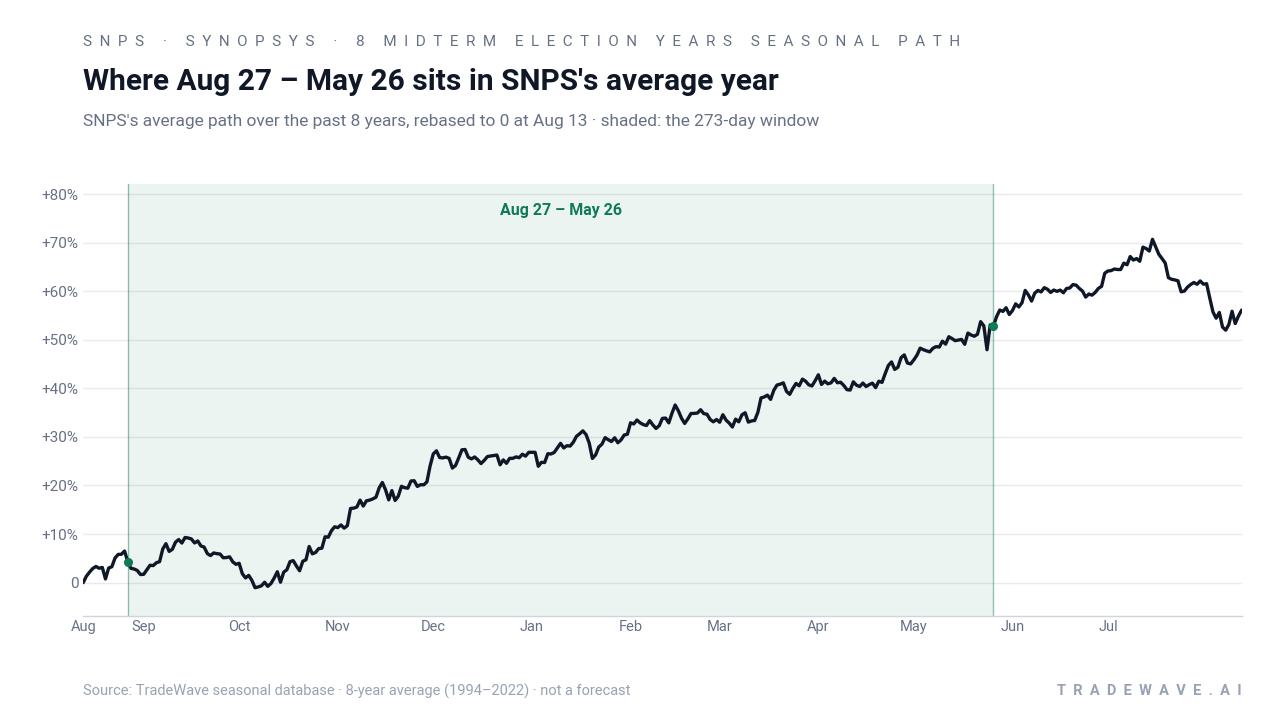
- The 273-day trading window begins Aug 27 and has been a strongly bullish SNPS seasonal trend in the last 8 midterm election years.
- Percent Profitable is 100%, with 8 winners and 0 losers across the historical sample.
- Annualized return for this Synopsys trading window clocks in at 28.3%, with a Sharpe ratio of 2.45 on end-of-window outcomes.
- The TradeWave Ratio of 1.44 signals that price has typically traveled meaningfully in the long direction within the window, not just at the close.
- Intraperiod swings have been sizable, with some years showing double-digit drawdowns before finishing higher, so volatility has been part of the ride.
According to historical data from TradeWave.ai, this is not just another strong tech chart but a recurring election-cycle pattern that has lined up with prior midterm years.
How has Synopsys (SNPS) traded in this midterm-year window?
Synopsys has rallied in 8 of the last 8 midterm election years during the Aug 27 to May 26 window, posting an average gain of 28.67% and a cumulative 634% across those cycles. Shares enter this year’s stretch around 410, up 13.0% year to date but still about 33.4% below the 52-week high near 615.79.[1] That combination of a strong historical seasonality and a stock trading well off its highs gives this window unusual weight for traders watching the semiconductor and AI software trade.
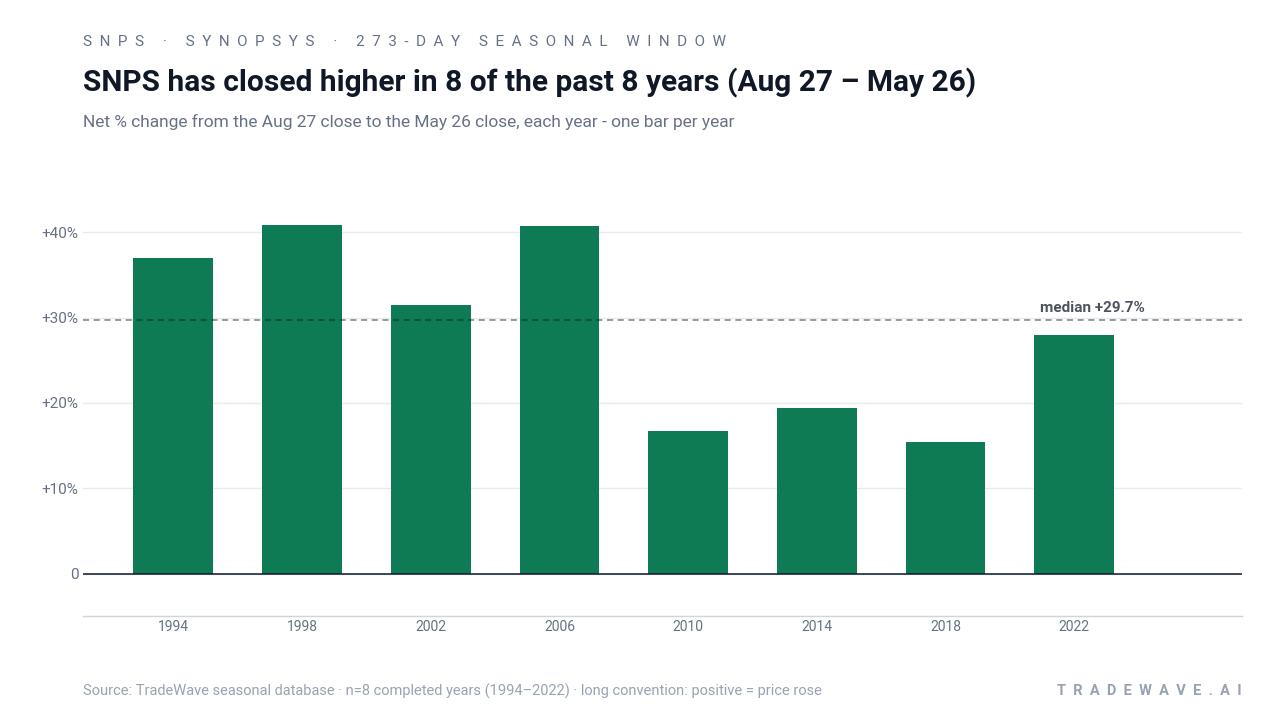
The pattern is grouped by the presidential election cycle, focusing on the last 8 midterm election years rather than consecutive calendar years. That matters because midterm years often feature policy uncertainty and tighter financial conditions early on, followed by a more supportive backdrop as Washington shifts toward the year before the presidential election, when fiscal and regulatory stances have historically been more market-friendly.
Across those 8 midterm-year samples, every single Aug 27–May 26 window has been profitable for a long Synopsys position. The strongest year in the sample was 1998, when the stock gained 40.79% over the window, while the softest was 2018, which still delivered a 15.42% rise from entry to exit. Add it up and stacking the window across cycles compounds to a 634% cumulative gain.
Intraperiod behavior has not been smooth. In 1998, Synopsys’s best point-to-peak move within the window reached 102.9%, while the worst drawdown from entry was 18.84%. In 2002, the stock ultimately finished up 31.42%, but not before a maximum adverse move of 28.61% from the starting level. Even in 2022, a year dominated by macro volatility, the stock’s worst drawdown inside the window was 23.16% before closing the stretch up 27.98%.
The maximum favorable excursions, or MFE, show that in strong years the stock has often pushed well beyond the final close at some point during the window. The maximum adverse excursions, or MAE, underline that those rallies have usually come with meaningful air pockets along the way. That mix of large MFE and sizable MAE is consistent with a high-variance but ultimately upward-sloping seasonal regime for a long trade.
A second view combines yearly net results with the full intraperiod range of gains and drawdowns.
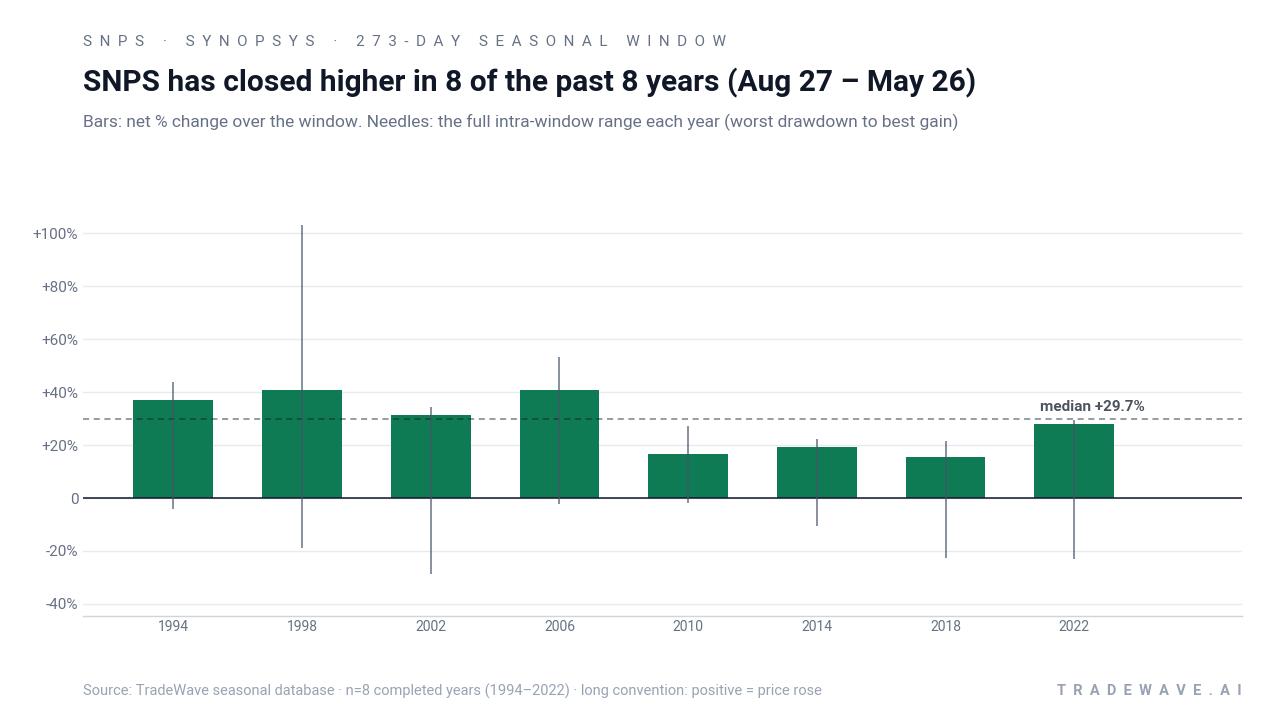
The chart makes the pattern plain: every bar is positive, but the needles are long. Historically, this has been a window where long exposure has paid off for Synopsys, yet the path has involved double-digit swings in both directions in several cycles. The key takeaway is simple: 8 for 8, with big moves both up and down inside the window.
History does not guarantee future results; adverse excursions can be large even in winning windows, and traders should size risk accordingly.
Why does Synopsys (SNPS) follow this seasonal pattern?
One likely driver is the way Synopsys’s earnings calendar clusters around this stretch, with multiple quarters and guidance updates landing between late August and late spring, often tied to semiconductor capex cycles.[7][12] Analysts have also pointed to AI-driven demand for design automation and IP tools, which tends to show up in multi-quarter booking waves that line up with this midterm-to-pre-election phase.[6] The pattern may also reflect institutional portfolio repositioning around the policy calendar, as investors lean into software and EDA names when Washington shifts from midterm uncertainty toward a more pro-growth stance ahead of the presidential election year.
What is driving Synopsys (SNPS) today?
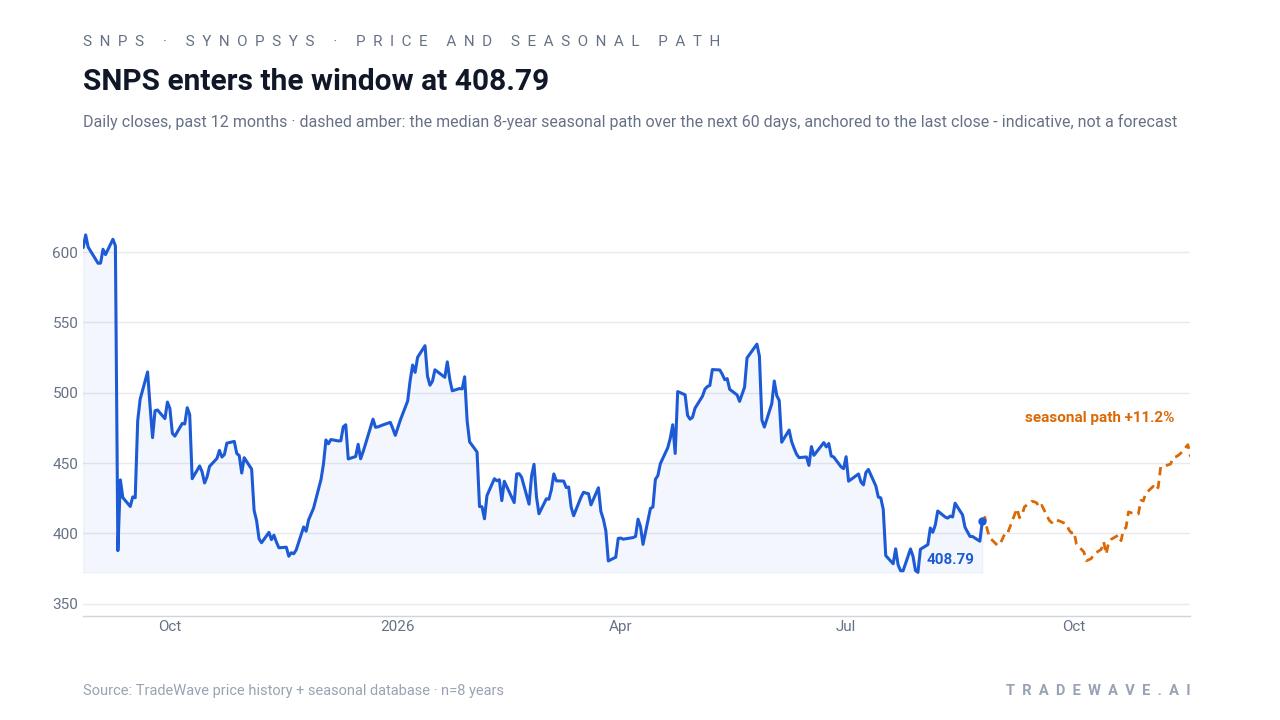
Synopsys closed around 410 on Thursday, up 0.3% on the day and roughly 13.0% higher year to date, leaving the stock about 33.4% below its 52-week high of 615.79.[1] The latest leg of the move comes after the company reported fiscal Q3 2026 earnings on Aug 26, posting EPS of $3.91 on revenue of $2.48 billion, both ahead of consensus estimates and extending a run of beats tied to AI-driven demand for its design tools and IP portfolio.[7][6] Management has reiterated full-year guidance that implies solid double-digit growth, even as some brokers, including Wells Fargo, have flagged a more cautious stance on valuation and the pace of spending in the broader chip ecosystem.[11]
On the positioning side, Synopsys remains a core holding for large institutions, and filings this week showed the Canada Pension Plan Investment Board disclosing a purchase of 600,117 shares, while Partners Capital Investment Group also reported a fresh stake.[10][13] Those flows arrive against a backdrop of insider selling over the past several months and a notable one-day volume spike earlier in the year, suggesting that while long-term holders are adding exposure, shorter-term traders have been active on both sides of the tape.[1][8] With the stock still well below its prior peak and the AI software theme intact, the tug-of-war between valuation worries and growth optimism is likely to define how Synopsys trades as this long seasonal window unfolds.[1][2][4]
The chart below shows how that push-pull has played out over the past year, alongside the median historical seasonal path for the next two months.
What should traders watch in this Synopsys seasonal window?
First, watch how Synopsys behaves around earnings follow-through in the next several weeks. Historically, strong midterm-year windows have often seen the stock build on post-earnings strength rather than fade it, especially when guidance stays intact or improves.[7][11][12] A sustained move back above the 50-day moving average near 418 and toward the low-400s consolidation band would be one sign that this cycle is tracking the bullish seasonal script rather than breaking it.[1]
Second, keep an eye on volatility inside the window, not just the direction. Prior cycles show that even winning years have featured drawdowns of 20% or more at some point between late August and late May, so sharp pullbacks would not be out of character for this pattern. How the stock trades on those dips, particularly around macro headlines and sector rotations in software and semis, will help confirm whether the historical SNPS seasonal trend is still in play.[1][6]
Third, monitor institutional flows and ownership updates. The recent purchases by large asset managers suggest that long-horizon investors are still willing to add exposure at current levels, but any reversal in that trend or a pickup in short interest would complicate the bullish seasonal backdrop.[9][10][13] If big buyers continue to step in on weakness while earnings and AI-related demand hold up, the historical pattern of strong midterm-year Synopsys trading windows will have a clearer runway to repeat.
Sources
- Yahoo Finance - Synopsys, Inc. (SNPS) Stock Price, News, Quote & History - Yahoo Finance
- Yahoo Finance - Synopsys, Inc. (SNPS) Analyst Ratings, Estimates & Forecasts - Yahoo Finance
- Yahoo Finance (Zacks content) - Synopsys (SNPS) Outpaces Stock Market Gains: What You Should Know
- Zacks - What is the current Price Target and Forecast for Synopsys (SNPS)
- Yahoo Finance (article) - Synopsys Stock: Analyst Estimates & Ratings
- Insider Monkey (via Yahoo Markets aggregation) - Citi’s Price Target On Synopsys (SNPS) Stock Still Carries Considerable Upside
- Zacks (via Yahoo Markets) - Synopsys (SNPS) Q3 Earnings and Revenues Top Estimates
- MarketBeat - Synopsys (SNPS) Stock Price, News & Analysis
- Fintel - SNPS - Stock Price, Institutional Ownership, Shareholders
- MarketBeat - Canada Pension Plan Investment Board Purchases Shares of 600,117 Synopsys, Inc. $SNPS
- MarketBeat - Wells Fargo & Company Issues Pessimistic Forecast for Synopsys (NASDAQ:SNPS) Stock Price
- SEC Edgar - snps-20260731 (Form 10-Q)
- MarketBeat - 49,196 Shares in Synopsys, Inc. $SNPS Acquired by Partners Capital Investment Group LLP
About this seasonal analysis
Seasonal pattern data is sourced from TradeWave.ai, which analyzes historical price behavior across annual calendar windows going back up to 30 years. Read the full data methodology or the book The 100-Year Pattern by Afshin Moshrefi (2026 edition). Past performance of seasonal patterns does not guarantee future results. This article is for informational purposes only and does not constitute investment advice.