8-for-8 Midterm Run: Amphenol (APH) Averages 11.66% Gains in This 202-Day Window
Amphenol is approaching a historically strong 202-day trading window just as shares hover near record territory after a powerful Q2 beat and upbeat guidance.
Price as of Aug 21, 2026: $157.01 (last close).

What is the seasonal pattern for Amphenol (APH)?
Amphenol has risen in 8 of 8 midterm-election-year Sep 18 to Apr 7 windows, with an average gain of 11.66% in winning years.
- 8 for 8 in this window, with Amphenol averaging 11.66% gains across winning years from Sep 18 to Apr 7.
- The upcoming 202-day trading window begins on Sep 18, 2026 and covers the late midterm year into early pre-election year.
- Percent Profitable is 100%, with 8 winners and 0 losers across the last eight midterm-election-year cycles.
- Average winner gains of 11.66% stack to a 140% cumulative return when the window is repeated across all eight cycles.
- Historical best intraperiod rallies have reached more than 30% from entry in strong years, while worst drawdowns have exceeded 20% in weaker ones.
- The pattern is long-directional, with a Sharpe ratio of 3.08 and a TradeWave Ratio of 2.46, pointing to strong risk-adjusted upside in this specific window.
According to historical data from TradeWave.ai, this midterm-election-year stretch has behaved very differently from an average calendar period for Amphenol, and the next iteration is less than a month away.
How strong is Amphenol’s (APH) Sep–Apr seasonal window in midterm years?
Amphenol has closed higher in every single Sep 18 to Apr 7 window across the last eight midterm election years, averaging 11.66% gains with no losing cycles. The stock finished Monday at 157.01, up 2.5% on the day and about 12.1% below its 52-week high of 178.52, leaving room above if the historical pattern repeats.
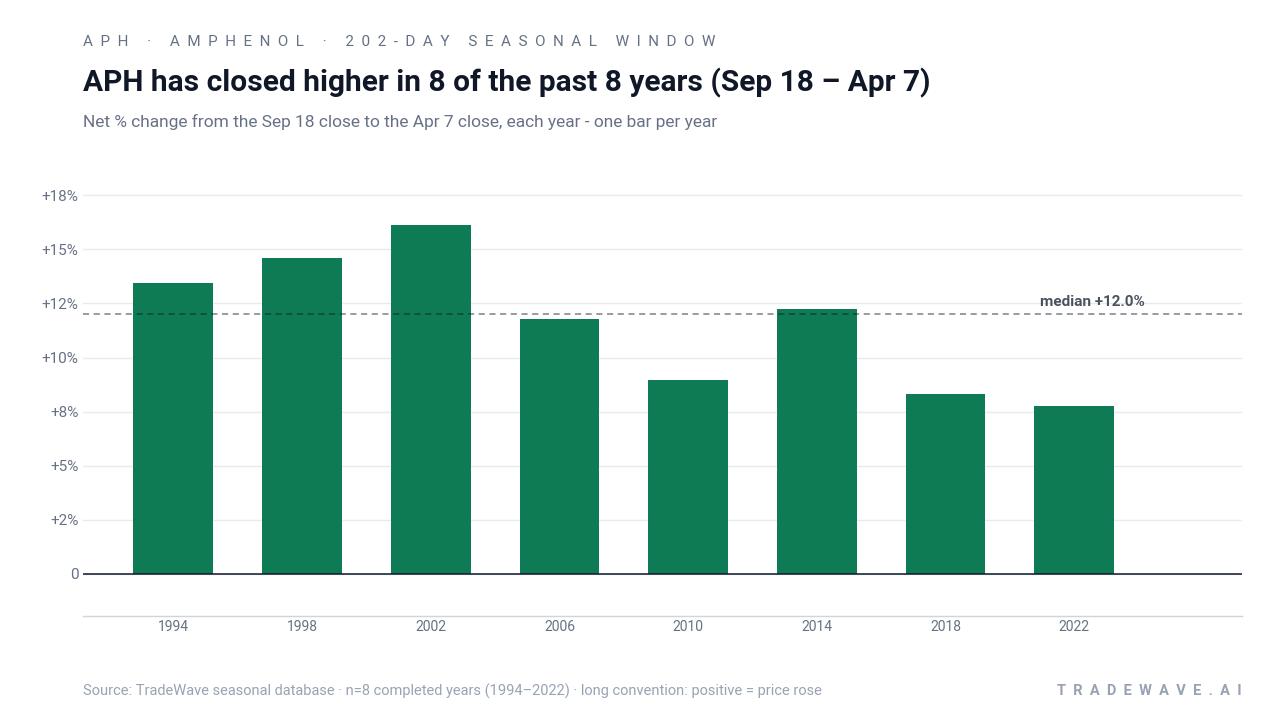
The grouping by presidential election cycle matters here because this window straddles the handoff from the midterm election year into the year before the presidential election, a phase that has often coincided with friendlier policy tone and stronger risk appetite for growth and industrial technology names. For Amphenol, that has translated into a consistent pattern of late-year and early-year strength when this specific 202-day slice is measured across comparable cycles.
Across the eight completed midterm-election-year samples from 1994 through 2022, Amphenol’s average gain in this window is 11.66%, with a median outcome of 12.01% and a cumulative return of 140% when the window is compounded year over year. The trade direction is long, and every single iteration has finished in the green, which is rare for a 202-day stretch in a single stock. The Sharpe ratio of 3.08 indicates that, based on end-of-window outcomes, returns have been strong relative to volatility.
The per-year breakdown shows how that strength has played out. The best net return came in 2002, when Amphenol gained 16.11% between Sep 18 and Apr 7, with a maximum favorable move of 30.18% at the peak and a worst drawdown of 21.95% from entry. Even the softest year in the sample, 2022, still finished up 7.76% over the window, though it also saw a 10.88% intraperiod drop before recovering.
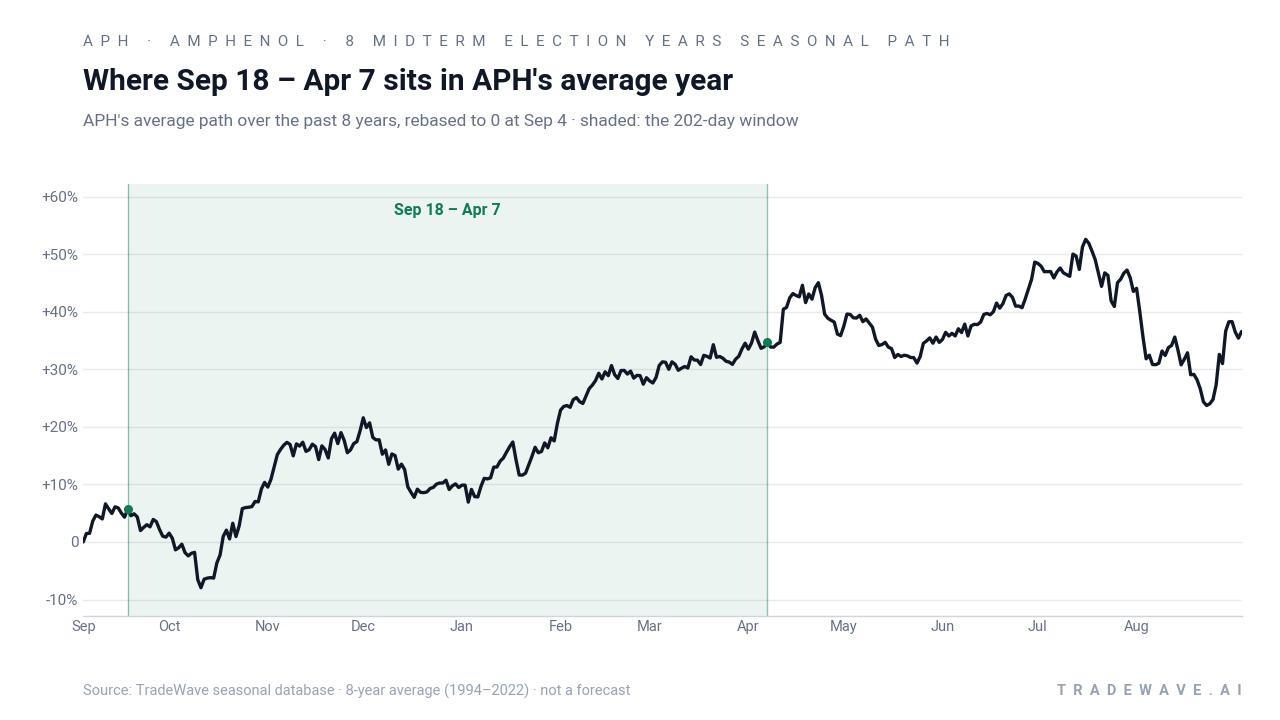
The historical seasonal average suggests that gains have tended to build gradually rather than in a single burst. In several cycles, Amphenol has seen an early-year wobble inside the window before pushing to new highs later in the period, which fits the broader pattern of midterm-year volatility giving way to pre-election-year strength.
A closer look at yearly ranges shows how much Amphenol has typically swung inside this window before settling at those positive finishes.
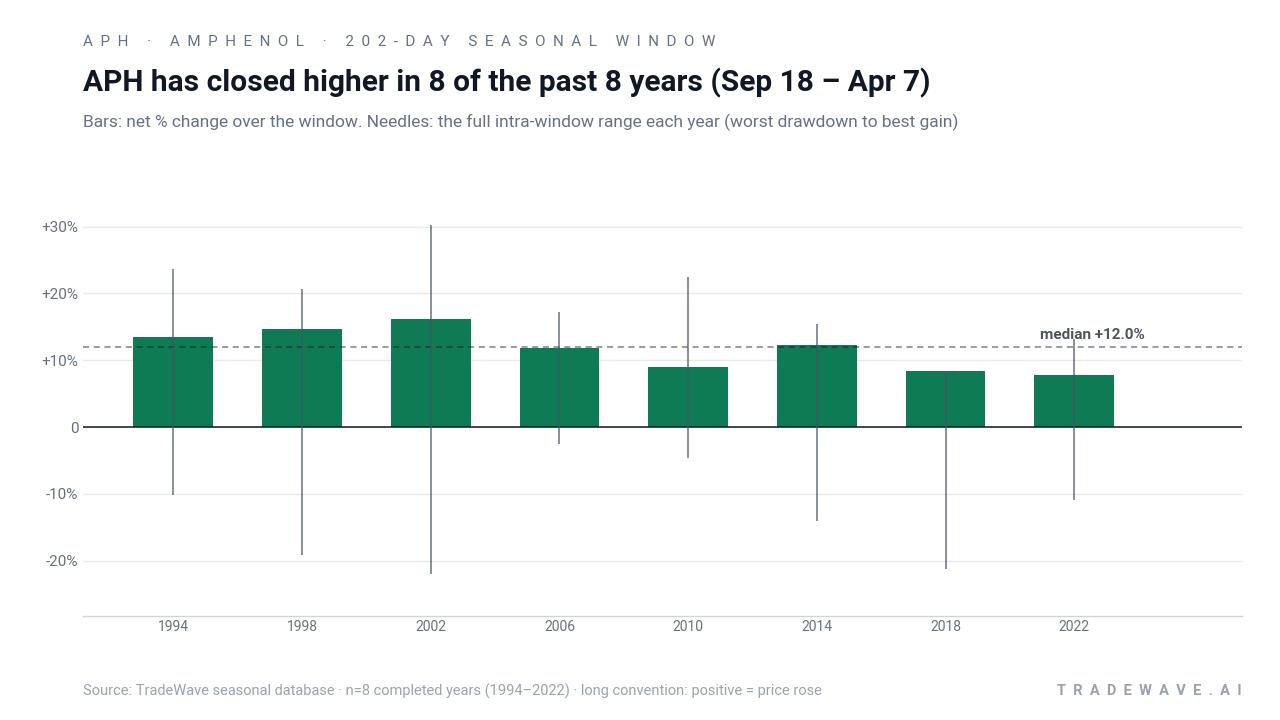
The combined net / maximum favorable / maximum adverse chart shows a clear pattern: upside potential has been large, with best intraperiod rallies often in the mid-teens to low-30s in percentage terms, but downside swings have also been meaningful. In 1998, for example, Amphenol ultimately gained 14.62% over the window, yet the stock first fell as much as 19.1% from the entry level before recovering. That mix of strong MFE and sizable MAE is consistent with a high-conviction long window that still demands risk management.
History does not guarantee future results; adverse excursions (MAE) can be large even in winning windows.
Why does Amphenol (APH) follow this seasonal pattern?
One likely driver is the way Amphenol’s earnings calendar lines up with the political cycle, with Q3 and Q4 results and guidance often landing inside this Sep–Apr stretch and capturing year-end demand for communications, automotive and industrial connectors. Analysts have also pointed to institutional portfolio repositioning around the midterm-to-pre-election transition, when investors tend to lean back into structural growth stories after early-year volatility. For a profitable, acquisition-hungry supplier tied to AI and electronics spending, that combination of earnings visibility and risk-on rotation may help explain why this specific window has been so consistently positive in past midterm-election years.
What is driving Amphenol (APH) today?
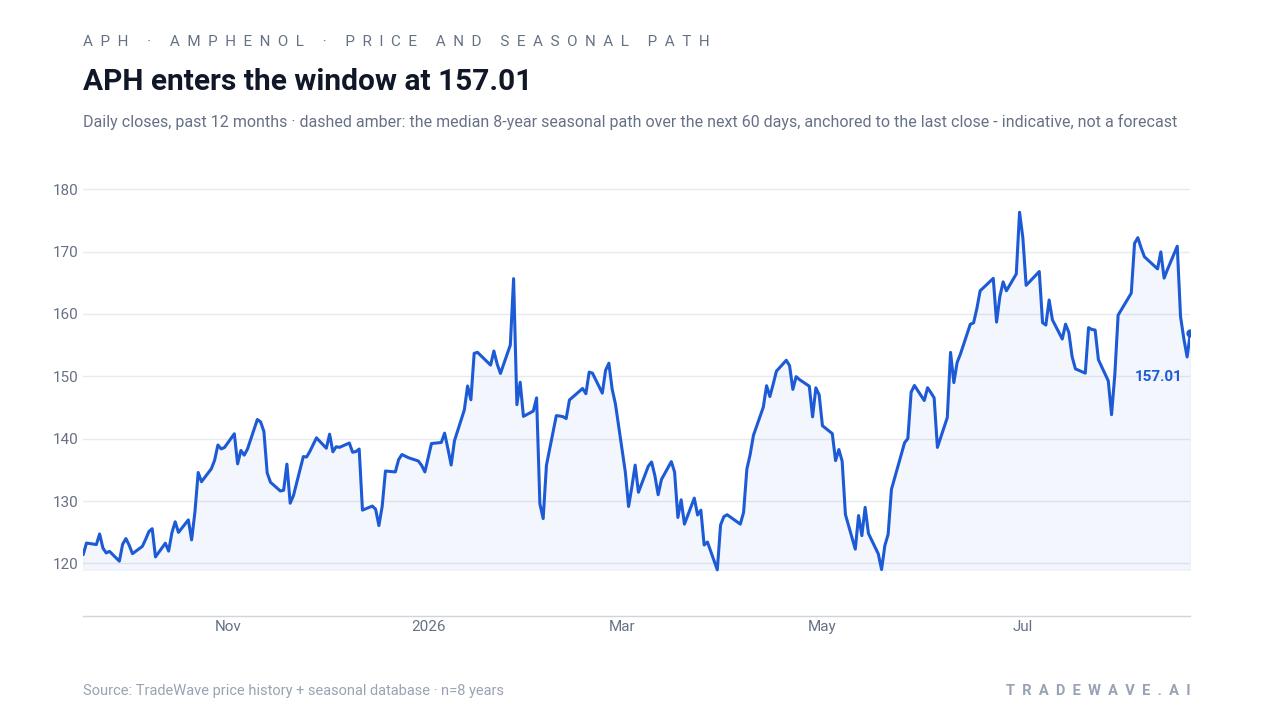
Amphenol shares closed at 157.01 on Monday, up 2.5% on the session, after a steady climb that has left the stock about 12.1% below its 52-week high of 178.52 and well above its 50-day moving average of 160.86 earlier in the summer. The move comes in the wake of a strong Q2 CY2026 report on Aug 3, where Amphenol delivered revenue of $8.76 billion versus estimates of $8.29 billion and adjusted EPS of $1.35 versus $1.19, alongside operating margins near 29.5%.[7]
The company also guided Q3 revenue to a midpoint of $9.35 billion and set adjusted EPS guidance around $1.41, both above analyst expectations at the time, reinforcing the narrative of AI-driven and electronics demand supporting the order book.[1] Pre-earnings coverage in late July had already flagged rising estimates and positive sentiment in the tech hardware and electronics segment, with Amphenol singled out as a beneficiary of infrastructure and data-center spending.[5][6] Morningstar’s early August growth-stock screen likewise highlighted Amphenol as a long-term compounder, underscoring how the stock has shifted from a cyclical industrial to a core growth holding in many portfolios.[9]
The chart below situates the latest move against the past year of trading and the median seasonal path over the next two months.
What should traders watch as this seasonal window approaches?
First, the calendar: the 202-day window opens on Sep 18 and runs through Apr 7, covering the final stretch of the midterm election year and the early months of the year before the presidential election. Historically, that has been a friendlier backdrop for growth and industrial technology stocks than the choppier first half of the midterm year, and Amphenol’s 8-for-8 record in this slice reflects that tendency.
Second, price levels: traders will be watching whether Amphenol can reclaim the 160–170 zone and eventually challenge the 52-week high near 178.52 as the window gets underway. In prior cycles, some of the strongest gains have come after early pullbacks inside the window, so how the stock behaves around any dips from current levels will be an important tell for whether the historical pattern is tracking or breaking.
Third, catalysts: while the next formal earnings date is not yet set, the company’s Q3 report and any updates on AI-related demand, automotive content and industrial orders will land inside this seasonal regime. Upside or downside surprises relative to the upbeat Q3 guidance issued in late July and early August could either reinforce or overwhelm the typical seasonal drift higher.[1][7]
Finally, volatility: the historical MFE and MAE profile shows that even in winning years, Amphenol has often swung 10–20% inside the window before settling higher. Traders watching this APH seasonal trend will be looking for whether intraperiod drawdowns stay within that historical band or break meaningfully wider, which would signal that this midterm-to-pre-election cycle is behaving differently from the last eight.
Sources
- MarketBeat - Amphenol (NYSE:APH) Issues Q3 2026 Earnings Guidance
- Yahoo Finance - Amphenol Corporation (APH) Stock Price, News, Quote & History - Yahoo Finance
- MarketBeat - Amphenol Shares Scheduled to Split on Thursday, September 3rd (NYSE:APH)
- Zacks / Yahoo Finance (Zacks content hosted on Yahoo) - Surging Earnings Estimates Signal Upside for Amphenol (APH) Stock
- Yahoo Finance / StockStory - Earnings To Watch: Amphenol (APH) Reports Q2 Results Tomorrow
- Yahoo Finance - Is Amphenol Stock a Smart Buy Before Q2 Earnings Report?
- Yahoo Finance - Amphenol (NYSE:APH) Surprises With Strong Q2 CY2026, Stock Soars
- MarketBeat - Amphenol Corporation $APH Shares Sold by Epoch Investment Partners Inc.
- Morningstar - 10 Best Growth Stocks to Buy for the Long Term - Morningstar (Amphenol profile)
About this seasonal analysis
Seasonal pattern data is sourced from TradeWave.ai, which analyzes historical price behavior across annual calendar windows going back up to 30 years. Read the full data methodology or the book The 100-Year Pattern by Afshin Moshrefi (2026 edition). Past performance of seasonal patterns does not guarantee future results. This article is for informational purposes only and does not constitute investment advice.