13-for-13 Midterm Run: Deere & Company (DE) Averages 25.56% Gains From Sep 24
Deere & Company is approaching a historically powerful 281-day midterm-election-year window just as the stock trades near record highs after strong earnings and fresh analyst target hikes.
Price as of Aug 25, 2026: $630.66 (last close).

What is the seasonal pattern for Deere & Company (DE)?
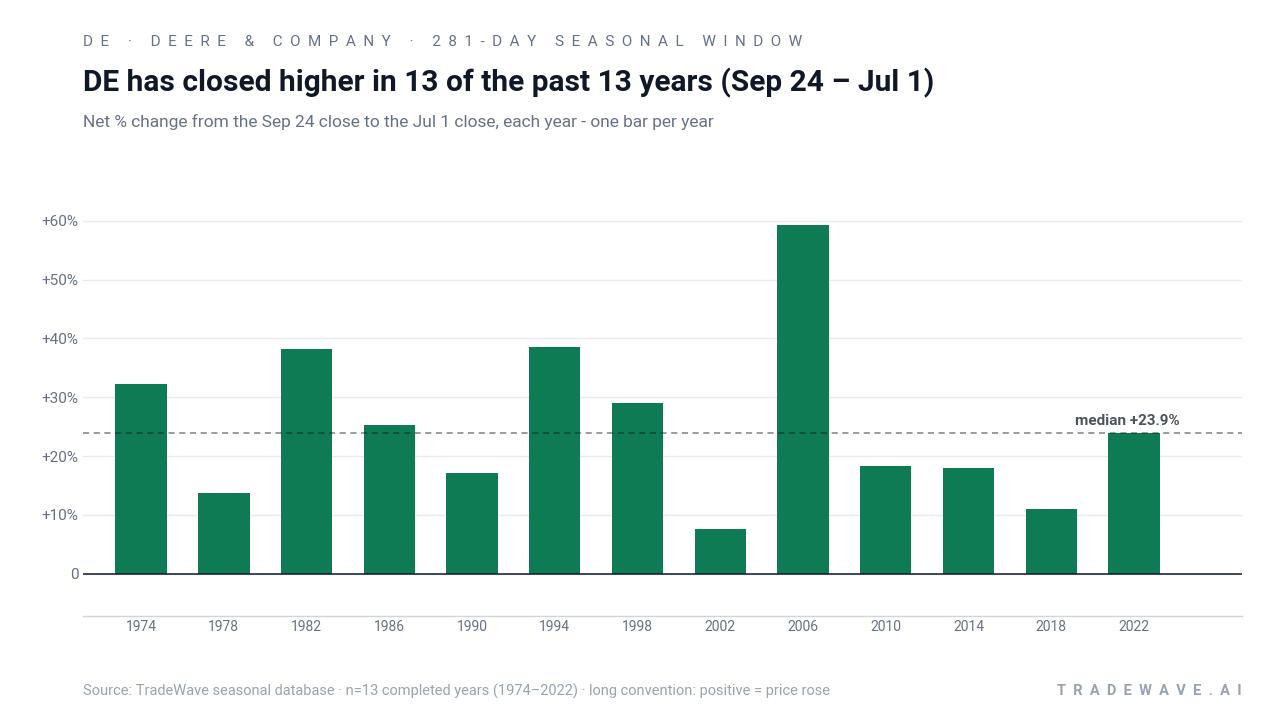
Deere & Company has risen in 13 of 13 midterm-election-year windows starting Sep 24, with an average gain of 25.56% in winning years.
- 13 for 13 in this window, averaging 25.56% gains in winning years across the last 13 midterm election cycles.
- Seasonal window runs from Sep 24 for 281 days, covering the late midterm election year into the heart of the year before the presidential election.
- Percent Profitable is 100%, with 13 winners and 0 losers in the historical sample.
- Annualized return across these windows is 24.87%, with a Sharpe ratio of 1.6 based on end-of-window outcomes.
- The TradeWave Ratio of 2.06 signals that price has typically traveled meaningfully in the long direction within the window, even before final closes.
- Individual years have still seen double-digit drawdowns inside the window, so the path has not been a straight line even in winning seasons.
According to historical data from TradeWave.ai, this upcoming stretch for Deere & Company behaves very differently from an average year. The next section walks through how that midterm-election-year pattern has played out in prior cycles.
How has Deere & Company (DE) traded in the Sep 24 to Jul 1 midterm-year window?
Deere & Company has risen in 13 of the last 13 midterm-election-year windows that start on Sep 24 and run for 281 days, averaging gains of 25.56% per cycle. The stock finished Tuesday at $630.66, down 2.8% on the day and about 5.4% below its 52-week high of $666.80.[4] That combination of a near-perfect historical seasonal trend and a stock sitting just off record territory gives this year’s window unusual weight for traders focused on industrials and the broader farm-equipment trade.
Because this pattern is grouped by the presidential election cycle, it captures how Deere has behaved specifically in midterm election years as policy risk peaks and then into the year before the presidential election, when Washington often shifts toward a more growth-friendly stance. That framing matters for a capital-goods name like Deere, which is sensitive to fiscal spending, infrastructure policy and farm-support programs that tend to ebb and flow with the political calendar.[4]
Across the 13 completed midterm-year windows in the sample, every single one finished positive for a long position, with the weakest year still up 7.56% and the strongest year gaining 59.2%. Average gains of 25.56% sit close to the median outcome of 23.86%, which suggests the distribution has been relatively balanced rather than driven by one or two outliers. The annualized return of 24.87% and a Sharpe ratio of 1.6 underline that this has historically been a strong, risk-adjusted stretch for long exposure.
The per-year profile shows how that strength has played out in practice. In 2006, Deere rallied 59.2% from late September into the following summer, with the best intraperiod move reaching 61.37% and almost no drawdown at the worst point, just 0.15% below entry. By contrast, 1990 still finished up 17.13% but saw the stock trade as much as 21% below the starting level at one point, illustrating that even winning years can involve deep air pockets.
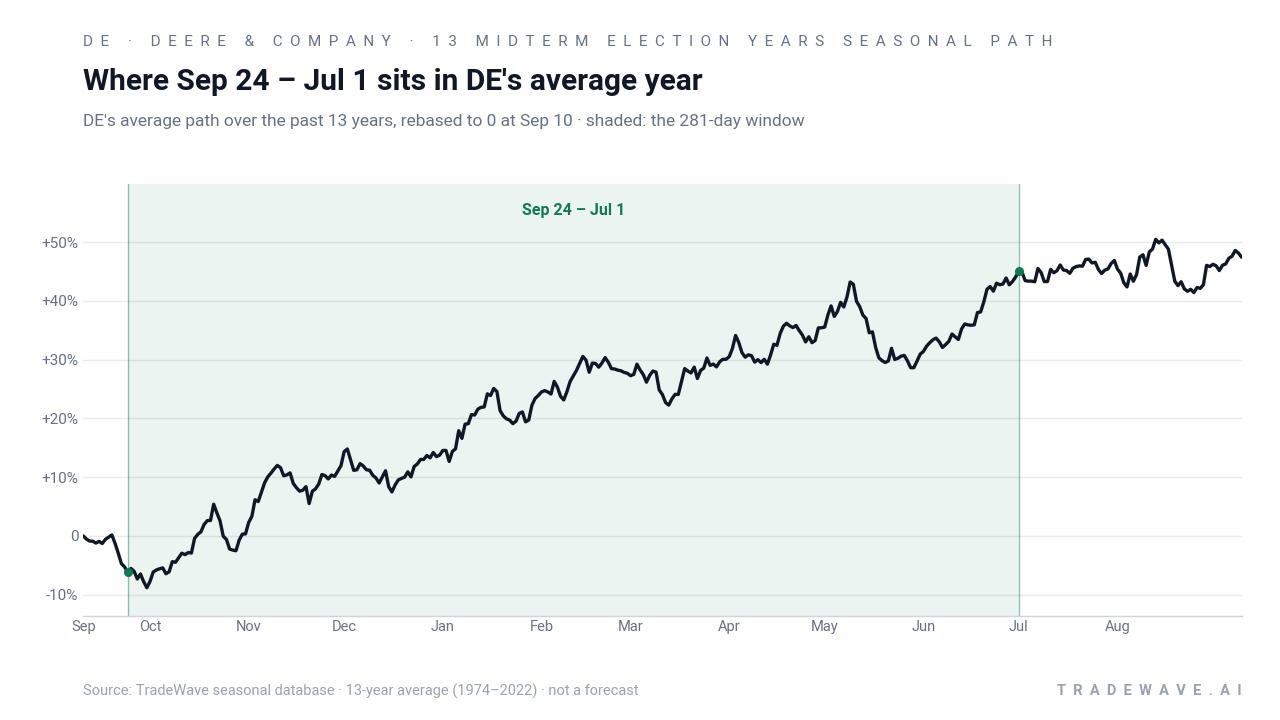
Looking at the historical seasonal average, the typical DE seasonal trend in this window starts with a firm tone in the final quarter of the midterm year, then accelerates into the first half of the year before the presidential election. The average path suggests that much of the cumulative gain has tended to accrue in the middle of the window rather than in a single burst at the start or end. That fits with a narrative of improving visibility on policy and farm income as the election cycle advances.
A second view, combining net results with intraperiod swings, shows how much room DE has historically had to run and how deep the air pockets have been.
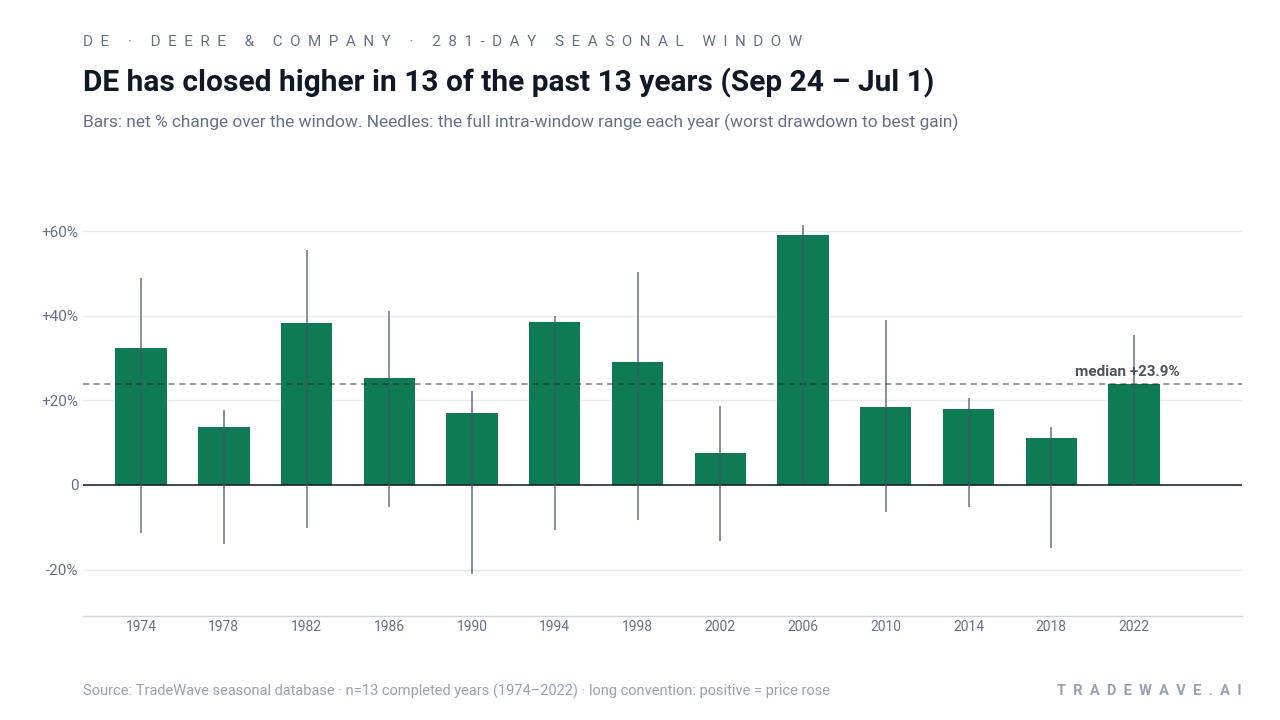
The combined net / maximum favorable move / maximum adverse move view shows that upside potential has often been larger than the final gain, with several years where the best intraperiod rally topped 35% while the final close settled lower. At the same time, adverse excursions of 10% to 20% have been common, especially in years like 1990 and 2018, where the stock dipped sharply before recovering into the close of the window. The TradeWave Ratio of 2.06 captures that tendency for price to travel meaningfully in the long direction within the window, even when the final print understates the full swing.
The cumulative chart of this midterm-year window is unusually smooth for a single-stock pattern. Stacking the 281-day windows back-to-back compounds to a 1,695% gain across the 13-sample history, with no visible step-downs. Add it up: nine- and ten-figure farm-equipment cycles, policy shifts and multiple rate regimes have all passed through this window without producing a single losing season for longs in the sample.
History does not guarantee future results; adverse excursions can still be large inside the window even when the final outcome has been positive in prior years.
Why does Deere & Company (DE) follow this seasonal pattern?
One likely driver is the way Deere’s earnings calendar and farm-capex cycle line up with the political calendar. Analysts have long pointed to stronger equipment orders and dealer restocking as visibility on crop prices, subsidies and infrastructure spending improves heading into the year before a presidential election, when fiscal policy often turns more supportive.[4] This pattern may also reflect institutional portfolio rotation into industrials and machinery as investors position for a more pro-growth stance from Washington in that phase of the cycle.
What is driving Deere & Company (DE) today?
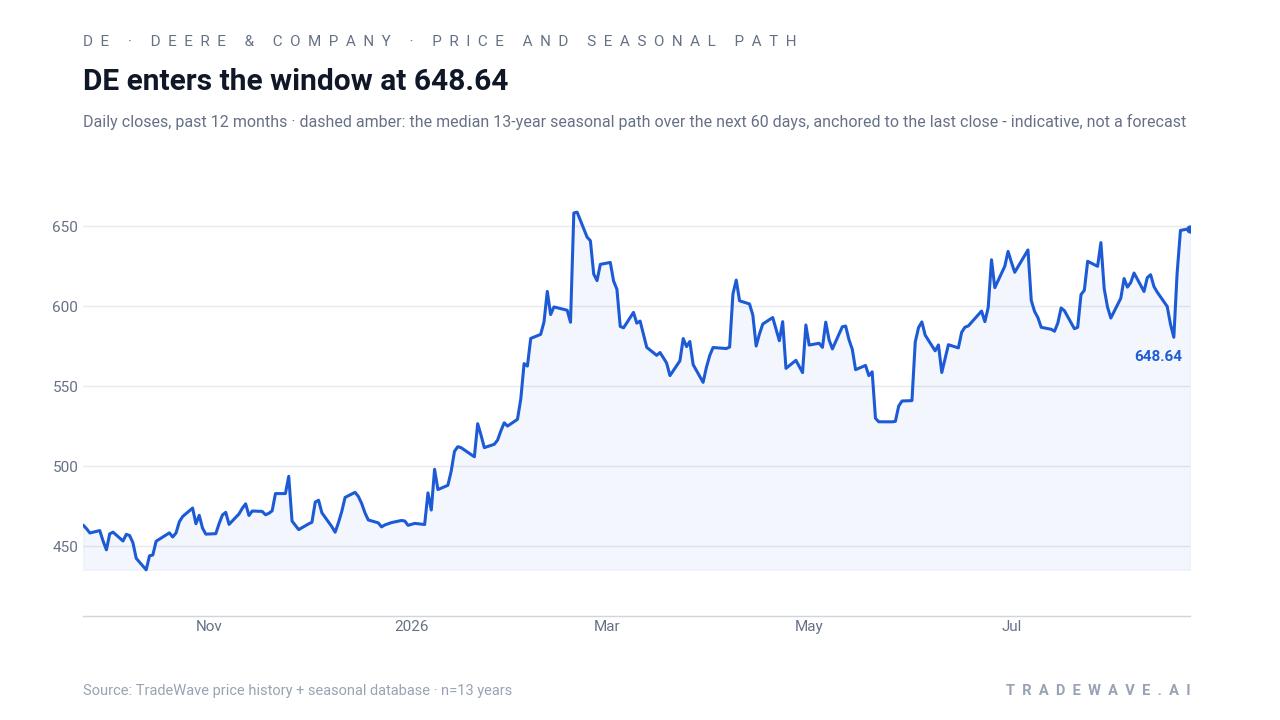
Deere & Company shares closed at $630.66 on Tuesday, down 2.8% on the day but still up 3.78% over the past month and trading about 5.4% below their 52-week high of $666.80.[4] The pullback comes less than a week after Deere reported quarterly earnings on Aug 20 that topped expectations on both the top and bottom line, with EPS of $5.10 versus a $4.69 consensus and revenue of $12.61 billion versus $10.81 billion expected, helped by mid-single-digit revenue growth and solid double-digit returns on equity.[4] Analysts have responded by nudging targets higher: on Aug 14 JPMorgan set a $570 target, then lifted it to $585 on Aug 21, while DA Davidson reiterated a positive stance with its own upbeat forecast on Aug 24, contributing to a MarketBeat-aggregated “Moderate Buy” rating and a consensus target around $641.98 that sits just above the current price.[2][3][4][5]
Beyond earnings, the macro backdrop for Deere is defined by a tug-of-war between elevated valuation and still-healthy earnings growth expectations. In late August, MarketBeat data showed the stock trading at a price-to-earnings multiple of 36.90, above the Industrials sector average of about 26.64 but below a broader market multiple near 39.64, while various sources peg current fiscal-year EPS expectations in the high-teens per share with next year’s estimates even higher.[4][6] That leaves Deere priced as a premium industrial with growth characteristics, a setup that can amplify moves when macro data or policy headlines shift the outlook for capital spending and farm income.
Insider activity has been quiet in directional terms, with recent filings in December 2024 and into 2026 dominated by stock award grants to senior executives at a zero transaction price rather than open-market buying or selling.[7] For traders watching the upcoming seasonal window, the absence of heavy insider selling near the highs may be a small but notable data point, especially when set against a long-run pattern that has historically favored long exposure from late September into the following summer.
The chart below shows how DE’s latest pullback fits into its 12-month trend, alongside the median 60-day seasonal path for this midterm-year window.
What should traders watch as this seasonal window approaches?
First, the calendar: the 281-day window begins on Sep 24, placing the start just as the midterm election year moves into its final quarter and the market begins to look ahead to the year before the presidential election. Historically, that transition has coincided with stronger performance for cyclicals and industrials, and Deere’s own midterm-year pattern has lined up with that shift. Traders will be watching whether the stock can stabilize above the recent low near $627 and then build a base into late September, which would be more consistent with the historical seasonal trend than a deeper breakdown.
Second, earnings and policy catalysts. While Deere has already reported its August quarter, any updates on farm income, infrastructure spending or equipment demand from peers and macro data could influence how investors treat the stock heading into the window.[2][3][4] On the policy side, headlines around agricultural subsidies, trade policy and infrastructure appropriations will matter more than usual given the election-cycle framing of this pattern. A supportive tone from Washington as the year-before-election phase approaches would rhyme with prior cycles in which Deere’s seasonal window has been strong.
Third, price behavior inside the window relative to the historical MFE and MAE profile. In prior years, even winning windows have seen drawdowns of 10% to 20% from the entry point before recovering, so traders may treat sharp dips as part of the historical playbook rather than an automatic pattern failure. Conversely, if DE were to break materially below those typical adverse excursions or fail to show any sustained upside push in the first half of the window, that would be an early sign that this cycle is diverging from the 13-for-13 record.
Finally, watch how analyst sentiment and valuation evolve if the stock rallies into or through the window. With the consensus target only modestly above spot and the P/E already at a premium to the sector, further price strength could depend on either upward revisions to earnings estimates or a willingness by investors to pay an even higher multiple.[3][4][6] If earnings forecasts continue to drift higher while the stock respects the historical seasonal tendency, that would reinforce the idea that this midterm-year window remains a constructive backdrop for Deere; if not, it may signal that the 100% win streak is facing a tougher macro test than in prior cycles.
Sources
- MarketBeat - Deere & Company (DE) Stock Forecast and Price Target 2026
- MarketBeat - Deere & Company (NYSE:DE) Given New $570.00 Price Target at JPMorgan Chase & Co.
- MarketBeat - DA Davidson Issues Positive Forecast for Deere & Company (NYSE:DE) Stock Price
- MarketBeat - Deere & Company (DE) Stock Price, News & Analysis
- MarketBeat - Deere & Company (NYSE:DE) Price Target Raised to $585.00 at JPMorgan Chase & Co.
- Yahoo Finance - Here is What to Know Beyond Why Deere & Company (DE) is a Trending Stock
- Yahoo Finance - Deere & Company (DE) Recent Insider Transactions - Yahoo Finance
About this seasonal analysis
Seasonal pattern data is sourced from TradeWave.ai, which analyzes historical price behavior across annual calendar windows going back up to 30 years. Read the full data methodology or the book The 100-Year Pattern by Afshin Moshrefi (2026 edition). Past performance of seasonal patterns does not guarantee future results. This article is for informational purposes only and does not constitute investment advice.