HP Inc. (HPQ) Near 52-Week Highs as 9-for-10 Midterm Fall-Winter Rally Window Approaches
HP Inc. is approaching a historically strong Sep 23–Feb 12 trading window with shares near 52-week highs and options traders leaning in ahead of earnings.
Price as of Aug 21, 2026: $29.71 (last close).

What is the seasonal pattern for HP Inc. (HPQ)?
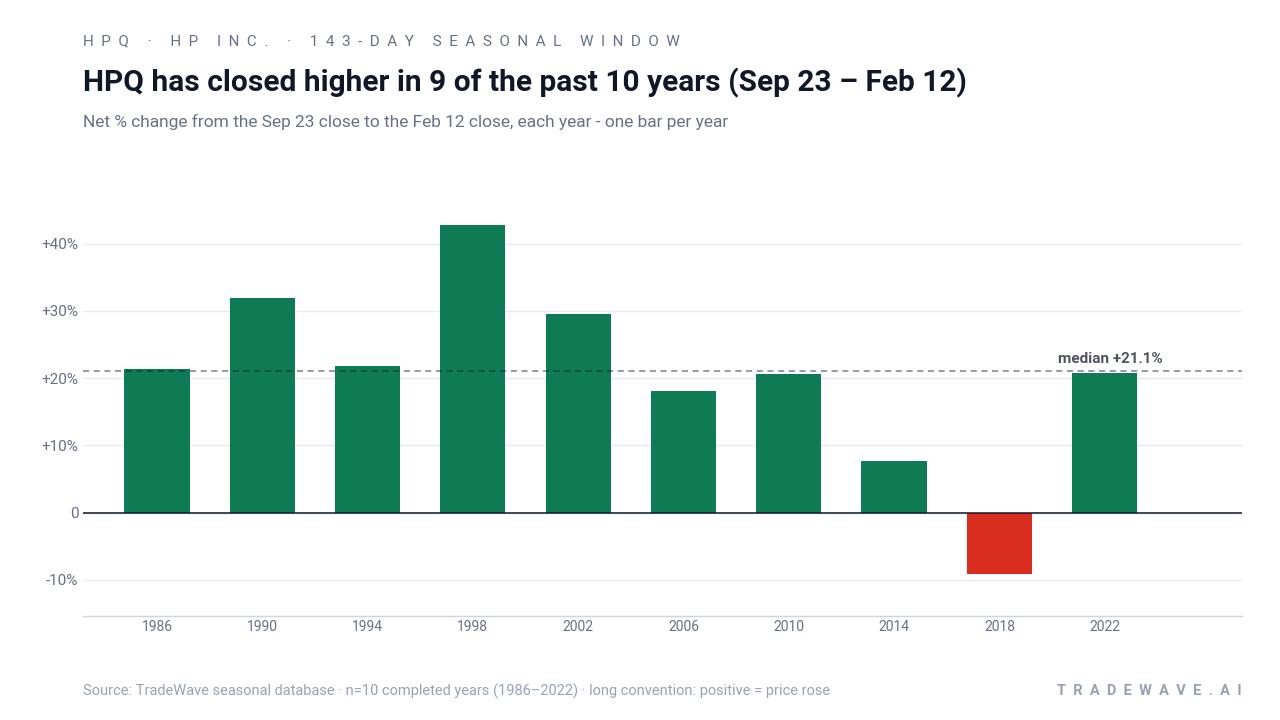
HP Inc. has risen in 9 of 10 years during this Sep 23–Feb 12 midterm-year window, with an average gain of 23.85% in winning years.
- 9 for 10 in this window, with winning years averaging 23.85% gains and only one losing year in the sample.
- The upcoming seasonal window runs from Sep 23 through Feb 12, spanning 143 calendar days in the midterm election year.
- Percent Profitable is 90%, with 9 winners and 1 loser across the last 10 midterm election years.
- Avg Profit - All, which includes the lone losing year, is still a strong 21%, underscoring a bullish HPQ seasonal trend.
- The historical TradeWave Ratio of 1.52 suggests price has typically traveled meaningfully in the long direction within this HP Inc. trading window.
- Maximum adverse moves have reached as deep as about 25% in a single year, so intraperiod drawdowns can be sharp even when the window finishes higher.
According to historical data from TradeWave.ai, this midterm-year stretch has behaved very differently from an average few months on the calendar for HP Inc., and the next iteration is less than a month away.
How has HP Inc. (HPQ) traded in the Sep 23–Feb 12 midterm-year window?
HP Inc. has closed higher in 9 of the last 10 midterm election years during the Sep 23–Feb 12 window, with an all-years average gain of 21%. Shares finished Monday at 29.71, up 0.8% on the day and about 7.7% below the 52-week high of 32.19, after rallying 33.35% year to date.[1][3] Options desks have flagged heavy trading in out-of-the-money HPQ puts that has enabled short-put sellers to capture yields around 7.4% into earnings, a sign that some investors are willing to lean into downside volatility for income.[4] The combination of a strong historical seasonal pattern, a stock pressing the upper end of its one-year range, and punchy options positioning sets up a crowded fall for this old-line tech name.
The presidential election cycle matters here because this pattern is built only from the last 10 midterm election years, a phase that often features policy uncertainty followed by a more supportive backdrop as markets pivot toward the year before the presidential election. HP Inc. sits squarely in that mid-cycle pocket today, with the upcoming window bridging late midterm-year trading into the historically more constructive pre-election year environment for equities.
This seasonal window begins on Sep 23 and spans 143 days. Historically, during this period, HP Inc. has shown a strong bullish tendency, with a long trade direction and a 90% win rate across those midterm-year samples. The average gain in winning years is 23.85%, while including the single losing year pulls the all-years average to 21%, which is still a strikingly high number for a roughly five-month slice of the calendar.
The per-year breakdown shows how consistent that HPQ seasonal trend has been. In 1998, the stock gained 42.72% over the window, with a maximum favorable move of 56.61% before giving back some ground by the close. In 2002, HPQ added 29.6% with an even larger 65.31% best run-up at one point, while the weakest outcome came in 2018, when the stock finished the window down 9.1% after suffering a worst drawdown of 25.17% from the entry.
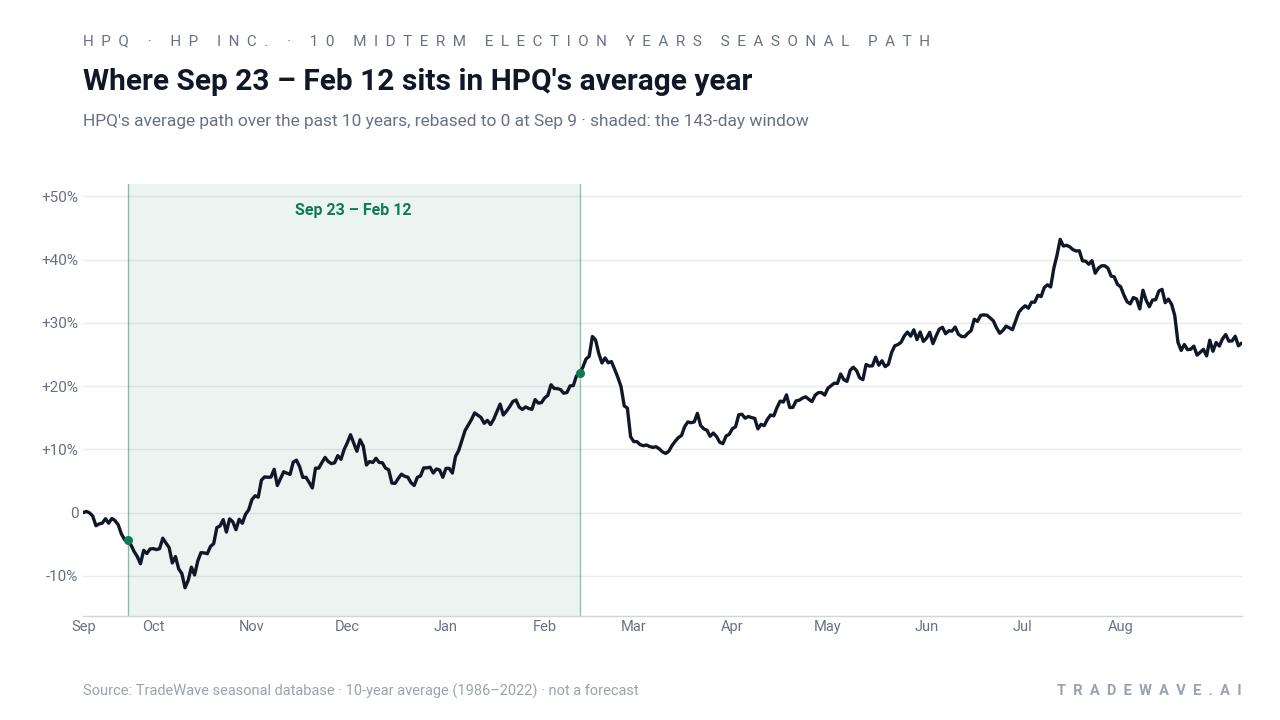
A second view of the same window highlights how far HPQ has swung inside the range each year, not just where it finished.
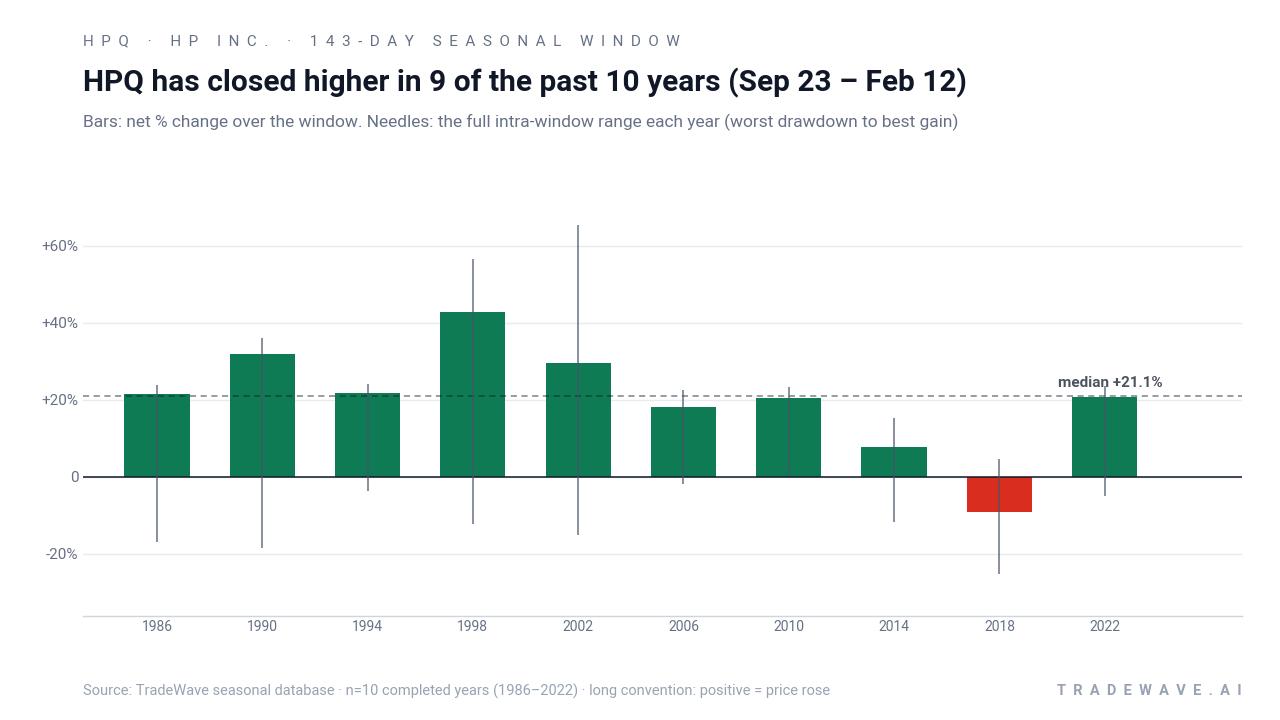
The maximum favorable move profile shows that in most years HPQ has not only finished higher but also traded well above the eventual close at some point in the window, which is consistent with a long-biased setup that often overshoots before consolidating. On the downside, maximum adverse moves have ranged from shallow pullbacks of around 2% to deep drawdowns of more than 20%, underscoring that even a strong seasonal edge has come with real risk along the way.
The cumulative chart of this HP Inc. trading window compounds those outcomes into a single line that climbs to a 507% cumulative return across the 10 midterm-year samples. Add it up and the pattern is clear: this has been one of the most consistently positive stretches on HPQ’s election-cycle calendar, with only 2018 interrupting an otherwise clean run of gains.
History does not guarantee future results; adverse excursions can be large even in winning windows, and traders should respect the potential for double-digit drawdowns inside the pattern.
Why does HP Inc. (HPQ) follow this seasonal pattern?
One likely driver is the way HP’s fiscal calendar and PC demand cycles line up with the broader election cycle. The Sep–Feb stretch captures back-to-school and holiday PC spending, corporate budget flushes, and early-year IT refresh decisions, all of which can support technology hardware names. Analysts have also pointed to institutional portfolio repositioning around midterm-year volatility, which can leave value-oriented, dividend-paying tech stocks like HPQ as beneficiaries as markets pivot toward the historically stronger year before the presidential election.[2][6][7]
What is driving HP Inc. (HPQ) today?
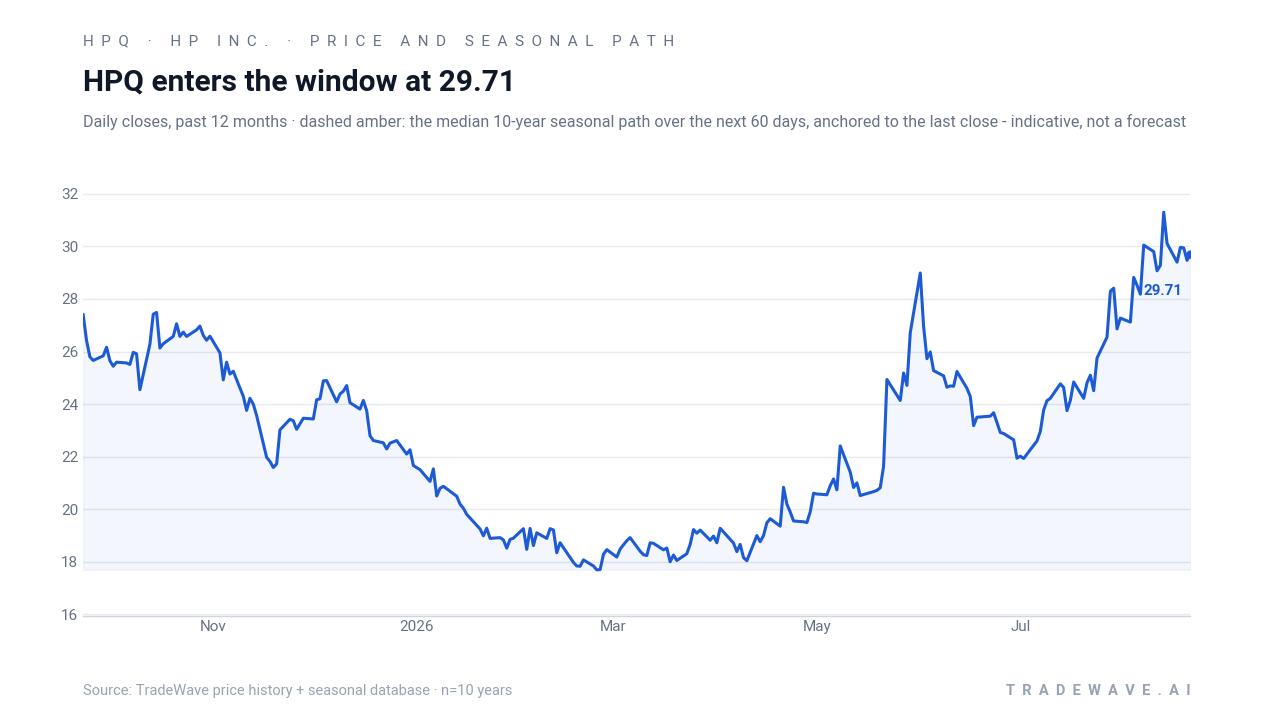
HPQ closed Monday at 29.71, up 0.24 points or 0.8%, leaving the stock about 7.7% below its 52-week high of 32.19 and well above the 52-week low near 16.60.[1][3] The move extends a 33.35% year-to-date gain, outpacing many peers in the Technology Hardware, Storage & Peripherals group as investors have gravitated toward cash-generative, dividend-paying tech names.[3][7] Trading volume of 10,131,829 shares was close to the 20-day average of 13,874,682.7, suggesting steady interest rather than a blowout rush into the name.[5]
Near term, the focus is squarely on HP’s fiscal second-quarter 2026 earnings report due after the close on Aug 26, with investors watching whether Personal Systems strength can offset ongoing softness in Printing margins.[2] In May 2026, Zacks highlighted consensus expectations for roughly $14.05 billion in revenue and non-GAAP EPS around $0.71, framed against company guidance of $0.70 to $0.76, and those benchmarks still shape how the Street will score this week’s print.[2] In the latest reported quarter, ChartMill data show HPQ beat EPS estimates by 19.77% and revenue by 1.41%, which has helped underpin the stock’s climb into the upper end of its one-year range.[3]
Options activity has added another layer. Barchart flagged unusual put trading in HPQ earlier in August, with investors selling out-of-the-money puts for an implied yield of about 7.4%, effectively betting that the stock will hold above key strike levels through the earnings event.[4] That kind of short-put yield is attractive in a low-volatility tape but also means a cohort of traders is explicitly long downside risk if HPQ stumbles on guidance or if macro headwinds, such as elevated memory and storage costs, squeeze margins more than expected.[2][4]
Macro and sector context remain mixed. Zacks has pointed to high memory and storage chip prices as a headwind for PC makers, raising build costs and pressuring profitability even as unit demand stabilizes.[2] At the same time, MarketWatch’s snapshot of the broader market shows the Dow, S&P 500 and Nasdaq all trading higher in tandem, a backdrop that has generally favored cyclical tech hardware names like HPQ when investors are comfortable taking on some risk.[1] Seeking Alpha’s July analysis framed HP as a high-yielding, undervalued tech stock, a narrative that has resonated with income-focused buyers as bond yields have drifted sideways.[7]
The chart below situates the latest move in its recent multi-month context and overlays the median seasonal path for the next two months.
What should traders watch as HPQ approaches this seasonal window?
First, the earnings reaction on and after Aug 26 will set the tone for how HPQ enters the Sep 23 start of the window.[2] A move that keeps the stock above the 50-day moving average around 25.85 would preserve the current uptrend and keep the seasonal setup aligned with price momentum.[3][5] A sharp break back toward the mid-20s, especially on heavy volume, would signal that macro or company-specific concerns are overpowering the historical pattern.
Second, traders should track whether the unusual put activity persists or fades after earnings.[4] If short-put yields remain elevated and open interest builds at key strikes, that would suggest investors are still comfortable underwriting downside in exchange for income, which can create a soft floor under the stock but also concentrate risk if HPQ gaps lower.[4] A reversal, with put sellers stepping back or shifting to calls, would indicate that the options market is less willing to lean into the seasonal edge.
Third, watch how HPQ behaves as the calendar moves from the midterm election year into the year before the presidential election. Historically, this transition has been supportive for equities, and HPQ’s midterm-year Sep–Feb window sits right on that handoff, which has often coincided with improving risk appetite and sector rotation into cyclical tech.[1][7] If the stock can hold higher lows and make progress back toward the 32–33 area during the window, that would be consistent with the historical pattern; a failure to participate in any broader risk-on move would be a clear divergence.
Finally, traders should keep an eye on margin commentary around memory and storage costs, since those inputs have been a key swing factor for PC makers.[2] A signal that pricing pressure is easing would fit neatly with the bullish historical seasonality, while fresh warnings on component inflation or demand softness would raise the odds that this cycle looks more like 2018, the lone losing year in the sample. The seasonal record is strong, but how HPQ trades through earnings, options positioning, and the policy calendar over the next few weeks will determine whether history rhymes this time.
Sources
- MarketWatch - HPQ Stock Price | HP Inc. Stock Quote (U.S.: NYSE) | MarketWatch
- Zacks - HPQ to Report Q2 Earnings: What's in the Cards for the Stock?
- ChartMill - HPQ Stock Price, Quote & Chart | ChartMill.com
- Barchart - HP Inc. Has Unusual Put Option Activity - A 7.4% Short-Put Yield - But Is It a Trap?
- Zacks - HPQ: HP - Greek Montage - Zacks.com
- Zacks - Dividend History - HP (HPQ) - Zacks.com
- Seeking Alpha - HP Stock Is A High Yielding Undervalued Tech Stock (Technical Analysis) (NYSE:HPQ)
About this seasonal analysis
Seasonal pattern data is sourced from TradeWave.ai, which analyzes historical price behavior across annual calendar windows going back up to 30 years. Read the full data methodology or the book The 100-Year Pattern by Afshin Moshrefi (2026 edition). Past performance of seasonal patterns does not guarantee future results. This article is for informational purposes only and does not constitute investment advice.