Marriott International (MAR) Has Risen in 7 of 7 Midterm Windows, Averaging 18.69% Gains
Marriott International is approaching a historically powerful midterm-year trading window just as the stock cools from record highs and investors digest a solid Q2 earnings beat.
Price as of Aug 13, 2026: $352.53 (last close).

What is the seasonal pattern for Marriott International (MAR)?
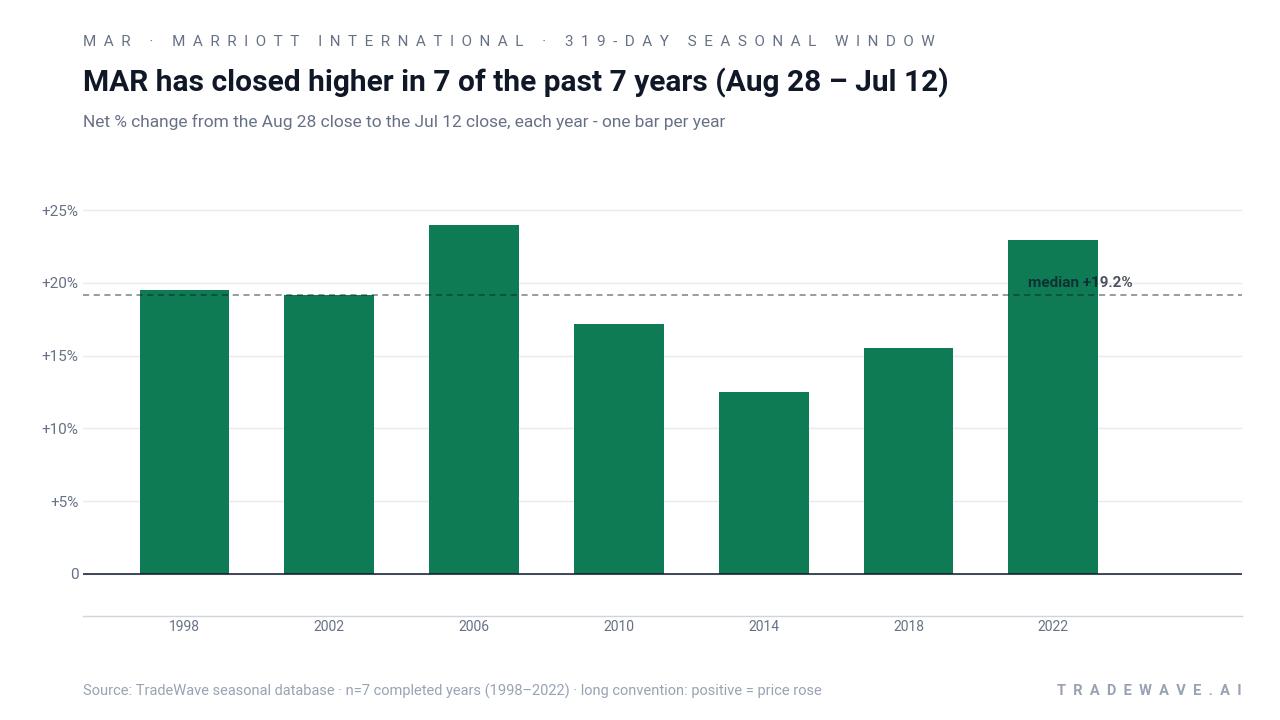
Marriott International has risen in 7 of 7 midterm-year Aug 28–Jul 12 windows, with an average gain of 18.69% in winning years.
- 7 for 7 in this window, with Marriott International averaging 18.69% gains across all winning years.
- Seasonal window runs 319 days from Aug 28 to Jul 12, grouped across the last 7 midterm election years.
- Percent Profitable is 100%, with 7 winners and 0 losers in the historical sample.
- Annualized return for the pattern is 18.63%, compounding to a 230% cumulative gain when the window is stacked over time.
- TradeWave Ratio (TWR) of 2.44 signals that price has typically traveled meaningfully in the long direction within the window.
- Sharpe ratio of 3.76 reflects strong risk-adjusted returns for this specific Marriott International seasonal trend.
According to historical data from TradeWave.ai, this midterm-year stretch for Marriott International has behaved very differently from an average calendar year, with a distinct long-biased pattern that traders rarely see discussed in standard research.
How strong is the upcoming seasonal window for Marriott International (MAR)?
Marriott International has closed higher in every single Aug 28–Jul 12 window across the last seven midterm election years, averaging gains of 18.69% for long positions. Shares finished Thursday at 352.53, down 0.6% on the day and about 14.2% below the 52-week high of 410.98, even after a 14.1% advance year to date.[1] That combination of a cooling price near record territory and a historically powerful long seasonal regime is what makes this late-August setup stand out on the lodging sector calendar.
Because this pattern is grouped by the presidential election cycle, it only looks at midterm election years, not every calendar year. That matters for a company like Marriott, where travel demand, corporate budgets and policy uncertainty around taxes and regulation can all ebb and flow with the political calendar.
This seasonal window begins on Aug 28 and spans 319 days into Jul 12 of the following year. Historically, during this period in midterm election years, Marriott International has shown a strong long bias, with 7 winners and 0 losers and an annualized return of 18.63%. The average winning year delivered a 19.16% median gain, and the 230% cumulative return from stacking the window across cycles shows how persistent the pattern has been.
The per-year breakdown shows that strength has not been confined to a single outlier. The weakest net gain in the sample was 12.49% in 2014, while the strongest was 23.96% in 2006. In 2022, a midterm year that was choppy for many cyclicals, Marriott still posted a 22.99% gain across this same Aug 28–Jul 12 stretch, underscoring how resilient the MAR seasonal trend has been in this phase of the election cycle.
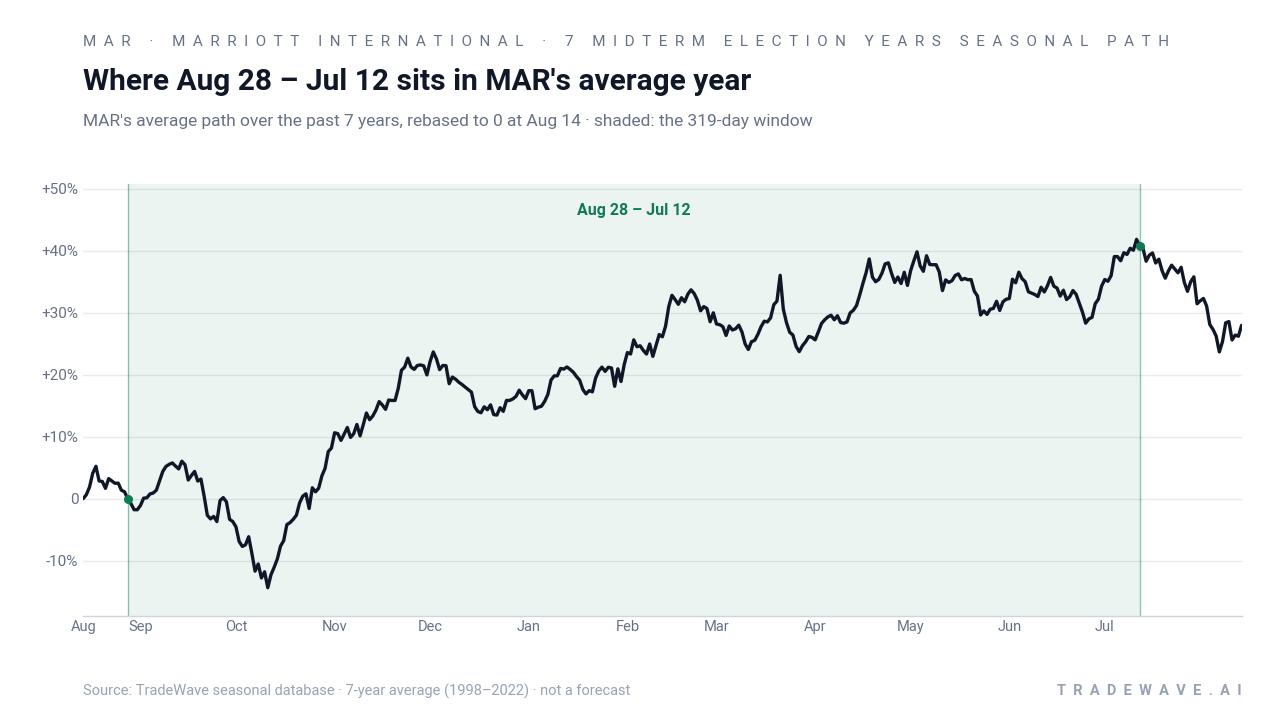
The historical seasonal average suggests that gains have tended to accrue steadily rather than in a single burst. The shaded window in the trend chart shows Marriott typically grinding higher through much of the period, which aligns with a long trade direction that benefits from compounding rather than quick flips.
Yearly net and intraperiod swings show how upside and downside have coexisted inside this otherwise consistent pattern.
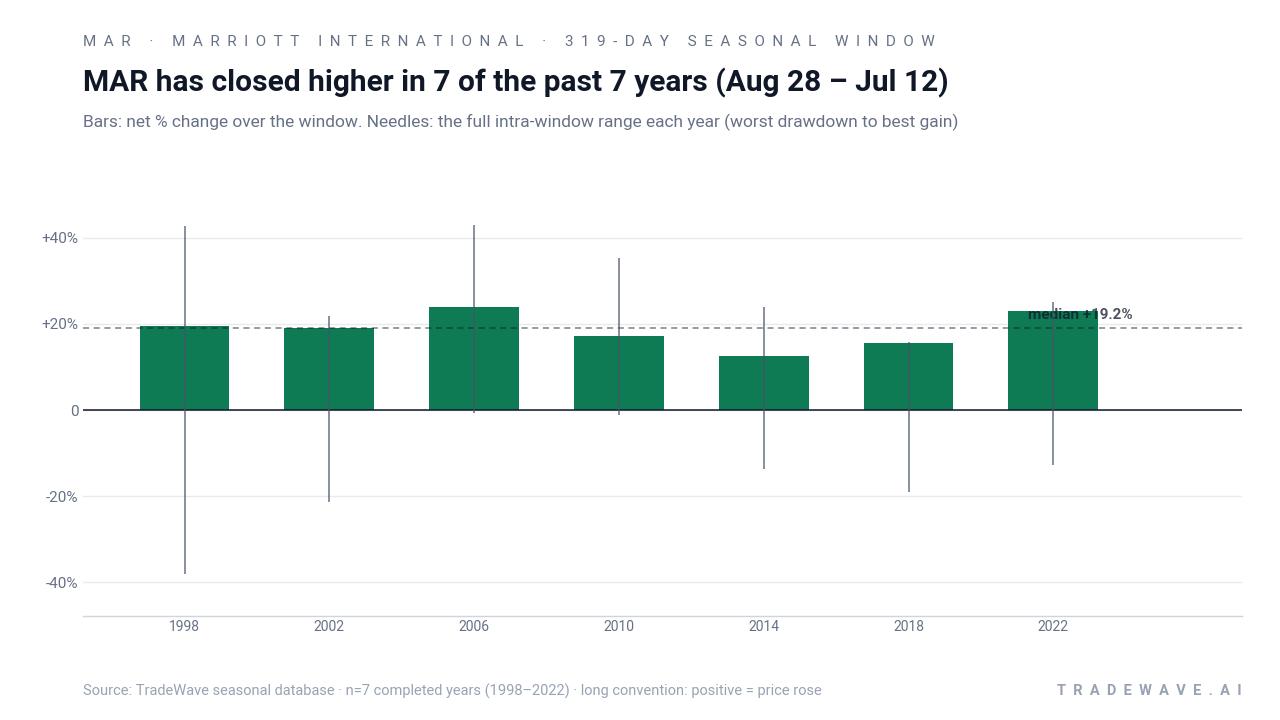
The intraperiod ranges are a reminder that even a perfect 7-for-7 record has come with real volatility. In 1998, for example, Marriott’s best move within the window reached 42.85% while the worst drawdown from entry was a deep 38.0% before the stock finished up 19.55%. In 2006, the maximum favorable move was again above 40%, but the worst drawdown was just 0.6%, showing how some cycles offered smoother rides while others demanded more risk tolerance.
Across the sample, maximum favorable excursions have often run into the mid-20% to low-40% range, while maximum adverse excursions have ranged from low single digits to roughly 20% in weaker stretches. That mix is what drives the high TradeWave Ratio of 2.44 and the Sharpe ratio of 3.76: the window has historically offered meaningful upside with drawdowns that, while sometimes sharp, have been manageable for long holders who could sit through volatility.
Add it up: seven midterm election years, seven gains, and a long window that has repeatedly rewarded patience for Marriott shareholders.
Why does Marriott International (MAR) follow this seasonal pattern?
One likely driver is the way travel and lodging demand lines up with the corporate and consumer calendar in midterm election years. Analysts have pointed to budget resets, conference schedules and international travel planning that often ramp from late summer into the following summer, supporting hotel operators even when broader markets are choppy.[4] This pattern may also reflect institutional portfolio rotation into quality travel names as policy uncertainty around midterms clears and investors position for the historically stronger pre-election year that follows.
History does not guarantee future results; adverse excursions can be large even in winning windows, and past drawdowns show that timing and risk management still matter inside this pattern.
What is driving Marriott International (MAR) today?
Marriott shares closed at 352.53 on Thursday, down 2.05 points or 0.6% on the session, leaving the stock about 14.2% below its 52-week high of 410.98 and still up 14.1% year to date.[1] The pullback comes less than two weeks after the company reported Q2 2026 revenue of $7.07 billion, up 4.8% year over year, with adjusted EPS of $3.19 that beat estimates by roughly 3.6%, even as sales came in slightly below some analyst forecasts.[2][4] In the lodging sector, Marriott continues to be benchmarked against peers like Hilton and Hyatt as investors weigh valuation against steady travel demand and earnings growth.[1] On the positioning side, a recent filing showed EVP Peggy Roe selling 3,000 shares on May 18, 2026 at an average price of $361.56, a modest insider trim that still leaves her with nearly 20,000 shares and does not yet signal a broad insider exodus.[8]
The chart below situates the latest move in its recent multi-month context alongside the median 60-day seasonal path.
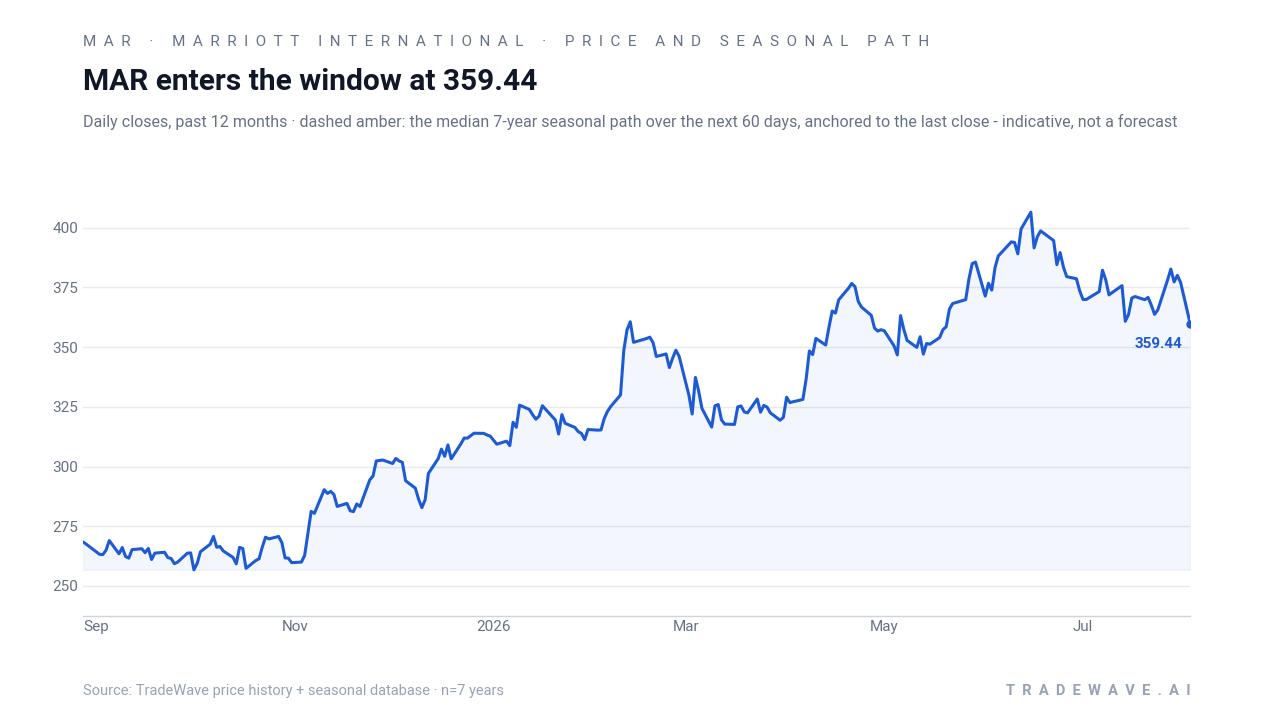
From a macro standpoint, the backdrop remains supportive for lodging. Recent coverage of Marriott’s results has emphasized ongoing revenue growth and EPS beats as travel demand normalizes at higher levels, even as investors debate how long the cycle can run.[2][4] With the next earnings report scheduled for Nov 3, 2026, the upcoming seasonal window will span at least two more quarterly updates, giving plenty of room for fundamentals and the historical pattern to either reinforce or contradict each other.
What should traders watch as this Marriott International (MAR) window opens?
First, the calendar: the 319-day midterm-year window kicks off on Aug 28 and runs through Jul 12, overlapping the transition from the midterm election year into the year before the presidential election. Historically, that shift has been a constructive backdrop for risk assets, and Marriott’s 7-for-7 record in this specific stretch lines up with that broader pattern.
Second, price levels. Traders will be watching whether MAR can reclaim its 50-day moving average near 375 and start closing the gap toward the 52-week high around 411, or whether the stock continues to consolidate in the mid-300s as the window begins.[1] A firming tape into and through the Aug 28 start date would be consistent with the historical seasonal trend, while a decisive break below recent lows would mark a clear departure from prior midterm-year behavior.
Third, earnings and macro catalysts. The Nov 3 earnings release will be the first major checkpoint inside the window, followed by any guidance updates on room rates, occupancy and loyalty program growth.[2][4] Stronger-than-expected commentary on travel demand would fit the historical pattern of solid midterm-year performance, while a surprise slowdown could test how much of the seasonal edge is tied to fundamentals versus flows.
Finally, insider and positioning signals. The May 18 sale by EVP Peggy Roe was small relative to her remaining stake, but traders will be alert for any acceleration in insider selling or a shift in analyst tone after the recent “Strong-Buy” rating move at China International Capital.[8] If insider activity stays muted and institutional support holds while the stock respects key support levels, that would echo the prior seven cycles where Marriott’s long seasonal window ultimately resolved higher despite interim volatility.
Sources
- Yahoo Finance (New Zealand), “Marriott International (MAR) stock price, news, quote and history,” Aug 13, 2026.
- Yahoo Finance (Zacks), “Marriott International (MAR) Reports Next Week: Wall Street Expects Earnings Growth,” Jul 31, 2026.
- Yahoo Finance (Zacks), “Marriott International (MAR) Earnings Expected to Grow: What to Know Ahead of Next Week's Release,” Apr 29, 2026.
- Barchart, “Marriott (NASDAQ:MAR) Reports Sales Below Analyst Estimates In Q2 CY2026 Earnings,” Aug 3, 2026.
- MarketBeat, “Marriott International (NASDAQ:MAR) Rating Increased to Strong-Buy at China Intl Cap,” Aug 13, 2026.
About this seasonal analysis
Seasonal pattern data is sourced from TradeWave.ai, which analyzes historical price behavior across annual calendar windows going back up to 30 years. Read the full data methodology or the book The 100-Year Pattern by Afshin Moshrefi (2026 edition). Past performance of seasonal patterns does not guarantee future results. This article is for informational purposes only and does not constitute investment advice.