Back-to-School Tailwind Lifts Target Corporation (TGT) Into a Historically Bullish Late-August Run
Target Corporation is heading into a historically strong late-August seasonal window just as shares trade near a 52-week high following a powerful Q2 2026 earnings beat and upgraded outlook.
Price as of Aug 24, 2026: $169.89 (last close).

What is the seasonal pattern for Target Corporation (TGT)?
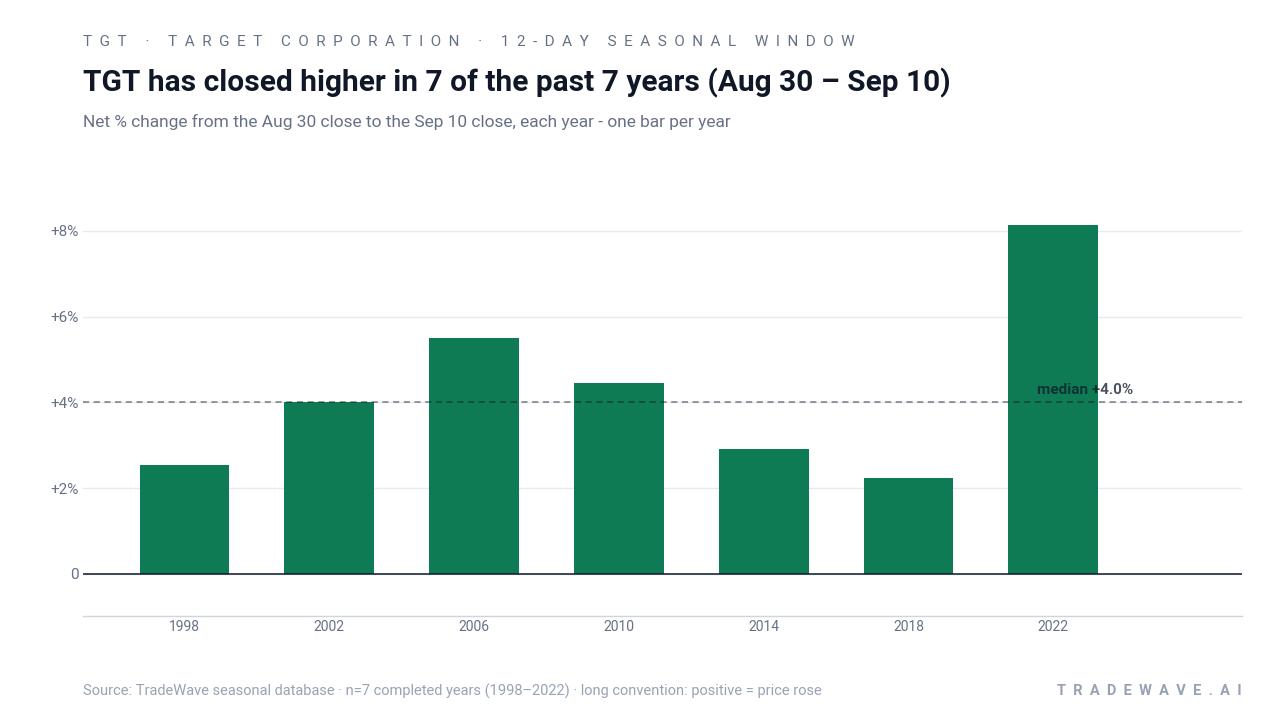
Target Corporation has risen in 7 of 7 midterm-year late-August windows, with an average gain of 4.26% in winning years.
- 7 for 7 in this window, averaging 4.26% gains in winning years across the last 7 midterm election years.
- The upcoming pattern runs from Aug 30 through Sep 10, a 12-day Target Corporation trading window that has historically favored the long side.
- Percent Profitable is 100%, with 7 winners and 0 losers in the historical sample.
- Average profit of 4.26% compares with a 33% cumulative gain when stacking this window across all seven cycles.
- The TradeWave Ratio of 1.44 signals that price has typically traveled meaningfully in the trade direction within the window.
- Intraperiod swings have included both solid run-ups and occasional drawdowns, so volatility inside the window has mattered even in winning years.
According to historical data from TradeWave.ai, this late-August stretch has behaved very differently from an average month for Target in past midterm election years. The next section walks through how that pattern has played out and where it sits in the current cycle.
How has Target Corporation (TGT) traded in this late-August midterm-year window?
Target Corporation has closed higher in every single Aug 30 to Sep 10 window across the last seven midterm election years, averaging a 4.26% gain for longs. Today the stock finished at 169.89, up 2.69% on the session and sitting about 0.5% below its 52-week high of 170.75. With the company in the middle of a turnaround and the calendar about to flip into a historically favorable slice of the year, the overlap between price momentum and this TGT seasonal trend is hard for traders to ignore.
Because this pattern is grouped by presidential election cycle, it only looks at midterm election years, not every calendar year. That matters for a retailer like Target, since midterm years often coincide with shifting fiscal policy debates and consumer confidence swings that can change how investors treat discretionary and staples names around the back-to-school and early fall period.
This seasonal window begins on Aug 30 and spans 12 days. Historically, during this period, Target Corporation has shown a strong bullish tendency for long positions, with all seven midterm-year samples finishing in positive territory. The average winner gained 4.26%, while the median outcome was a 4.01% rise, suggesting the distribution of returns has been fairly tight rather than driven by a single outlier year.
The per-year table shows that 2022 was the strongest instance, with an 8.13% net return from entry to exit, while 2018 was the softest at 2.23%. In 2002, the stock still finished the window up 4.01%, but it experienced a worst intraperiod drawdown of 5.85% from the entry level before recovering, a reminder that even “all green” windows can involve uncomfortable dips along the way.
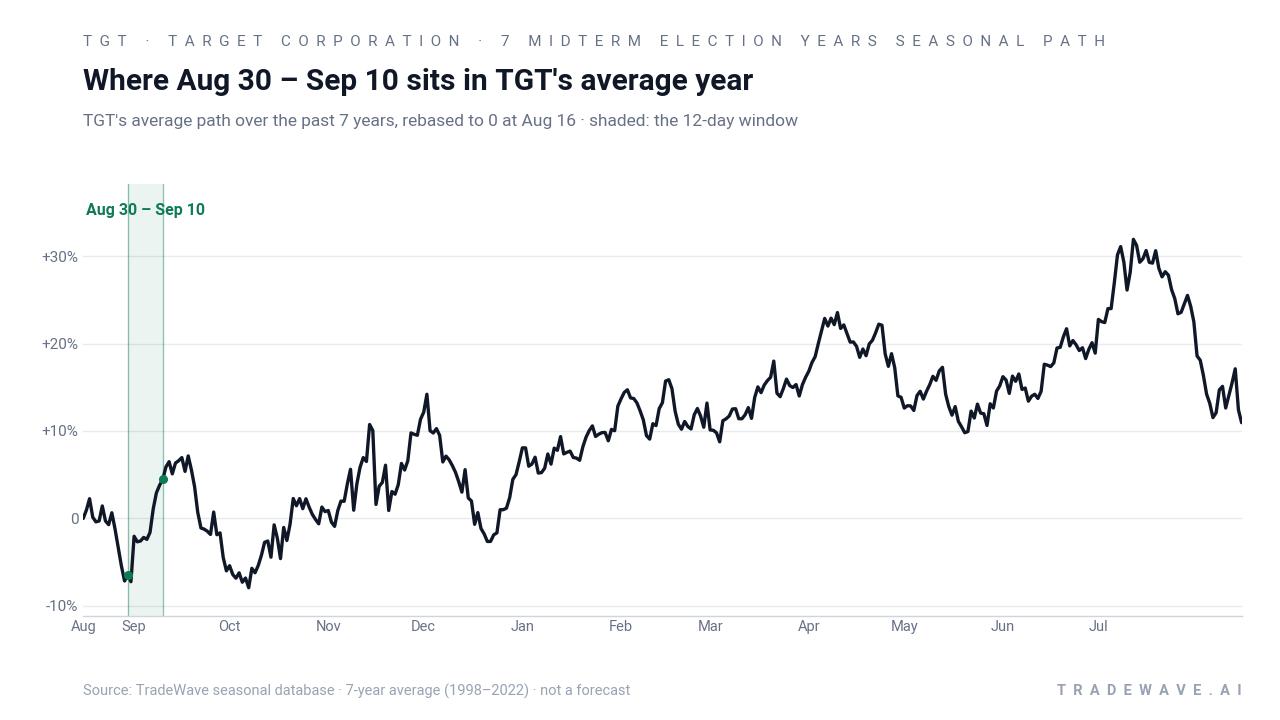
The historical seasonal average chart shows Target typically grinding higher into and through this late-August window, rather than spiking in a single day. Gains have tended to accrue across the bulk of the 12-day stretch, which fits a narrative of back-to-school and early fall positioning rather than a one-off catalyst.
Yearly net and intraperiod ranges highlight how upside and downside have both shown up inside this otherwise consistent window.
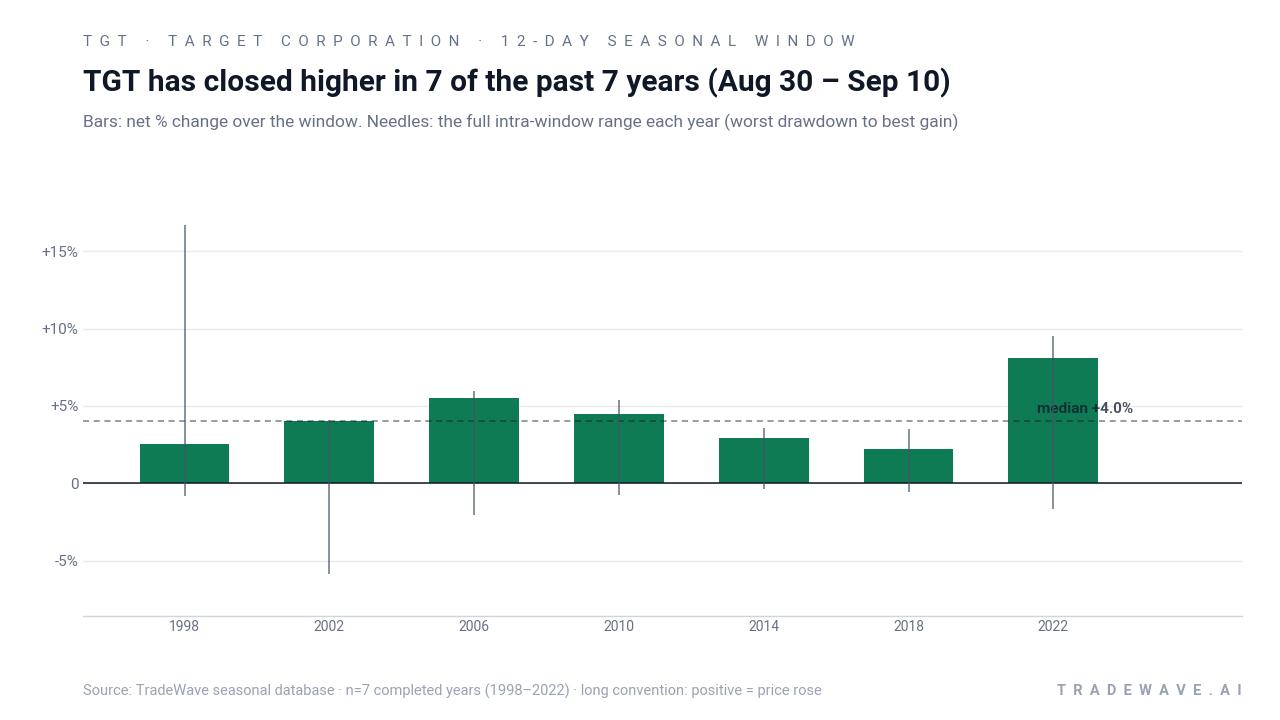
The combined net / MFE / MAE view shows that in most years, the maximum favorable move within the window has been meaningfully larger than the final net gain, which means traders often saw bigger unrealized profits at some point during the stretch. At the same time, the worst adverse excursions have generally been modest, with only 2002 showing a notably deep drawdown before finishing higher. Add it up and you get a 33% cumulative gain across the seven midterm-year windows, paired with a Sharpe ratio of 2.01 that points to unusually strong risk-adjusted performance for this specific slice of the calendar.
History does not guarantee future results; adverse excursions (MAE) can be large even in winning windows.
Why does Target Corporation (TGT) follow this seasonal pattern?
One likely driver is the clustering of back-to-school and early fall shopping, which can lift expectations for big-box retailers just as investors refine their views on holiday demand. Analysts have also pointed to portfolio repositioning around midterm election years, when policy uncertainty and rate debates can push investors toward or away from consumer names in tight windows. This pattern may reflect that combination of consumer spending cycles and institutional rotation, which has repeatedly lined up with late August on the Target calendar.
What is driving Target Corporation (TGT) today?
Target shares closed at 169.89 on Tuesday, up 2.69% on the day and about 0.5% below the stock’s 52-week high of 170.75, after a powerful run that has left the one-month return at 22.92%. The move comes less than a week after Target reported Q2 2026 results that beat Wall Street estimates on both sales and earnings, with net sales up 5.3% year over year to 26.5 billion and adjusted EPS of 2.46 topping LSEG expectations of 2.33.[1][5] Management raised full-year sales and profit guidance and highlighted that price cuts and merchandising changes are driving traffic and early back-to-school strength, while tariff refunds added a sizable one-time boost to margins.[1][5]
Heading into this late-August Target Corporation trading window, the macro backdrop is still challenging for retailers. Coverage around the earnings release noted that consumers are spending more cautiously under ongoing macroeconomic pressure, which makes Target’s execution on price and assortment critical to regaining wallet share.[3] At the same time, the sector’s competitive landscape remains intense, with Walmart and Kroger pushing hard on value and Target responding by cutting prices on roughly 10,000 items to sharpen its edge with budget-conscious shoppers.[1] In December 2025, Reuters also reported that activist investor Toms Capital had built a stake and was pressuring the company amid earlier sales declines, following a restructuring that eliminated about 1,800 corporate roles to streamline decision-making and fund store investments.[4][6]
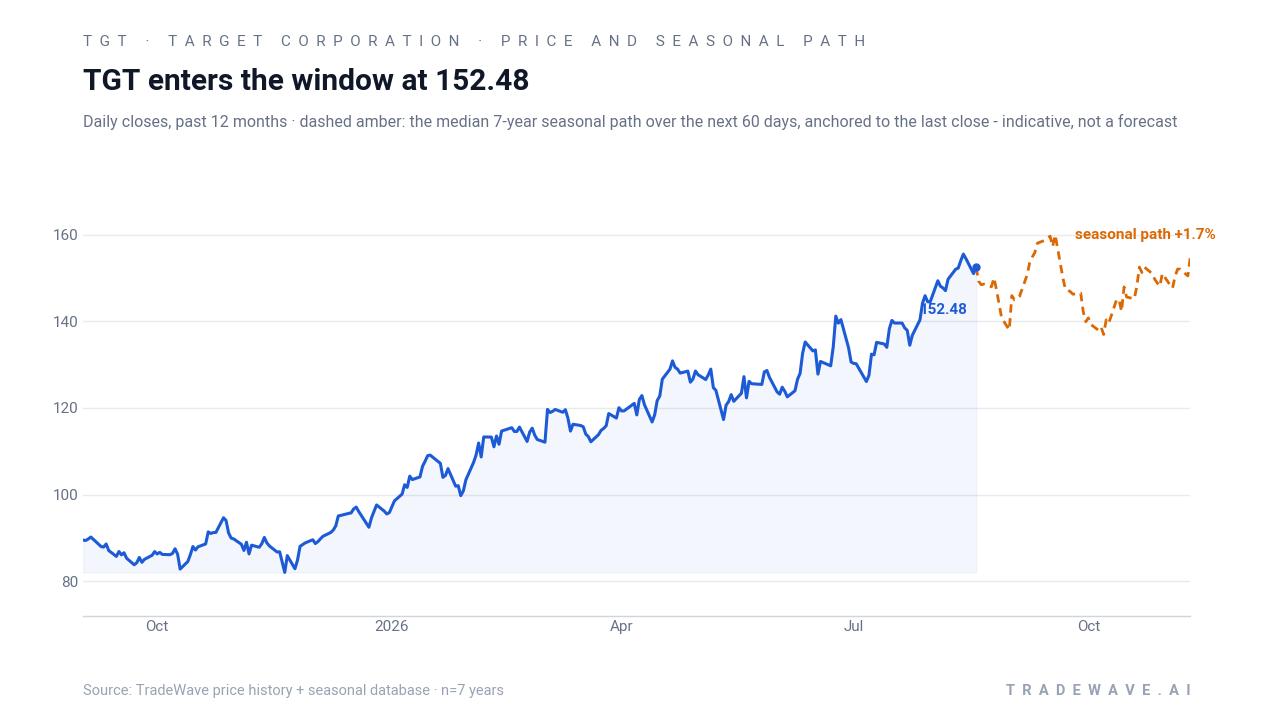
The chart below situates the latest move in its recent multi-month context alongside the historical seasonal projection.
What should traders watch as this Target Corporation seasonal window opens?
First, watch how TGT behaves as the Aug 30 window opens with the stock already near a 52-week high. A clean hold above the recent breakout zone and continued respect for intraday pullbacks would be more consistent with the historical pattern of steady gains across the 12-day stretch, while a sharp reversal or heavy selling into strength would mark a clear departure from prior midterm-year behavior.
Second, keep an eye on fundamental catalysts that intersect with this seasonal regime. Any follow-up commentary from management on back-to-school trends, promotional intensity, or tariff refund timing could either reinforce or undercut the bullish historical seasonality that has accompanied this period in the past.[1][5] Given the competitive pressure from Walmart and Kroger, incremental news on price perception or traffic share could matter more than usual for how investors treat this window.[1]
Third, monitor volume and liquidity as the pattern unfolds. While earlier coverage referenced trading ranges and volume figures for Target, it did not flag a clear, sustained volume spike, so a meaningful pickup in activity during this window would be a fresh signal rather than a continuation of an existing special flow.[2] If higher volume lines up with price strength, it would echo the historical tendency for this period to reward long exposure; if it appears alongside downside volatility, it would suggest that this midterm-year iteration is breaking from the script.
Finally, place this TGT seasonal trend in the broader election-cycle context. The market is in a midterm election year, and this late-August window sits near the point where investors often start looking ahead to the pre-election year, which has historically been friendlier for equities. If Target can sustain its turnaround narrative and hold recent gains through this historically strong window, it would strengthen the case that the stock is transitioning from repair mode into a more durable uptrend as the cycle shifts.
Sources
- Yahoo Finance - Target delivers earnings beat, CEO 'encouraged' by turnaround traction - Yahoo Finance
- CNBC - Check out Target Corp's stock price (TGT) in real time - CNBC
- CNBC - Target is set to report earnings before the bell. Here's what to expect - CNBC
- Nasdaq (Zacks via Nasdaq) - Target Restructures Workforce: Will the Bold Move Pay Off? - Nasdaq
- Reuters - Target lifts annual forecasts again as Fiddelke's turnaround takes root - Reuters
- Reuters - Target faces activist investor pressure amid sales decline, FT reports - Reuters
About this seasonal analysis
Seasonal pattern data is sourced from TradeWave.ai, which analyzes historical price behavior across annual calendar windows going back up to 30 years. Read the full data methodology or the book The 100-Year Pattern by Afshin Moshrefi (2026 edition). Past performance of seasonal patterns does not guarantee future results. This article is for informational purposes only and does not constitute investment advice.