Amphenol (APH) Has Risen in 8 of 8 Midterm Sep-Apr Windows, Averaging 14.31% Gains
Amphenol is heading toward a historically strong 212-day trading window even as shares sit below record highs after an AI-fueled run.
Price as of Aug 3, 2026: $163.34 (last close).

What is the seasonal pattern for Amphenol (APH)?
Amphenol has risen in 8 of 8 midterm-year Sep 3–Apr 2 windows, with an average gain of 14.31% in winning years.
- 8 for 8 in this window, with Amphenol averaging 14.31% gains in winning years across the last 8 midterm election cycles.
- Percent Profitable is 100%, with 8 winners and 0 losers in the Sep 3–Apr 2 trading window grouped by midterm election years.
- The trade direction is long, with a cumulative return of 189% from repeatedly holding this 212-day window across the sample.
- Median profit of 13.41% and a Sharpe ratio of 2.45 point to a historically strong risk‑adjusted profile for this APH seasonal trend.
- The TradeWave Ratio of 2.25 suggests price has typically traveled meaningfully in the trade direction within the window, not just at the close.
- Individual years have still seen sizable intraperiod drawdowns, with worst adverse moves reaching more than 20% in some cycles before finishing higher.
According to historical data from TradeWave.ai, this upcoming midterm-year stretch for Amphenol behaves very differently from an average calendar period, and the next iteration is less than a month away.
How has Amphenol (APH) traded in past midterm-year Sep–Apr windows?
Amphenol has closed higher in every single Sep 3–Apr 2 window across the last eight midterm election years, averaging 14.31% gains for long positions. Today the stock finished at 163.34, up 1.64% on the session and sitting about 8.5% below its 52-week high of 178.52 while still up 19.81% year to date.[1]
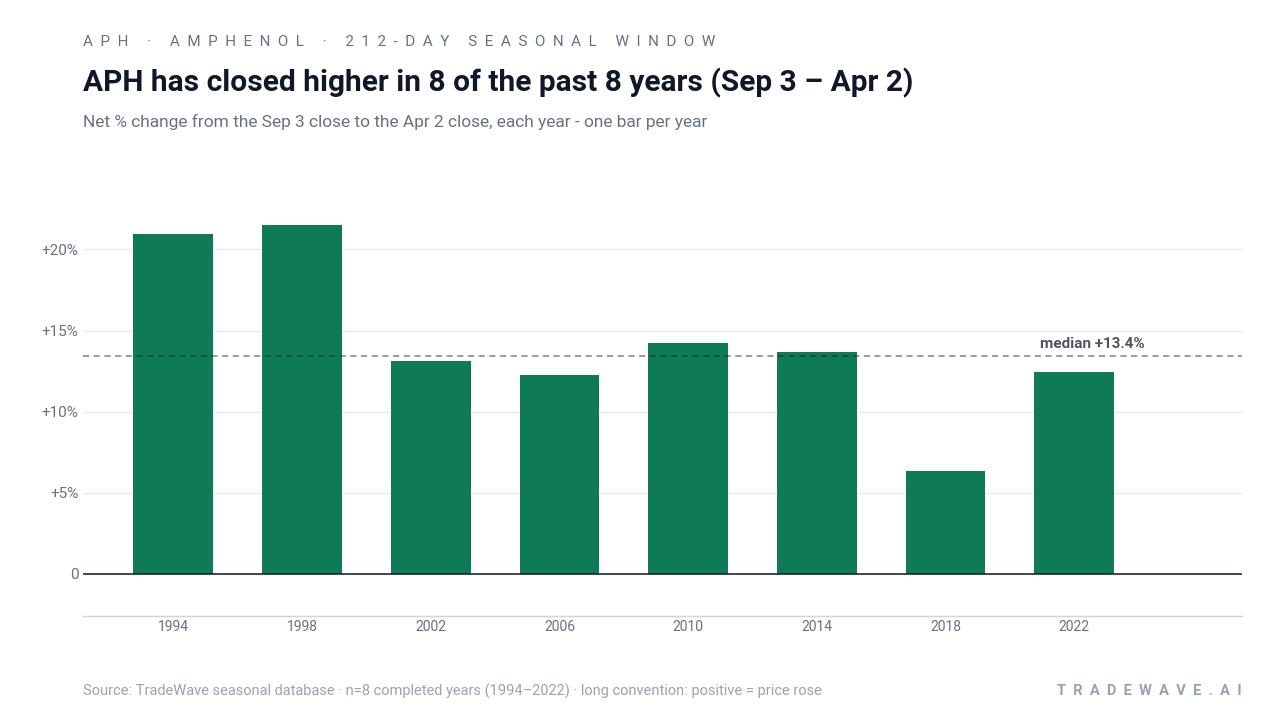
Because this pattern is grouped by the presidential election cycle, it specifically tracks how Amphenol behaves from early September of a midterm election year into early April of the following pre-election year. That matters in 2026 because the market is currently in the midterm election year, and this 212-day window that begins on Sep 3 has historically captured a distinct phase where policy uncertainty fades and risk appetite often rebuilds.
The trade direction for this APH seasonal trend is long. Across the eight completed midterm-year windows since 1994, Percent Profitable is 100%, with 8 winners and 0 losers. Average profit across those winning years is 14.31%, with a median outcome of 13.41%, and the cumulative return from stacking the window each cycle reaches 189%.
Individual years show a wide but consistently positive range of outcomes. The strongest net gain in the sample came in 1998, when Amphenol returned 21.48% between the Sep 3 entry and the Apr 2 exit, while the softest year was 2018 with a still-positive 6.33% net move. Add it up: eight for eight, with no outright losing years in this specific Amphenol trading window.
Intraperiod swings have been meaningful. Maximum favorable excursions, which capture the best point-to-peak move within each window, have ranged from 6.46% in 2018 to 31.75% in 1994, showing that upside bursts often overshoot the final close. On the downside, maximum adverse excursions have reached as deep as a 25.56% drawdown in 2002 and 20.31% in 2018 before the stock recovered to finish the window in the green, underscoring that even a strong historical seasonality can involve sharp pullbacks.
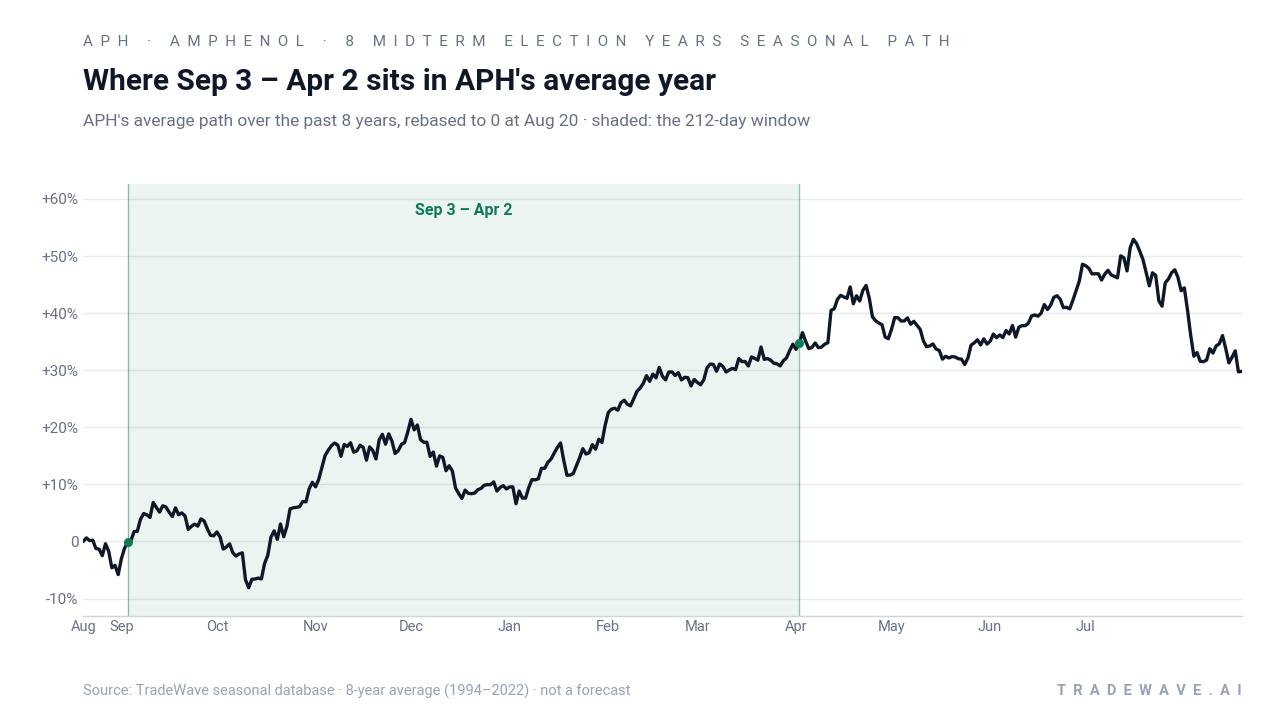
The historical seasonal average path suggests that gains in this APH seasonal trend have tended to build gradually rather than in a single spike. The shaded window in the trend chart shows a steady upward bias from early September through late winter, with some choppiness but no persistent late-window giveback in the average profile.
Year-by-year ranges highlight how much Amphenol has typically moved inside the window before settling at its final gain.
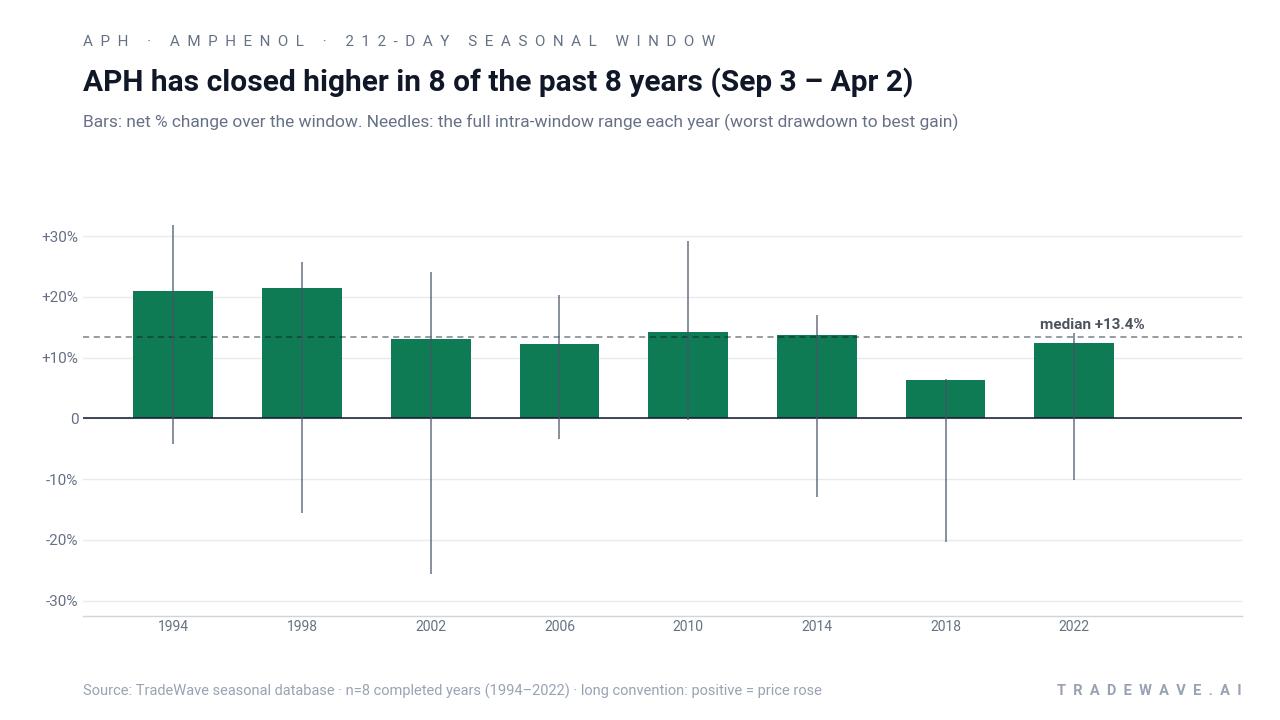
The combined net/MFE/MAE view shows a clear pattern: every bar ends positive, but the needles stretch far in both directions in several years. Large maximum favorable moves alongside sizable maximum adverse moves point to a high-variance window where Amphenol has often swung sharply before ultimately finishing higher, which aligns with a TradeWave Ratio of 2.25 and a Sharpe ratio of 2.45 for this setup.
History does not guarantee future results; adverse excursions can be large even in winning windows, and past seasonal behavior may not repeat.
Why does Amphenol (APH) follow this seasonal pattern?
One likely driver is the way Amphenol’s earnings calendar and capital spending cycles line up with the broader presidential election pattern. Midterm-year autumn often coincides with visibility on next year’s tech hardware budgets, while the following pre-election spring has historically seen stronger risk appetite for growth and AI infrastructure themes.[2][7] This APH seasonal trend may also reflect institutional portfolio repositioning into high-quality interconnect names as policy uncertainty around regulation and fiscal priorities begins to clear late in the midterm year.
What is driving Amphenol (APH) today?
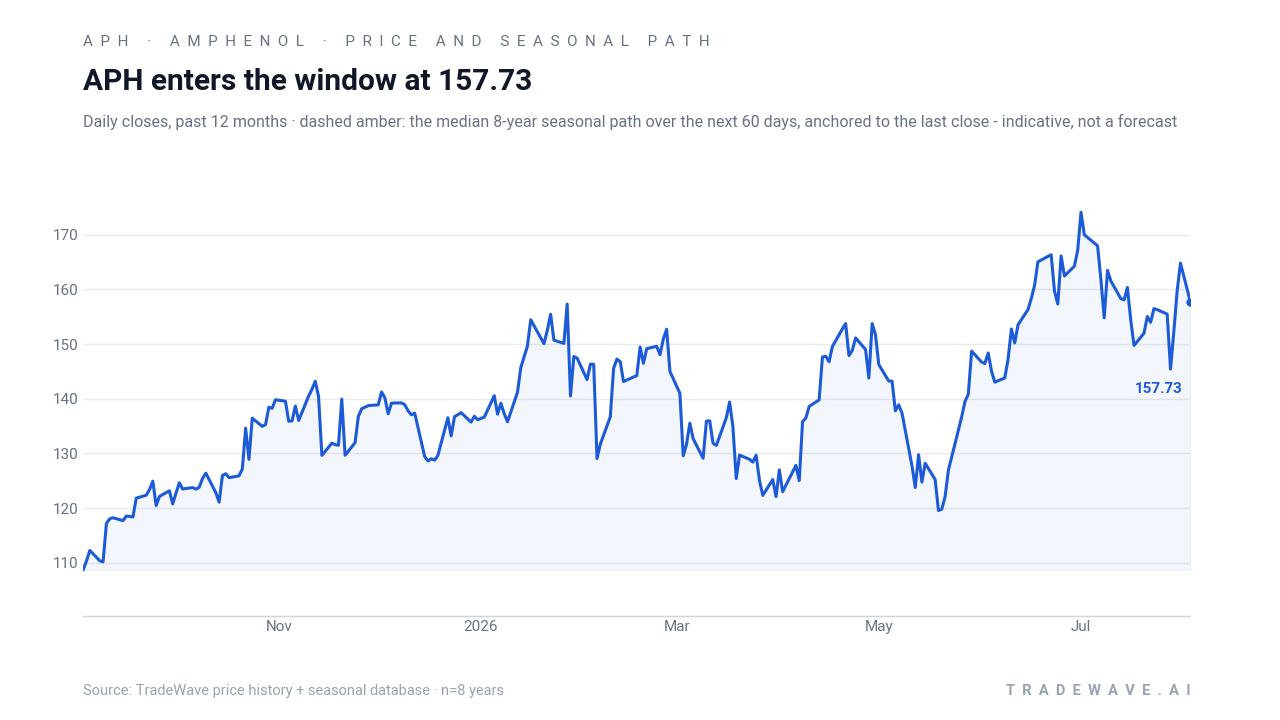
Amphenol shares closed at 163.34 on Tuesday, up 1.64% on the day and roughly 8.5% below their 52-week high of 178.52, after climbing 19.81% so far in 2026.[1] The move extends a powerful run that has been fueled by surging demand for interconnect solutions tied to AI and data center buildouts, which several analysts have highlighted as a core growth engine for the company.[2][7]
The latest fundamental checkpoint came around Jul 29, when Amphenol reported its second-quarter results for 2026. Ahead of that release, analysts were looking for revenue growth of about 46.8% year over year, following a prior quarter in which the company delivered $7.62 billion in revenue, up 58.4% from a year earlier and ahead of expectations.[2] Coverage around the print pointed to continued strength in datacom and AI-related demand, and several firms nudged price targets higher while reiterating positive views on the stock’s positioning in tech hardware and electronics.[2][3][7]
Valuation has been a recurring talking point. In late July, Simply Wall St’s analysis, syndicated via Yahoo Finance, noted that analyst target increases had led to a modest lift in fair value estimates for Amphenol, reflecting both the strong earnings trajectory and the stock’s pullback from earlier highs.[3] Morningstar’s Jul 29 report described Amphenol as a “best-of-breed” interconnect supplier with surging AI-driven growth, framing the company as a structural winner in networking and storage infrastructure rather than a short-term cyclical trade.[7]
On the technical side, APH’s recent consolidation has played out against a backdrop of heavy trading volume and a 20-day average volume near 6.9 million shares, with the stock holding above its 50-day moving average around 154.55.[1][8][9] That keeps the trend firmly bullish heading into late summer, even as the stock digests gains and trades below its peak.
Corporate behavior has been more nuanced. GuruFocus reported that insiders sold about $18.7 million of Amphenol shares over the past three months, a notable amount but one that came as the stock rallied strongly and approached record territory.[11] For many investors, that selling is a reminder to separate long-term structural growth in AI hardware from shorter-term positioning and profit-taking.
The chart below situates the latest move in its recent multi-month context alongside the historical seasonal projection.
What should traders watch as the Sep 3 seasonal window approaches?
First, the calendar. The next iteration of this 212-day APH seasonal trend opens on Sep 3, carrying an eight-for-eight track record of positive outcomes in prior midterm election years. Traders will be watching whether the stock’s current consolidation below its 52-week high turns into a base that resembles earlier cycles where gains built steadily from early September into the pre-election spring.
Second, earnings and AI demand. Any follow-up commentary from management or analysts on data center and AI infrastructure spending will matter, especially if it confirms that the revenue growth seen around the latest Q2 report can persist into 2027.[2][7] Stronger or weaker guidance as the year progresses could either reinforce or challenge the historical seasonality that has favored longs in this window.
Third, price levels and volatility. The 50-day moving average near 154.55 and the 52-week high at 178.52 are natural reference points for how Amphenol behaves as the window opens.[1] Historically, some years have seen drawdowns of more than 20% inside the window before finishing higher, so traders may focus less on whether the stock dips and more on how quickly it recovers relative to past patterns.
Finally, insider and positioning trends. The recent $18.7 million in insider selling will be worth revisiting if it accelerates or reverses as the seasonal window begins.[11] A slowdown in selling or a shift toward insider buying during the Sep–Apr stretch would sit comfortably alongside the historical bullish APH seasonal trend, while continued heavy selling could signal a break from the pattern even if the broader election-cycle backdrop remains supportive.
Sources
- MarketWatch, “Amphenol Corp. Cl A Stock Quote (U.S.: NYSE) - APH”, Aug 3, 2026.
- Yahoo Finance, “Earnings To Watch: Amphenol (APH) Reports Q2 Results Tomorrow”, Jul 29, 2026.
- Yahoo Finance / Simply Wall St, “Amphenol (APH) Stock Sees Modest Fair Value Lift After Analyst Target Increases”, Jul 29, 2026.
- Simply Wall St, “Assessing Amphenol (APH) Valuation After Recent Share Price Pullback”, Feb 6, 2026.
- Morningstar, “Amphenol Is Best-of-Breed in Interconnect With Surging Growth From AI”, Jul 29, 2026.
- Barchart, “APH Technical Analysis for Amphenol Corp Stock - Barchart.com”, Aug 1, 2026.
- Barchart, “APH - Amphenol Corp Stock Price - Barchart.com”, Aug 1, 2026.
- GuruFocus, “Amphenol Corp (APH) Shares Surge 4.5% -- What GF Score of 96 Tells Investors”, Jul 29, 2026.
About this seasonal analysis
Seasonal pattern data is sourced from TradeWave.ai, which analyzes historical price behavior across annual calendar windows going back up to 30 years. Read the full data methodology or the book The 100-Year Pattern by Afshin Moshrefi (2026 edition). Past performance of seasonal patterns does not guarantee future results. This article is for informational purposes only and does not constitute investment advice.