Lilly (Eli) (LLY) Has Risen in 13 of 13 Midterm Aug-Apr Windows, Averaging 15.81% Gains
Lilly (Eli) is hovering just below record highs as it approaches a 238-day midterm-year seasonal window that has never been negative in the historical sample.
Price as of Aug 24, 2026: $1,246.93 (last close).

What is the seasonal pattern for Lilly (Eli) (LLY)?
Lilly (Eli) has risen in 13 of 13 midterm-year Aug. 31 to Apr. 25 windows, with an average gain of 15.81% in winning years.
- 13 for 13 in this window, with Lilly (Eli) averaging 15.81% gains across all winning years.
- The upcoming seasonal window runs from Aug. 31, 2026 through Apr. 25, 2027, spanning 238 calendar days in the midterm election year.
- Percent Profitable is 100%, with 13 winners and 0 losers across the last 13 midterm election-year cycles.
- Average annualized return in the window is 15.59%, with a Sharpe ratio of 1.74 based on end-of-window outcomes.
- The TradeWave Ratio of 2.08 signals that price has typically traveled meaningfully in the long direction within the window, even before final closes.
- Individual years have seen sizable intraperiod swings, with some windows experiencing double-digit drawdowns before finishing higher.
According to historical data from TradeWave.ai, this stretch of the calendar has behaved very differently from an average year for Lilly (Eli). The next section walks through how that midterm-year pattern has played out in past cycles.
How has Lilly (Eli) (LLY) traded in this midterm-year window?
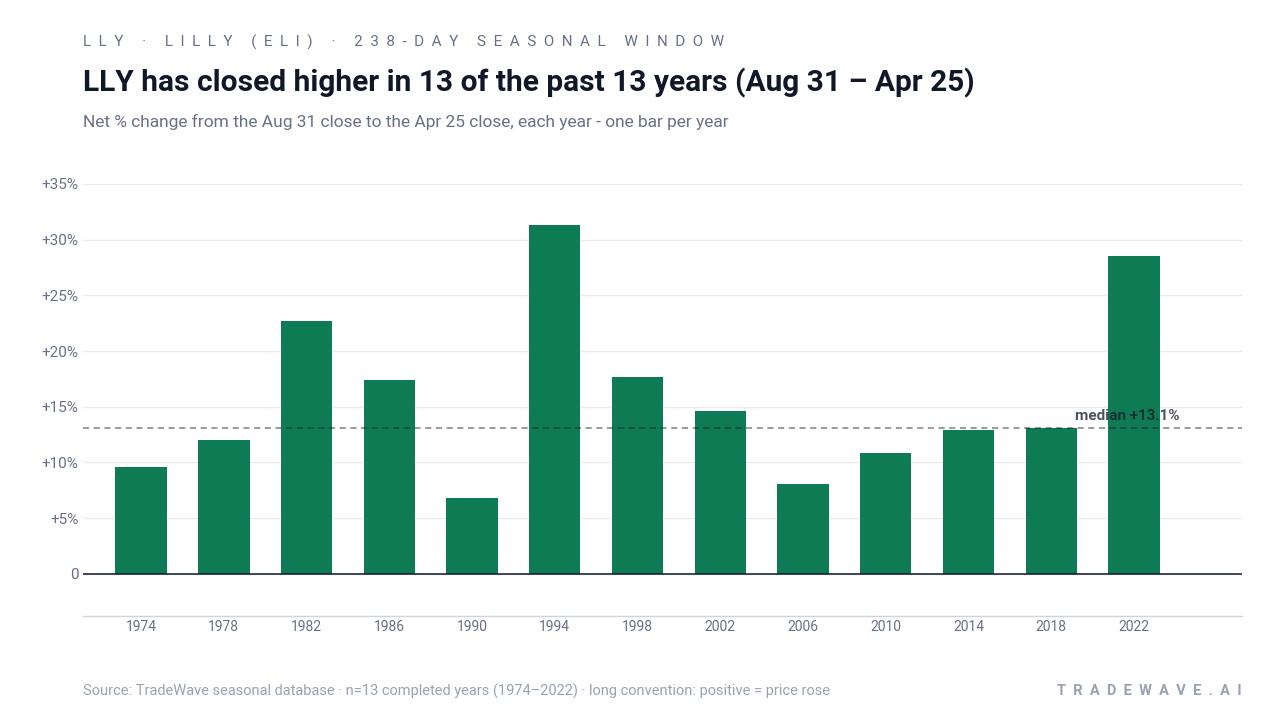
Lilly (Eli) has posted gains in every one of the last 13 midterm election-year windows running from Aug. 31 to Apr. 25, averaging a 15.81% rise over the 238-day stretch. Shares finished the prior session at 1,246.93, leaving the stock about 3.5% below its 52-week high of 1,292.65 and far above its 52-week low near 685.56. That combination of a clean seasonal record and a price sitting close to the top of its range gives this year’s window unusual weight for traders watching the LLY seasonal trend.
Because this pattern is grouped by the presidential election cycle, it reflects how Lilly has behaved specifically in the year before the presidential election, not just in any random 12-month span. Midterm election years often bring policy noise around drug pricing and Medicare coverage, followed by a more risk-on tone as markets pivot toward the pre-election year, and this window sits squarely in that transition.
The trade direction for this setup is long, and the historical record is unusually clean: 13 winners, 0 losers, and a 100% Percent Profitable reading across the last 13 midterm election-year samples. Average profit of 15.81% means that, from the Aug. 31 close to the Apr. 25 close, Lilly has typically added mid-teens gains, with a median outcome of 13.08% that keeps the distribution from being skewed by a single outlier year.
Individual years show a wide but consistently positive range. The strongest window in the sample delivered a 31.28% net gain in 1994, while 2022 logged a 28.51% rise from entry to exit. On the softer side, 1990 still finished up 6.83%, underscoring that even the weakest midterm-year iteration in this slice of the calendar has historically been positive for long exposure.
Intraperiod swings have been meaningful. In 1986, Lilly’s best point-to-peak move within the window, known as the maximum favorable excursion, reached 35.16%, but the worst drawdown from entry, or maximum adverse excursion, hit -15.37% before the stock recovered. Several other years, including 1990 and 2006, saw double-digit adverse moves at some point in the window even though they ultimately closed higher.
Other cycles have been smoother. In 2010, the worst intraperiod move was actually a small positive 0.71%, meaning the stock never traded below its Aug. 31 entry level during that window, while still finishing up 10.88%. Years like 1994 and 1998 combined strong maximum favorable excursions of 42.02% and 49.41% with relatively shallow drawdowns of -2.41% and -2.85%, showing that some midterm-year windows have delivered powerful upside with limited downside noise.
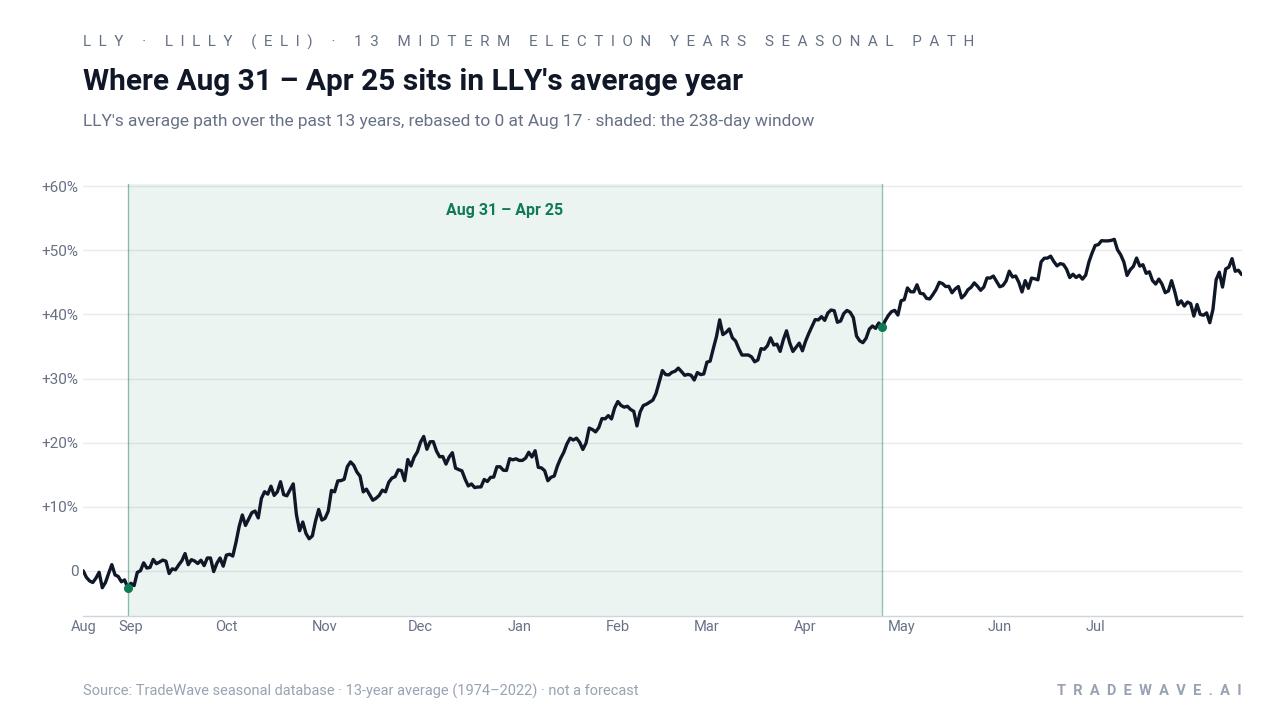
The historical seasonal average path suggests that gains in this window have tended to build steadily rather than arriving in a single burst. The curve slopes higher across much of the 238 days, with only modest soft patches, which fits a pattern of sustained accumulation rather than a quick spike and fade.
A closer look at yearly net returns alongside intraperiod ranges shows how upside and drawdowns have coexisted in this window.
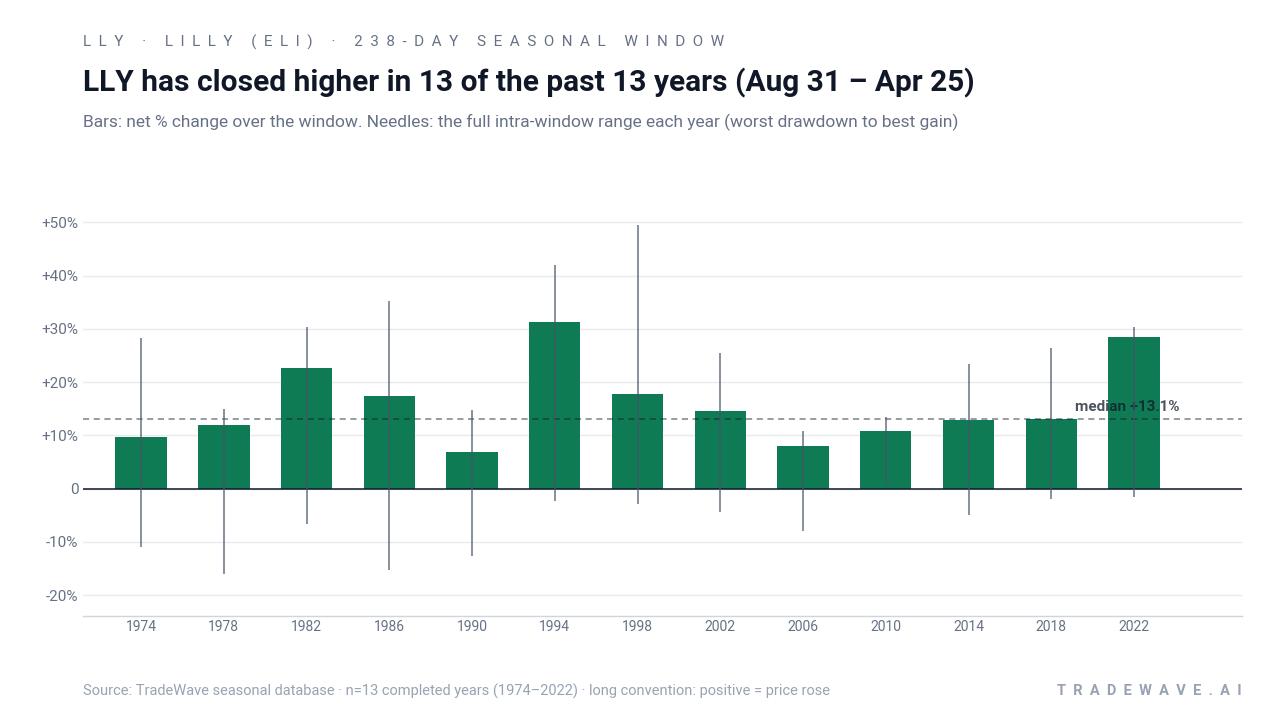
The combined net/MFE/MAE profile shows that while every bar ends above zero, the needles often stretch far in both directions, especially in earlier decades. Large maximum favorable moves paired with sizable maximum adverse excursions point to a high-variance environment where the long side has ultimately prevailed but not without turbulence along the way.
History does not guarantee future results; adverse excursions can be large even in winning windows, and past midterm-year behavior may not repeat.
Why does Lilly (Eli) (LLY) follow this seasonal pattern?
One likely driver is the clustering of key drug data, regulatory decisions and earnings updates for Lilly around the back half of the midterm election year and into the year before the presidential election, which can concentrate positive news flow into this window.[4] Analysts have also pointed to institutional portfolio repositioning around healthcare and obesity themes as policy clarity on Medicare coverage and drug pricing improves late in the midterm cycle.[3] The pattern may further reflect sector rotation into defensive growth names like large-cap pharma as investors balance election-year uncertainty with durable earnings stories.
What is driving Lilly (Eli) (LLY) today?
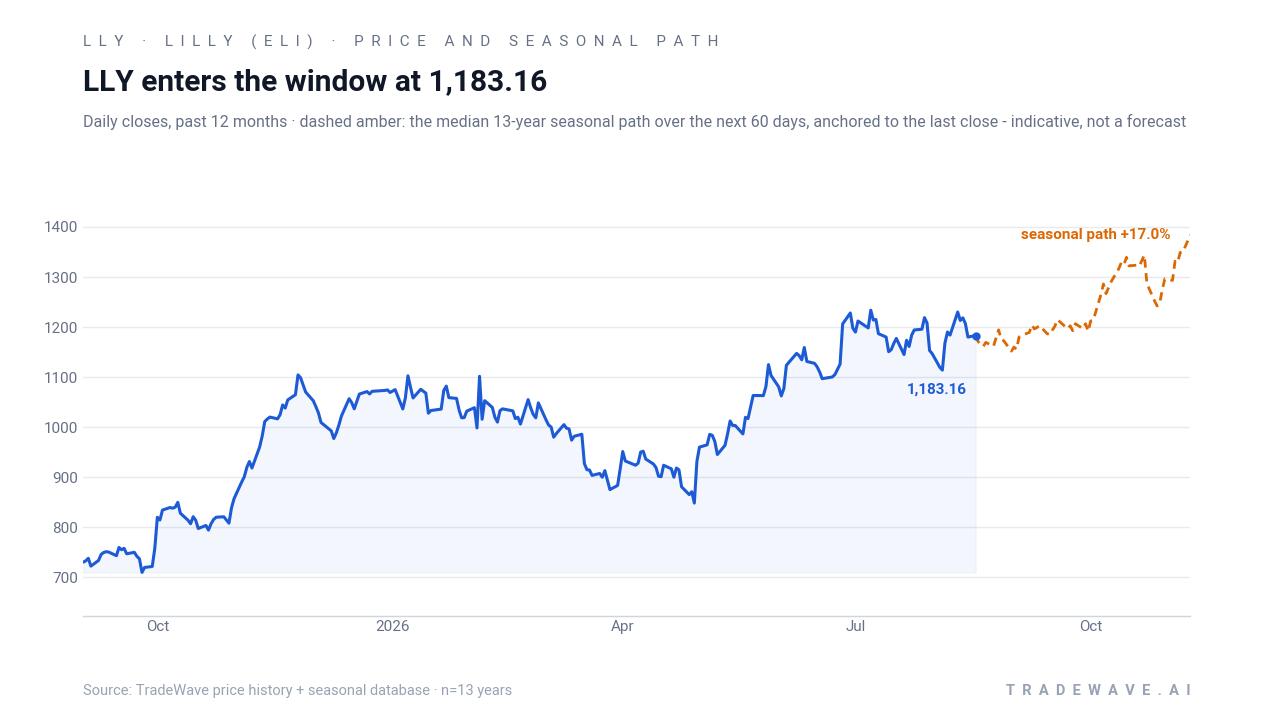
Lilly (Eli) closed the latest session at 1,246.93, down 0.67% on the day, after trading between 1,230.95 and 1,262.14 on volume of about 1.66 million shares. That leaves the stock roughly 3.5% below its 52-week high of 1,292.65 and well above its 50-day moving average near 1,178.42, with a one-month gain of 4.42% that extends a powerful multi-year run in obesity and diabetes drugs.
In early 2026, Lilly reported Q4 2025 results that beat Wall Street expectations on both revenue and earnings, with growth in the low-40% range year over year, and issued guidance calling for $80 billion to $83 billion in revenue and adjusted EPS of $33.50 to $35.00.[2] CNBC coverage ahead of the Q1 2026 report highlighted how investors were focused on the ramp of GLP-1 products, including injectable therapies and the new oral pill Foundayo, as well as capacity investments to meet surging demand.[4]
Earlier in the cycle, Lilly secured a U.S. government deal that will allow Medicare to cover GLP-1 drugs for certain obesity patients, a move that could expand the addressable market by tens of millions of people even as it pressures pricing.[3] The company has also announced a $6.5 billion manufacturing build-out in Houston tied to its oral GLP-1 pipeline, signaling confidence in long-term demand for obesity treatments.[8]
Analysts have leaned into that story. In late 2025, Leerink upgraded Lilly to outperform and raised its price target to $1,104, citing the Medicare agreement and a deep pipeline of metabolic drugs.[3] Bank of America followed with a target hike to $1,286 while reiterating a buy rating, arguing that Lilly’s GLP-1 franchise and new launches such as Foundayo position it as a structural winner in the obesity and diabetes market.[5]
The chart below situates the latest move against the past year of trading and overlays the median 60-day seasonal path for context.
What should traders watch as this seasonal window opens?
First, the calendar. The 238-day window begins on Aug. 31 and runs through Apr. 25, carrying Lilly from the late stages of the midterm election year into the heart of the year before the presidential election. Historically, that transition has coincided with a friendlier macro backdrop for risk assets as policy uncertainty around healthcare and drug pricing eases and investors refocus on earnings growth rather than Washington headlines.[3]
Second, price behavior relative to the historical pattern. In prior cycles, some of the strongest years saw Lilly push higher early in the window and then consolidate, while others featured a deeper early drawdown before a stronger recovery. If the stock holds above its 50-day moving average and grinds higher into year-end, that would rhyme with the smoother historical paths. A sharp break below recent support with heavy volume would instead echo the more volatile years where maximum adverse excursions widened before the eventual rebound.
Third, the policy and product calendar. Any fresh developments on Medicare coverage rules, U.S. drug pricing negotiations or international reimbursement for GLP-1 therapies could either reinforce or challenge the historical midterm-year pattern.[1] On the company side, updates on Foundayo’s rollout, capacity expansion milestones and any new late-stage obesity or diabetes data will shape how much fundamental fuel is available to support the kind of sustained gains seen in past windows.[4]
Finally, watch how the broader GLP-1 trade behaves. Barron’s has previously contrasted Lilly’s stock performance with rival Novo Nordisk around weight-loss drug headlines, underscoring how quickly leadership can shift within the space.[10] If sector flows continue to favor Lilly as the dominant obesity and diabetes play, that would align with the strong historical seasonality. A rotation toward peers or away from the theme altogether would be a sign that this midterm-year window may not track the prior 13 cycles as closely.
Sources
- Forbes - LLY Stock To $1,100?
- Seeking Alpha - Eli Lilly rebounds on Q4 beat after Novo-led decline
- CNBC - Leerink upgrades Eli Lilly following landmark deal with U.S. government
- CNBC - Eli Lilly will report first quarter earnings before the bell. Here's what Wall Street expects
- CNBC - Bank of America hikes Eli Lilly price target on promising drug pipeline
- Forbes - 20% Upside For Eli Lilly Stock?
- Seeking Alpha - Eli Lilly posts detailed results from ATTAIN-1 late-stage trial for obesity pill
- Forbes - LLY Stock Set For A 20% Breakout?
- Forbes - Is LLY Stock Headed To $1,350?
- Barron's - Eli Lilly, Novo Both Share Good News on Weight-Loss Drugs. Only One Stock Is Rising.
About this seasonal analysis
Seasonal pattern data is sourced from TradeWave.ai, which analyzes historical price behavior across annual calendar windows going back up to 30 years. Read the full data methodology or the book The 100-Year Pattern by Afshin Moshrefi (2026 edition). Past performance of seasonal patterns does not guarantee future results. This article is for informational purposes only and does not constitute investment advice.