Amgen (AMGN) Has Rallied in 10 of 10 Midterm Fall Windows, Averaging 6.06% Gains
Amgen is pressing fresh highs just as a 46-day midterm-year seasonal window with a perfect win record approaches, raising the stakes for biotech traders into early fall.
Price as of Aug 24, 2026: $443.84 (last close).

What is the seasonal pattern for Amgen (AMGN)?
Amgen has risen in 10 of 10 midterm-year Sep 6–Oct 21 windows, with an average gain of 6.06% in winning years.
- 10 for 10 in this window, with Amgen averaging 6.06% gains in winning years across the last 10 midterm election cycles.
- Percent Profitable is 100%, with 10 winners and 0 losers in the Sep 6–Oct 21 Amgen trading window.
- The upcoming 46-day window starts Sep 6, 2026 and has historically favored long exposure in Amgen during midterm election years.
- Average profit across all years matches the winner average at 6.06%, reflecting the absence of losing seasons in this sample.
- Intraperiod swings have been meaningful, with some years showing double-digit drawdowns even as the window ultimately finished higher.
- The pattern sits inside the midterm-to-pre-election transition, a phase where policy and healthcare pricing debates often reshape biotech sentiment.
According to historical data from TradeWave.ai, this specific early-September window has behaved very differently from an average month for Amgen, and the next iteration is only days away.
How has Amgen (AMGN) traded in the Sep 6–Oct 21 midterm window?
Amgen has finished higher in 10 of the last 10 midterm-year windows running from Sep 6 to Oct 21, averaging a 6.06% gain for long positions. Shares ended Monday at 443.84, up 1.0% on the day and sitting about 0.5% below their 52-week high of 445.87. That puts a near-record price into a historically strong slice of the calendar where the stock’s seasonal trend has been unusually consistent.
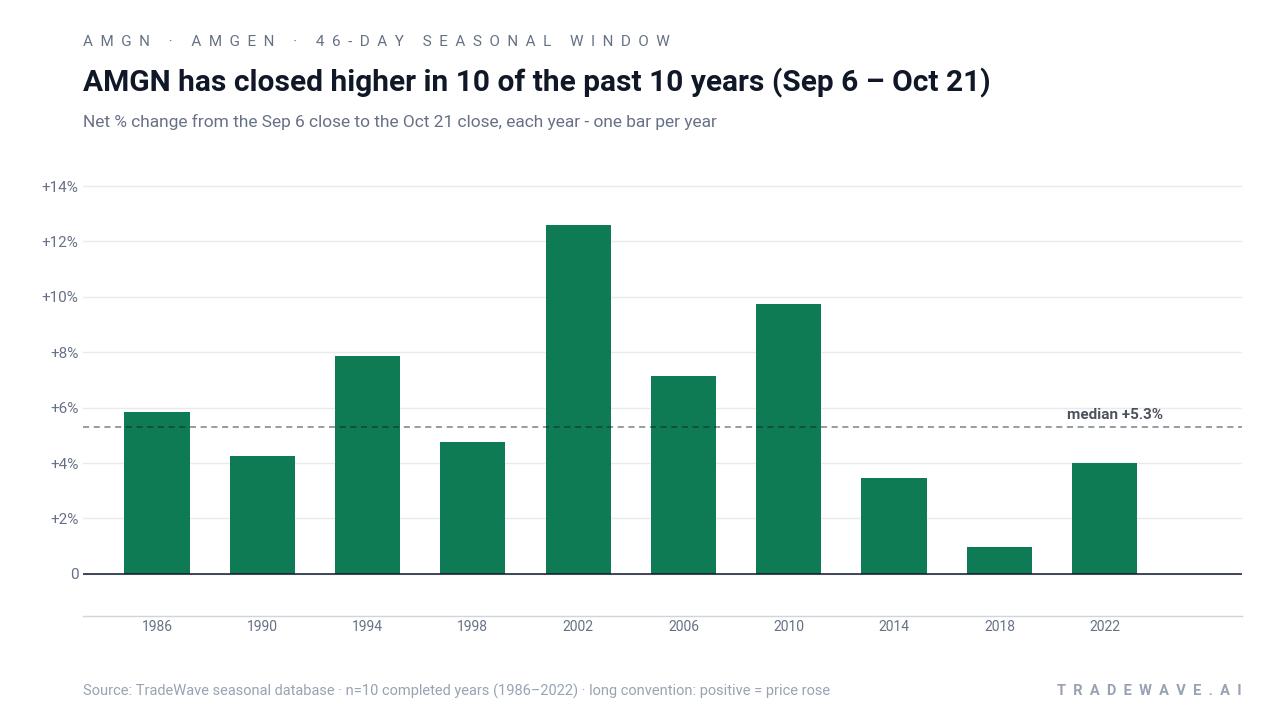
The presidential election cycle matters here because this pattern only looks at the last 10 midterm election years, then stacks the same 46-day slice in each of those years. That means the results reflect how Amgen has behaved when Washington is in the middle of a term, with policy debates heating up but before the typical pre-election risk-on phase for equities.
Historically, the trade direction for this window has been long. Percent Profitable sits at 100%, with 10 winners and 0 losers across the sample, so every midterm-year run from Sep 6 to Oct 21 has ended with Amgen higher than it started. Average profit in those winning years is 6.06%, while the median outcome is a 5.3% gain, suggesting the typical result has been a mid-single-digit advance rather than a one-off outlier.
The per-year breakdown shows that strength has been broad-based rather than concentrated in a single era. In 2002, for example, Amgen logged a 12.58% net return in the window, while 2010 delivered a 9.73% gain. At the softer end, 2018 still finished up 0.95%, and 1990 added 4.27%. Add it up and compounding the window across all 10 midterm years produces a cumulative return of roughly 79% for this specific slice of the calendar.
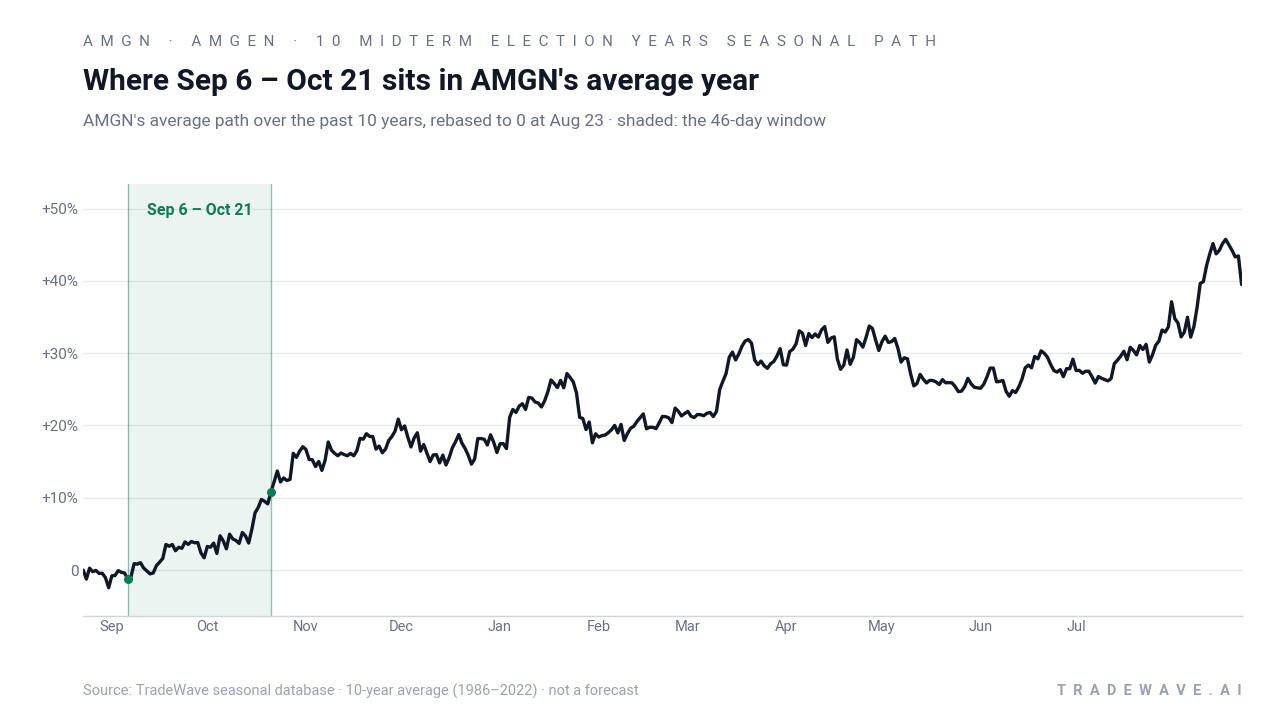
The historical seasonal average path suggests that gains in this Amgen trading window often accrue steadily rather than in a single spike. The shaded region on the trend chart shows the stock’s average path bending higher through the 46 days, consistent with the long bias and the high share of winning years.
Intraperiod ranges show that even winning windows have carried meaningful drawdowns before finishing higher.
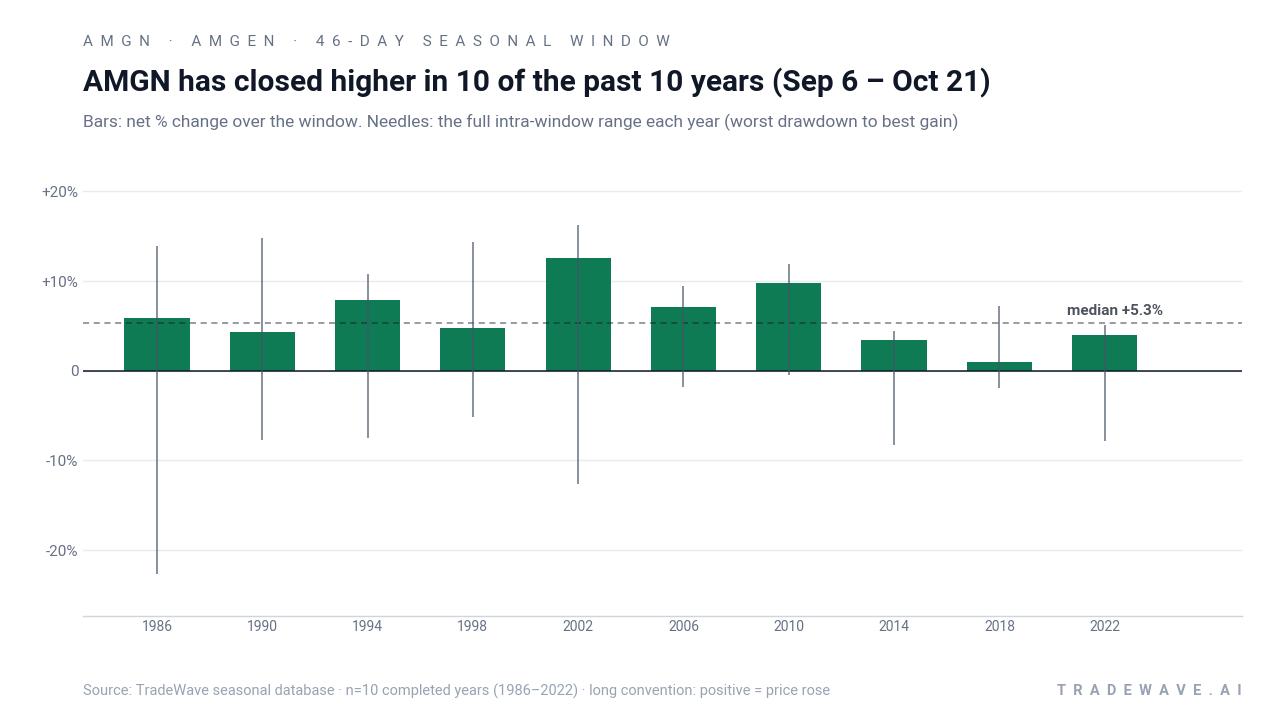
The maximum favorable move and maximum adverse move profile shows why this window has mattered for risk management. In 1986, for instance, Amgen’s best intraperiod gain reached 13.89%, but the worst drawdown from entry was a sharp 22.64% before the stock recovered to finish the window up 5.84%. In 2002, the best run-up hit 16.2% while the worst pullback matched the final gain at 12.58%, underscoring that even strong years have seen sizable dips along the way.
Other years have been smoother. In 2010, the worst drawdown was just 0.48% against an 11.86% best run-up and a 9.73% final gain, while 2006 saw only a 1.81% adverse move versus a 9.39% best gain and a 7.13% close-to-close return. The TradeWave Ratio of 2.48 captures this tendency for price to travel meaningfully in the trade direction within the window, while the Sharpe ratio of 1.65 points to a relatively strong risk-adjusted profile based on end-of-window outcomes.
The key takeaway is simple: across the last 10 midterm election years, this 46-day Amgen trading window has been 10 for 10 on the long side, with typical gains in the mid-single digits and occasional double-digit swings both up and down inside the period.
Why does Amgen (AMGN) follow this seasonal pattern?
One likely driver is the way healthcare and drug-pricing debates tend to intensify in the back half of midterm election years, often clarifying policy risk for large-cap biotech names. Analysts have also pointed to institutional portfolio repositioning into defensive growth sectors like pharmaceuticals as investors look ahead to the historically stronger pre-election year. For Amgen specifically, this window often lines up with guidance updates and late-year positioning around its pipeline and pricing strategy, which can concentrate flows into early fall.
History does not guarantee future results; adverse excursions can be large even in winning windows, and past seasonal strength does not ensure similar outcomes in 2026.
What is driving Amgen (AMGN) today?
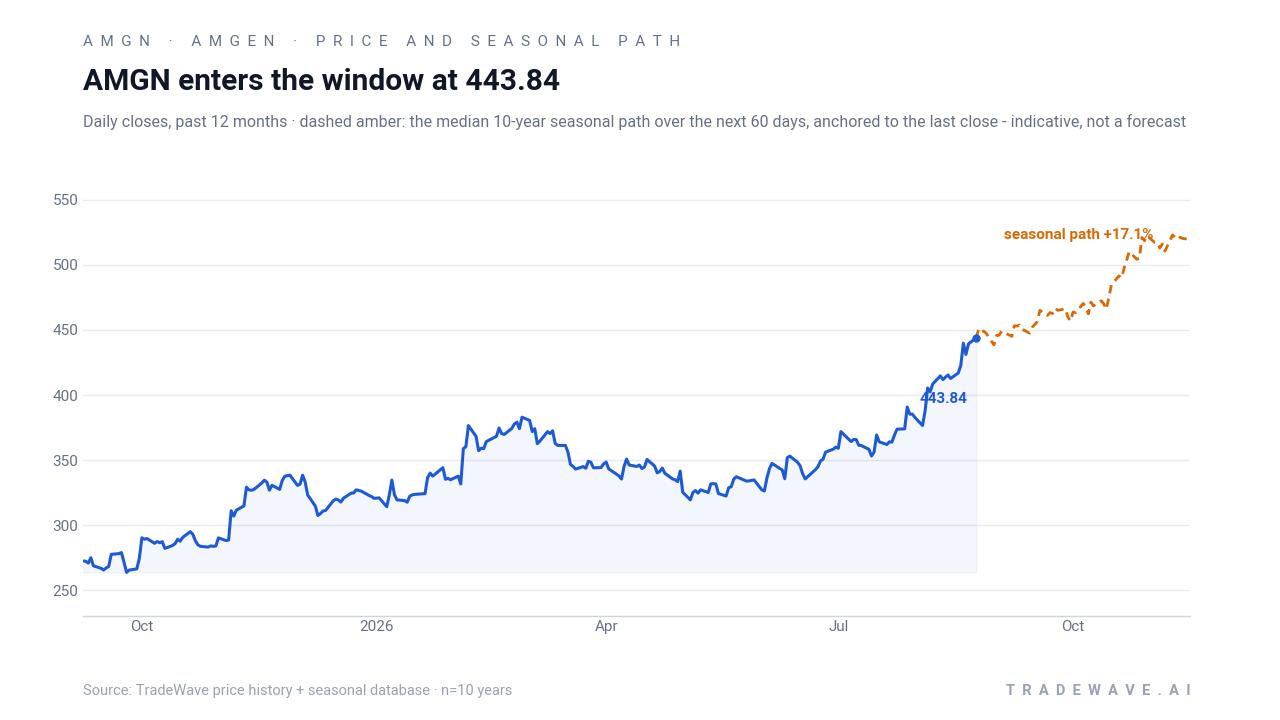
Amgen closed Monday at 443.84, up 1.0% on the session, after a strong one-month run of 19.34% that has carried the stock to within about 0.5% of its 52-week high at 445.87. Trading volume of roughly 2.37 million shares came in a bit below the 20-day average of about 2.75 million, suggesting the latest push higher has not yet triggered a surge in activity. The stock also sits well above its 50-day moving average of 376.55, underscoring how extended the move has become on a short-term basis.
Fundamentally, the backdrop reflects a mix of earnings strength and policy risk that has defined Amgen’s story into 2026. In February 2026, the company reported fourth-quarter revenue of $9.9 billion and adjusted earnings of $5.29 per share, topping analyst estimates and supporting a 2026 adjusted EPS guidance range of $21.60 to $23.00 on revenue of $37.0 billion to $38.4 billion.[1] Management highlighted confidence in its MariTide weight-loss program and noted that Repatha sales reached $870 million in the quarter, ahead of Wall Street expectations.[1]
At the same time, Amgen has been navigating drug-pricing and safety headlines that shape the broader biotech sector outlook. In October 2025, the company moved to sell its cholesterol drug Repatha directly to U.S. consumers at a monthly cash price of $239, roughly 60% below the prior list price, in a bid to broaden access and respond to political pressure on drug costs.[2] In May 2026, Japanese regulators added new warnings to the label for Tavneos after patient deaths, underscoring ongoing safety-surveillance risk for rare-disease therapies.[3]
The chart below situates the latest move against Amgen’s past year of trading and the median seasonal path for the next two months.
What should traders watch as the Sep 6 window opens?
First, the calendar: the 46-day window begins on Sep 6 and runs through Oct 21, overlapping the late phase of the midterm election year and the approach to the pre-election year, when policy and healthcare pricing debates often intensify. Traders will be watching whether Amgen’s price action inside this stretch tracks the historical seasonal trend of steady gains or diverges sharply from the 10-for-10 record.
Second, levels matter. With the stock already near its 52-week high, how Amgen behaves around the 440 to 450 zone during the first two weeks of the window will be an early tell. A pattern of buying dips above the 50-day moving average would rhyme with prior midterm-year windows, while a quick break back toward that moving average would signal that this cycle may not follow the historical script.
Third, the policy and regulatory tape will remain central. Any new developments on U.S. drug-pricing initiatives or follow-up actions around Tavneos and other safety-sensitive products could either reinforce Amgen’s role as a defensive growth name or inject fresh volatility into the stock.[2][3] How those headlines land during a historically strong seasonal window will help determine whether the 2026 iteration extends the 10-year streak or marks the first real outlier.
Sources
About this seasonal analysis
Seasonal pattern data is sourced from TradeWave.ai, which analyzes historical price behavior across annual calendar windows going back up to 30 years. Read the full data methodology or the book The 100-Year Pattern by Afshin Moshrefi (2026 edition). Past performance of seasonal patterns does not guarantee future results. This article is for informational purposes only and does not constitute investment advice.