8-of-10 Fall Slide: Workday, Inc. (WDAY) Nears Its Historically Weak Sep-Oct Window
Workday, Inc. is heading toward a historically weak September–October trading window even as the stock trades well below its 52-week high and positioning in options and short interest points to elevated volatility.
Price as of Aug 6, 2026: $170.24 (last close).

What is the seasonal pattern for Workday, Inc. (WDAY)?
Workday, Inc. has fallen in 8 of 10 years during the Sep 1 to Oct 15 window since 2016, with an average 7.04% gain in winning years for the short-side pattern.
- 8 for 10 in this window, with the short-side pattern averaging 7.04% gains in winning years.
- The 45-day window runs from Sep 1 to Oct 15 and has historically been a weak stretch for WDAY’s share price.
- Percent Profitable is 80%, with 8 winners and 2 losers for the short-direction setup across the past decade.
- Including all years, Avg Profit - All is 5%, reflecting that down years for the stock have outweighed the occasional rallies.
- The TradeWave Ratio of 1.75 suggests price has typically moved meaningfully in the trade direction within the window, even when final closes were smaller.
- Intraperiod swings have been wide, with several years showing double-digit drawdowns before the window closed.
According to historical data from TradeWave.ai, this upcoming early-fall stretch has behaved very differently from an average month in Workday’s trading year. The next section looks at how that pattern has played out and where it fits into today’s setup.
How has Workday, Inc. (WDAY) traded in the Sep 1 to Oct 15 window?
Workday, Inc. has closed lower in 8 of the past 10 Sep 1 to Oct 15 windows, a short-side pattern that has compounded to a 60% cumulative gain for bears since 2016. The next iteration of that 45-day stretch begins on Sep 1, with the stock last changing hands at $170.24, about 31.9% below its 52-week high of $249.85. Unusually active put options, including multiple in-the-money contracts such as a Jan 16, 2026 $185 put, and elevated short interest suggest traders are already leaning into downside or hedging risk around this period.[3][5]
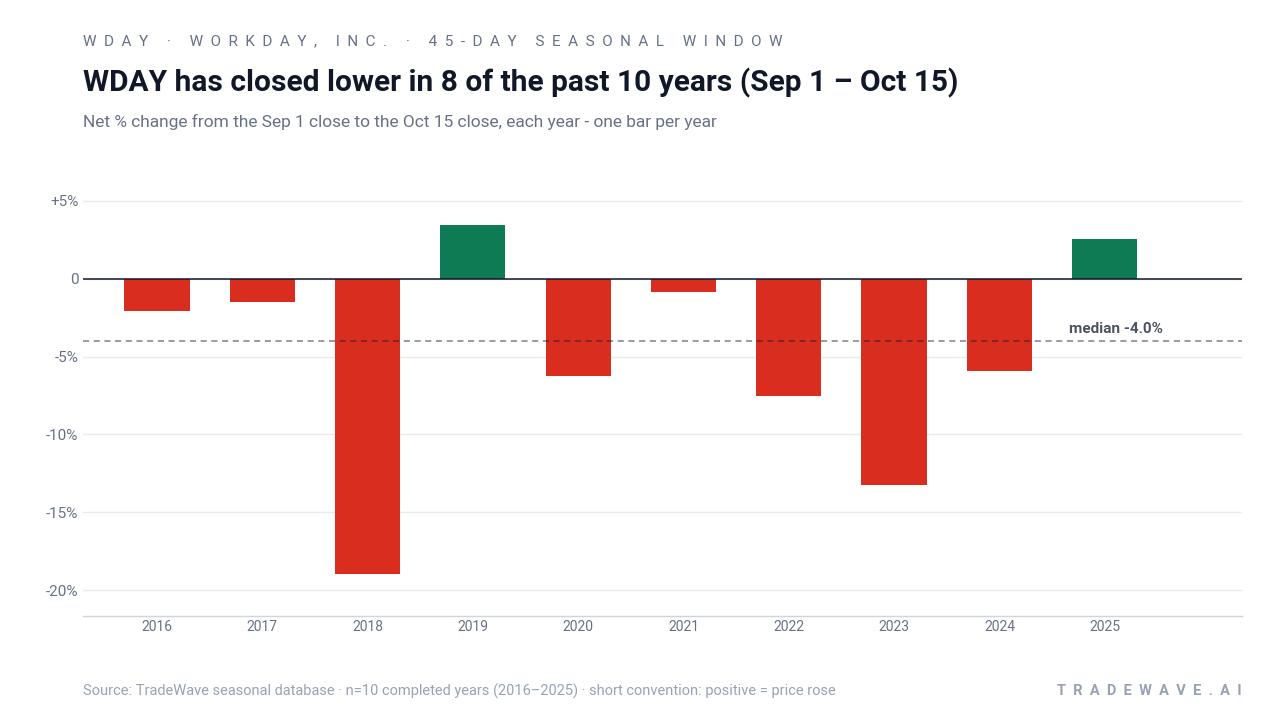
For this short-direction setup, an 80% Percent Profitable reading means that in 8 of 10 years, WDAY finished the window below its Sep 1 level. The average gain for those winning short years is 7.04%, while including the two losing years trims the all-years average to 5%, which is still a meaningful edge for a 45-day trade. The median outcome is a 4.0% move in favor of the short, suggesting that while some years have produced double-digit drops, the typical result has been a mid-single-digit slide.
The per-year history shows how lopsided some of those down windows have been. In 2018, the stock fell 18.95% between Sep 1 and Oct 15, with the worst intraperiod drawdown from entry reaching 22.28% before the window closed. In 2023, WDAY dropped 13.23% in the same stretch, with a maximum adverse move of 18.7% from the entry level. Even in years that ultimately finished close to flat, such as 2017 and 2021, the worst drawdowns inside the window ran close to 10%, underscoring how choppy this slice of the calendar has been for longs.
On the flip side, the losing years for the short pattern have been relatively contained. In 2019, WDAY rose 3.42% over the window, with a best intraperiod rally of 6.08% from the entry price. In 2025, the stock gained 2.56% between Sep 1 and Oct 15, even though it first moved as much as 4.76% against the short before reversing. That mix of sizable adverse excursions and modest net gains in the losing years helps explain why the Sharpe ratio for the pattern sits at 0.65 rather than something more extreme.
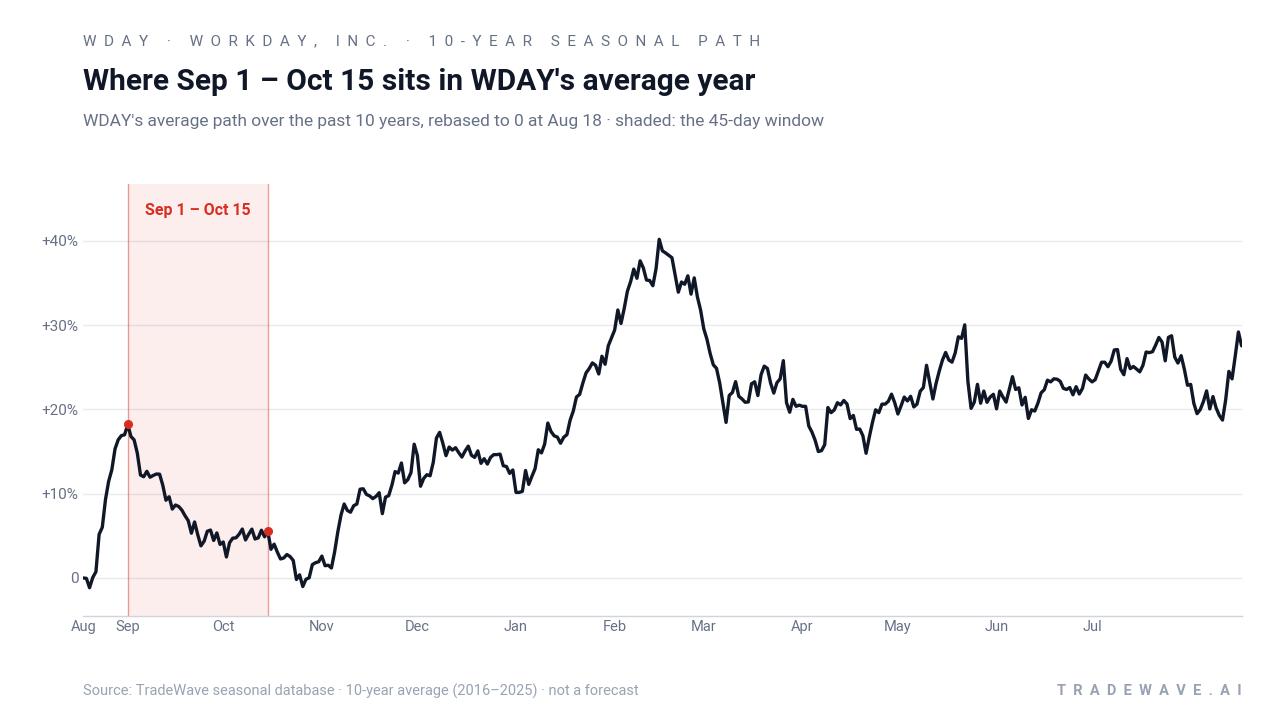
The historical seasonal average suggests that weakness in this window often builds gradually rather than collapsing all at once. The trend chart shows WDAY typically drifting lower through September, with the bulk of the move occurring in the middle of the window before stabilizing into mid-October. That profile lines up with the idea of a grinding, volatility-heavy period rather than a single shock event.
A closer look at yearly ranges shows how far WDAY has tended to swing inside this window before settling at its final close.
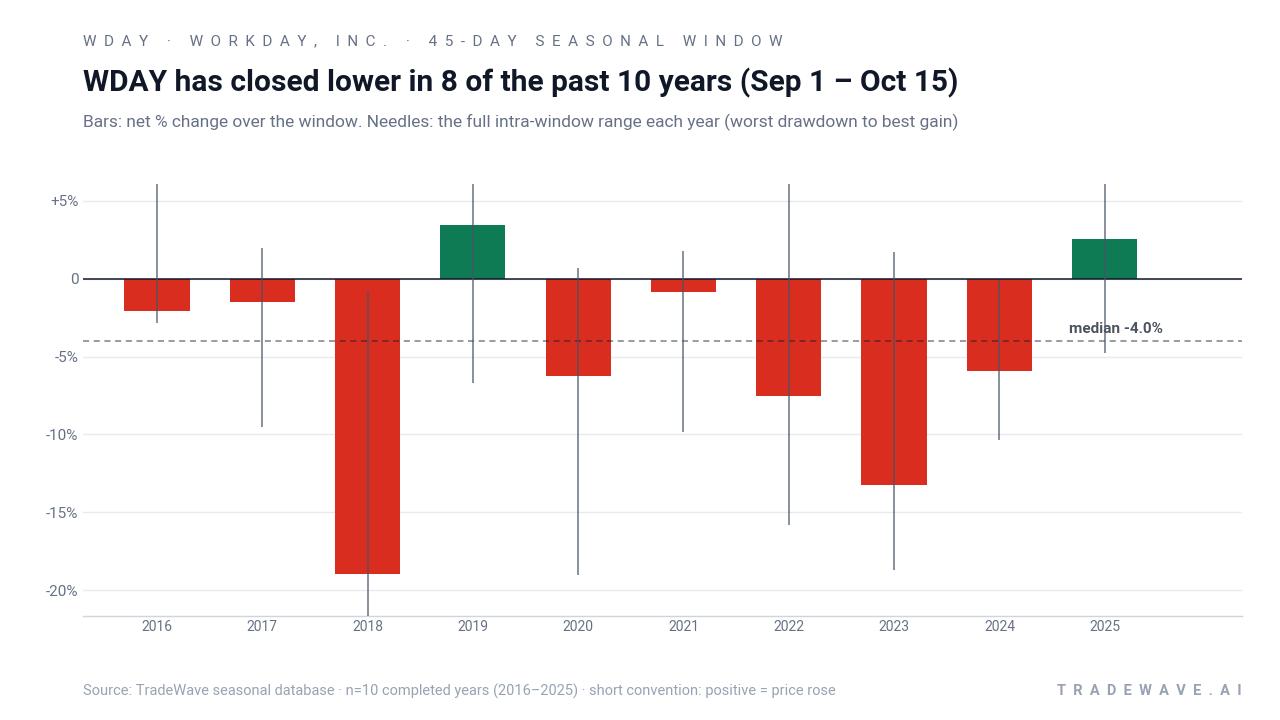
The combined net / maximum favorable move / maximum adverse move view highlights why this WDAY seasonal trend matters for risk management. In several years, the best intraperiod move in favor of the short has exceeded 7%, while the worst move against the position has also pushed into double digits. That combination of sizable swings in both directions, paired with an 80% win rate for the short side, is what gives this window its 1.75 TradeWave Ratio and makes it stand out from a typical month in the stock.
History does not guarantee future results, and adverse excursions can be large even in winning windows, so traders using this pattern still face meaningful drawdown risk.
Why does Workday, Inc. (WDAY) follow this seasonal pattern?
This early-fall pattern for Workday may reflect a cluster of earnings expectations, fiscal-year budgeting cycles and institutional portfolio repositioning in software. One likely driver is that large enterprise customers finalize HR and finance software budgets ahead of calendar year-end, which can influence bookings commentary and sentiment around September and October.[4] Analysts have also pointed to sector rotation in high-multiple SaaS names during this period, as investors rebalance exposure after summer moves and ahead of year-end performance reviews.[3]
What is driving Workday, Inc. (WDAY) today?
Workday shares closed at $170.24 on Aug 7, down 0.2% on the day, after a strong rebound over the past month that has left the stock still well below its 52-week high of $249.85. The move comes as Wall Street looks ahead to the next earnings report, where consensus calls for quarterly EPS of about $2.63 on revenue near $2.63 billion, and as investors digest a prior quarter that delivered 14.5% year-over-year revenue growth and a raised full-year profit margin outlook.[3][4][6] In late July, Zacks highlighted Workday as a trending stock with a Hold rating and noted that the company’s guidance for subscription revenue of $8.83 billion for the fiscal year ending Jan 2026 implies roughly 14.4% growth, keeping expectations high for continued execution.[3][6]
Under the surface, positioning looks more cautious than the headline rating suggests. In late July, Zacks flagged unusually active put options in Workday, including eight unusually active contracts and a Jan 16, 2026 $185 put that drew attention as traders sought downside protection or speculative exposure.[3] In May, ChartMill placed Workday on a list of “Most Shorted Stocks,” citing elevated short interest even as it argued the company remained an affordable growth name with solid free cash flow and reasonable valuation metrics.[5] That mix of active put buying and higher short interest sets up a tug-of-war between fundamental bulls and tactical bears as the historically weak September–October window approaches.
Fundamentally, Workday is still framed as a growth story in finance and HR software, with AI features emerging as a key talking point. In March, coverage of the company’s results noted that revenue reached $2.53 billion, up 14.5% year over year, and that AI products were starting to contribute to growth, reinforcing the narrative that Workday can tap into broader AI adoption trends in enterprise software.[4] Sector comparisons from earlier this year showed Workday trading at a forward P/E multiple that was not stretched relative to its software peers, which has helped some investors justify staying involved despite volatility.[1]
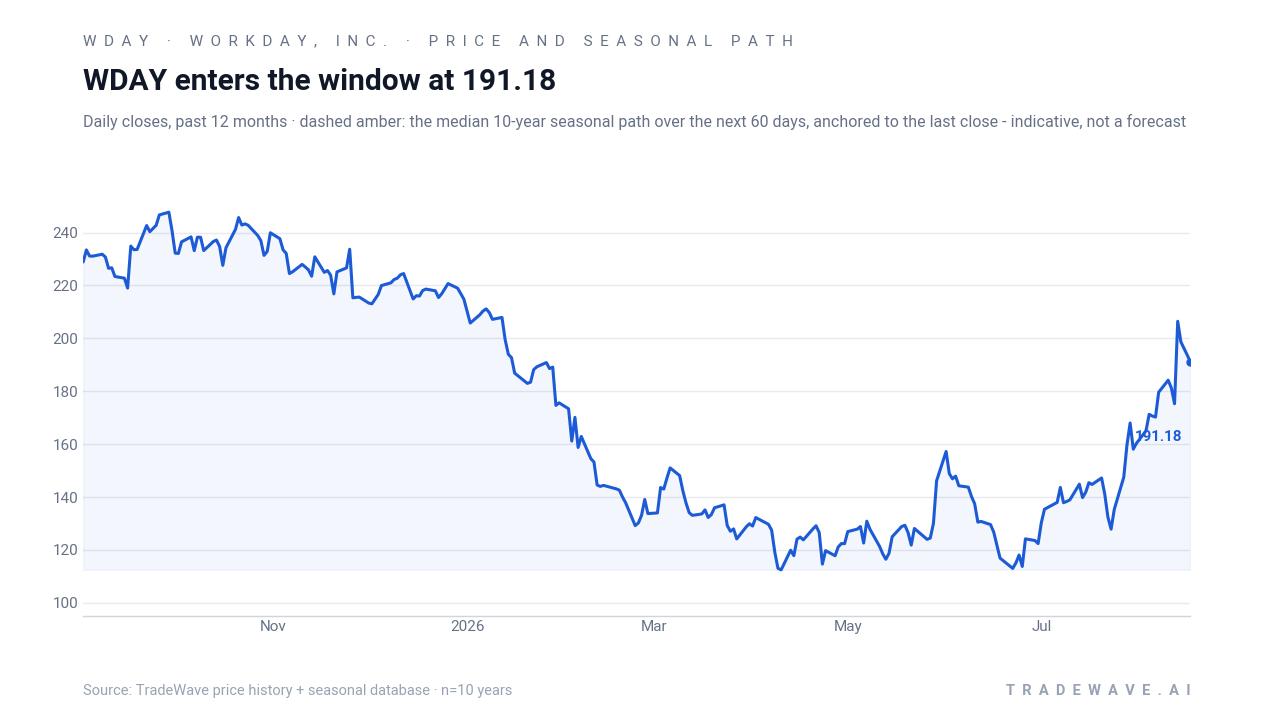
The chart below situates the latest move in its recent multi-month context and overlays the median seasonal path for the next 60 days.
What should traders watch as the September window approaches?
The first marker is the calendar itself: the seasonal window opens on Sep 1 and runs through Oct 15, so any sharp move in the second half of August will shape how stretched or compressed WDAY looks heading into that period. Traders will be watching whether the stock continues to rebound toward its 50-day moving average cluster or stalls below resistance levels carved out during the spring selloff. A strong rally into late August would give the short-side seasonal pattern more room to work, while a renewed slide could blunt the historical edge.
Earnings and guidance will be the second key catalyst. Consensus expects EPS of roughly $2.63 and revenue of about $2.63 billion for the upcoming quarter, with investors focused on whether subscription revenue guidance around $8.83 billion for the fiscal year can hold or improve.[3][6] Any disappointment on growth, AI traction or margin expansion could reinforce the historical tendency for weakness in this window, while a clean beat-and-raise could set up a squeeze against the elevated short interest.
The third focus is positioning. The unusually active put options and higher short interest flagged in late July and May give traders a clear signal to monitor: if put volumes stay heavy and short interest builds further into September, it would confirm that the market is leaning into the historical seasonal pattern.[3][5] If, instead, put activity fades and shorts begin to cover, that would suggest the Special Insight is losing momentum and that any seasonal downside could be more muted or vulnerable to a squeeze.
Finally, behavior inside the window will matter as much as the start. In prior years, the most pronounced moves have often come in the middle of the 45-day stretch, with intraperiod drawdowns reaching double digits even when final closes were less dramatic. If WDAY starts to slide steadily through mid-September with rising volume and persistent put demand, it would line up closely with the historical pattern. A firm tape that shrugs off early selling and holds above key support would be the clearest sign that this year’s Sep 1 to Oct 15 window is breaking from the past.
Sources
- Yahoo Finance / Zacks, "Workday (WDAY) Stock Sinks As Market Gains: Here's Why" (Apr 14, 2026)
- Yahoo Finance / Zacks, earlier "Workday (WDAY) Stock Sinks As Market Gains: Here's Why" (Apr 6, 2026)
- Yahoo Finance / Zacks, "Workday (WDAY) Stock Dips While Market Gains: Key Facts" (Jul 31, 2026)
- Yahoo Finance, "Reflecting On Finance and HR Software Stocks’ Q4 Earnings: Workday (NASDAQ:WDAY)" (Mar 2, 2026)
- ChartMill, "Workday Inc. (NASDAQ:WDAY): Affordable Growth Stock with Strong Fundamentals and Reasonable Valuation" (May 6, 2026)
- Yahoo Finance, "Workday, Inc. (WDAY) Is a Trending Stock: Facts to Know Before Betting on It" (Jul 31, 2026)
About this seasonal analysis
Seasonal pattern data is sourced from TradeWave.ai, which analyzes historical price behavior across annual calendar windows going back up to 30 years. Read the full data methodology or the book The 100-Year Pattern by Afshin Moshrefi (2026 edition). Past performance of seasonal patterns does not guarantee future results. This article is for informational purposes only and does not constitute investment advice.