9 of 10 Losing Years: Workday, Inc. (WDAY) Enters a 12-Day Early-September Downside Window
Workday, Inc. is trading around $199 as it heads toward a 12-day early-September stretch that has historically been a weak seasonal window for the stock.
Price as of Aug 24, 2026: $199.15 (last close).

What is the seasonal pattern for Workday, Inc. (WDAY)?
Workday, Inc. has fallen in 9 of 10 years during this early-September 12-day window, with an average 3.33% gain in winning years for the short side.
- 9 for 10 in this window, with the short side averaging 3.33% profit in winning years across the past decade.
- Seasonal direction is bearish for the stock from Sep 3 over a 12-day trading window, based on 10 completed years.
- Percent Profitable is 90%, with 9 winners and 1 loser for the short setup in this Workday, Inc. trading window.
- Avg Profit in winning years is 3.33%, while Avg Profit - All, including the lone losing year, comes in at 3%.
- The historical pattern shows adverse moves within the window, but typical drawdowns have been smaller than the best favorable swings for shorts.
- Overall WDAY seasonal trend in this slice has compounded to roughly one-third cumulative return for the short side over 10 years.
According to historical data from TradeWave.ai, this early-September stretch has behaved very differently from an average month for Workday, Inc. in recent years. TradeWave.ai’s seasonal database flags the upcoming 12-day window as one of the stock’s most consistently bearish short-term patterns on the calendar.
How has Workday, Inc. (WDAY) traded in this early-September window?
Workday, Inc. has closed lower in 9 of the past 10 years during the Sep 3 to Sep 14 window, making it one of the most reliable short-side seasonal stretches in the stock’s history. Shares finished the prior session at $199.15, leaving them about 20.3% below the 52-week high of $249.85 and well above the 52-week low of $110.36. That combination of a clear historical pattern and a stock sitting in the middle of its one-year range gives traders a defined backdrop as the next iteration approaches.
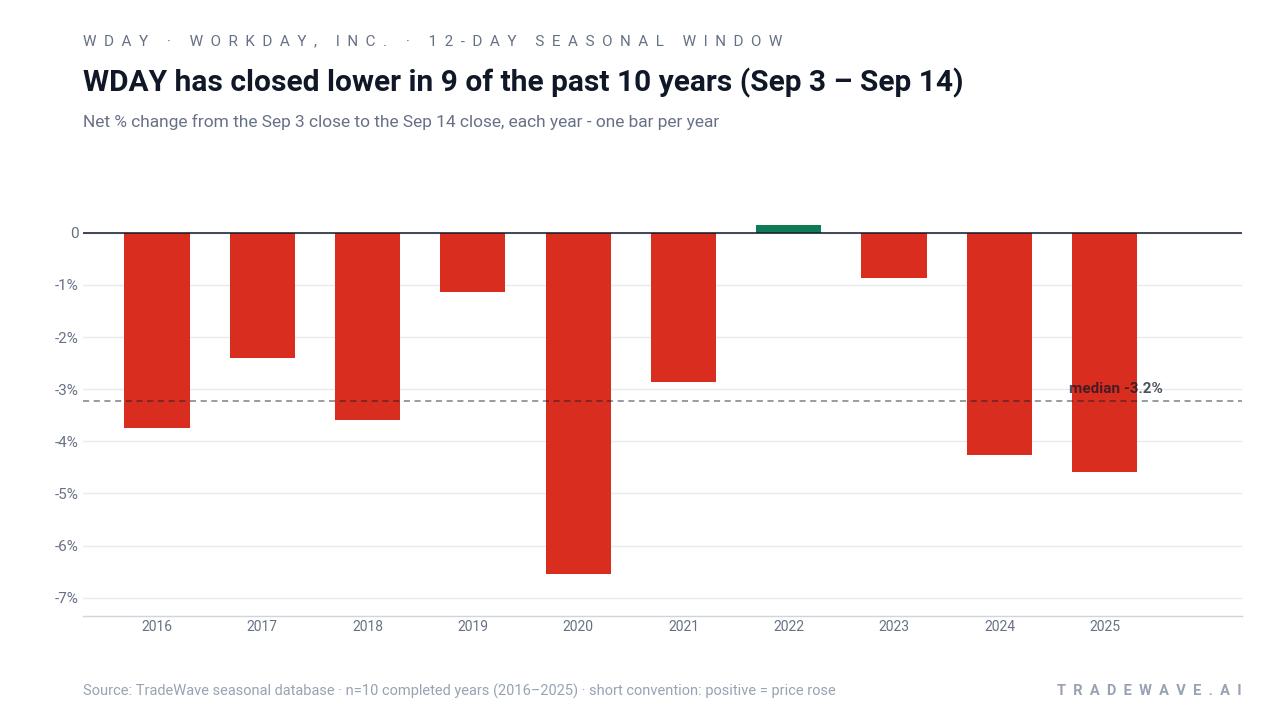
Trade direction for this pattern is explicitly short, so negative returns in the window have historically been favorable outcomes. Across the 10-year sample, Percent Profitable sits at 90%, with 9 winning years for shorts and just 1 losing year. Average profit in those winning years is 3.33%, while including the lone loser trims the all-years average to 3%, which is still a solid edge for a 12-day setup.
The dispersion around that average is relatively tight for such a short window. The standard deviation of end-of-window returns is 2.0%, and the Sharpe ratio of 1.44 reflects a strong risk-adjusted profile for the short side over this specific slice of the calendar. The TradeWave Ratio of 1.67 indicates that, within the window, price has typically traveled meaningfully in the trade direction, giving active traders room to manage entries and exits even when the final close is less dramatic.
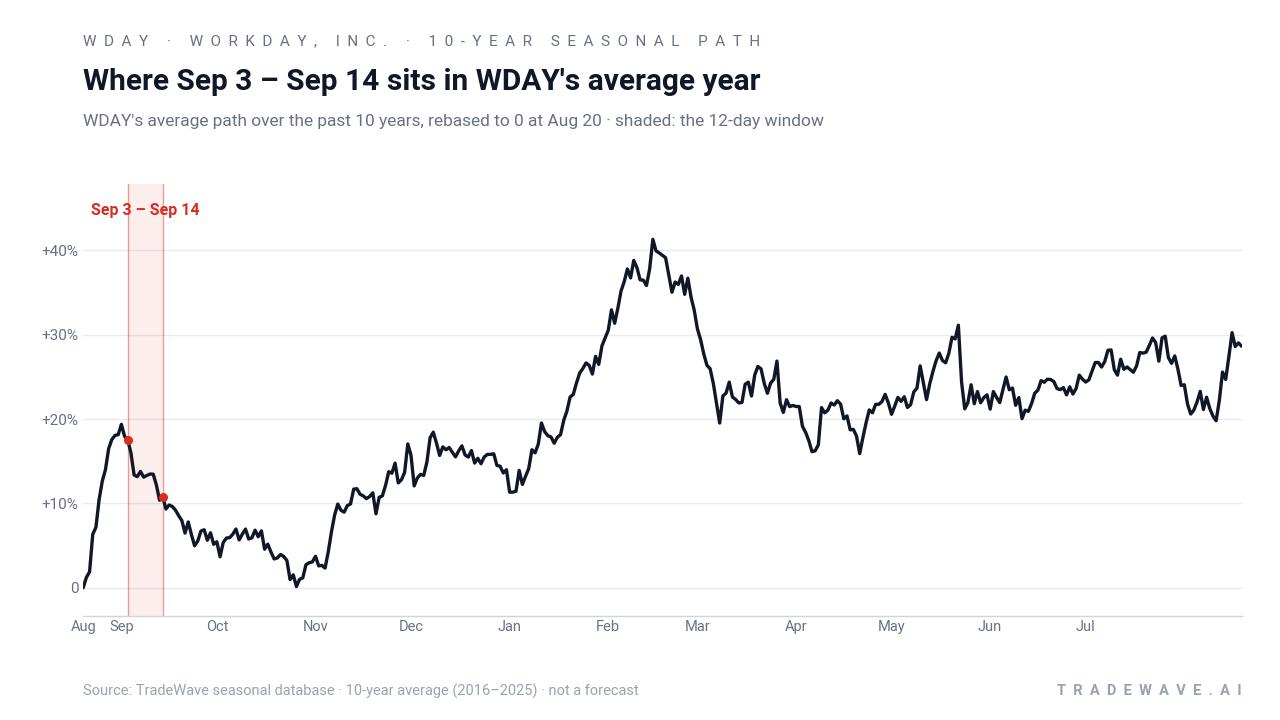
A second view shows how far WDAY has tended to swing in both directions inside the window before settling at the final close.
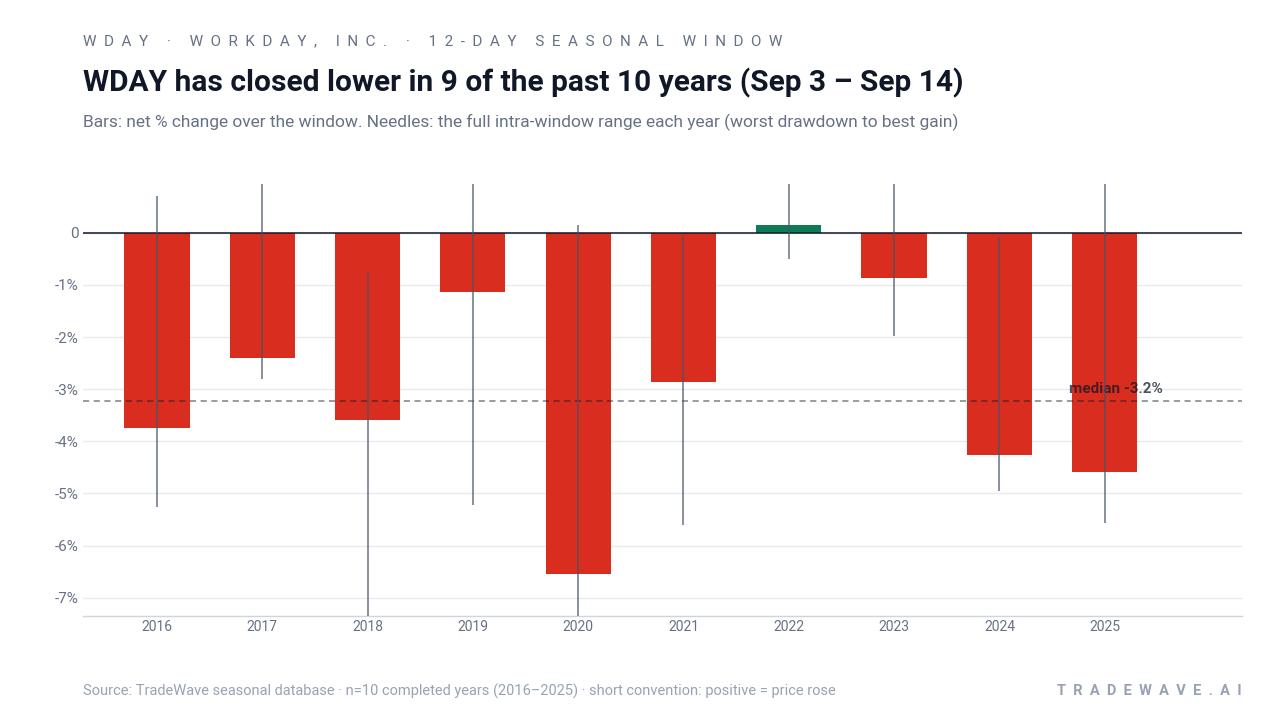
Looking year by year, the strongest short-side outcome came in 2020, when WDAY fell 6.54% over the window with a worst intra-period drawdown of 9.69% from the entry and only a modest 0.14% peak rally against the trade. The weakest year for shorts was 2022, when the stock eked out a 0.14% gain over the window despite an 8.18% maximum favorable move at one point, underscoring how quickly reversals can erase intraperiod profits. In several other years, such as 2018 and 2024, the pattern delivered clean downside moves with limited upside squeezes, which is exactly what a short setup prefers.
The cumulative chart of this Workday, Inc. seasonal trend tells the same story in one line. Compounding the 12-day window each year would have produced roughly a one-third gain for the short side over the past decade, with no multi-year flat stretches. Add it up: 33% cumulative return across ten early-September windows for traders positioned with the historical bias.
History does not guarantee future results; adverse excursions (MAE) can be large even in winning windows.
Why does Workday, Inc. (WDAY) follow this seasonal pattern?
This early-September weakness may reflect a cluster of catalysts around Workday’s fiscal calendar and the broader software sector. One likely driver is institutional portfolio repositioning after summer, as investors reset exposure to higher-multiple cloud and HR tech names ahead of fall earnings updates. The pattern may also capture recurring reactions to guidance and AI spending narratives that tend to surface in late August and early September, when management teams refine outlooks for the back half of the year.
What is driving Workday, Inc. (WDAY) today?
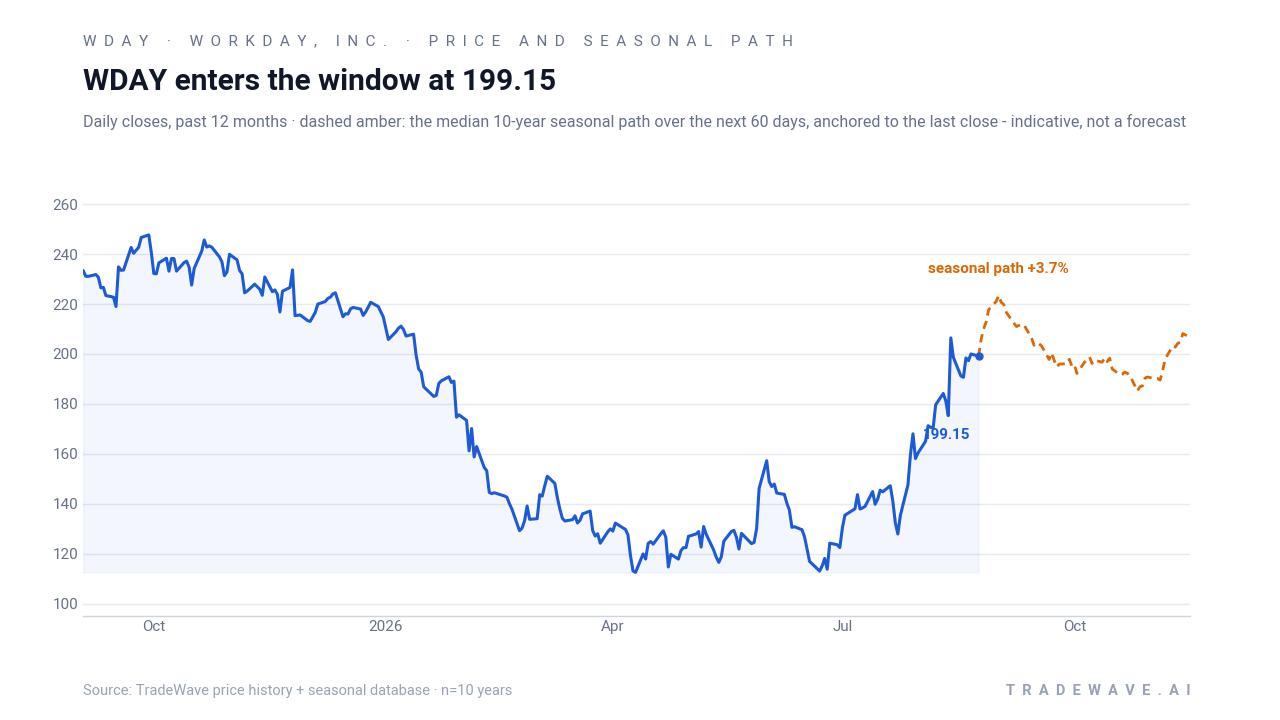
Workday, Inc. closed at $199.15 on Aug 24, down 0.43% on the day, after a volatile August that still leaves the stock up 34.98% over the past month and roughly 20.3% below its 52-week high of $249.85. The move comes on the heels of a sharp 17.78% intraday surge to $206.45 on Aug 13 after reports that private equity firm Silver Lake had held talks to acquire the company, a headline that briefly reset expectations around Workday’s standalone valuation and strategic options.[1]
The chart below situates the latest move in its recent multi-month context, alongside the median 10-year seasonal path for the next 60 days.
That M&A chatter landed against a complicated fundamental backdrop. In late February 2026, Workday reported strong fourth-quarter earnings but paired them with softer guidance and a disappointing year-end subscription backlog, which reinforced broader investor skepticism toward high-growth software names.[1] The company later outlined a fiscal 2027 subscription revenue outlook of $9.93 billion to $9.95 billion, slightly below roughly $10 billion analyst expectations, and emphasized heavier spending on its agentic AI roadmap, a trade-off that pressured the stock as investors weighed growth against margin expansion.[1]
Earlier, in November 2025, Workday’s Q3 report showed revenue of $2.43 billion, up 13% year over year, with net profit of $252 million and AI products contributing more than 1.5 percentage points of annualized revenue growth.[1] Yet the company’s subscription revenue guidance of $8.83 billion, implying 14.4% growth, was seen as underwhelming relative to bullish expectations, and the stock sold off as investors questioned how quickly AI-driven features would translate into sustained top-line acceleration.[1]
Strategically, Workday sits at the intersection of HR and payroll software and the broader AI software boom. Management has leaned into AI as a differentiator, but the sector faces a macro narrative in which new AI tools from players such as Anthropic could disrupt traditional software revenue models, even as they create fresh demand for automation and analytics.[1] That tension helps explain why the stock can swing sharply on guidance tweaks or M&A rumors, and why a historically weak seasonal stretch into early September may matter more than usual this year.
Sources
About this seasonal analysis
Seasonal pattern data is sourced from TradeWave.ai, which analyzes historical price behavior across annual calendar windows going back up to 30 years. Read the full data methodology or the book The 100-Year Pattern by Afshin Moshrefi (2026 edition). Past performance of seasonal patterns does not guarantee future results. This article is for informational purposes only and does not constitute investment advice.