9-of-10 Losing Years: Workday, Inc. (WDAY) Nears a Historically Weak Sep 3-14 Window
Workday, Inc. is surging on buyout speculation even as it heads toward a short early-September stretch that has historically been a weak trading window for the stock.
Price as of Aug 19, 2026: $198.42 (last close).

What is the seasonal pattern for Workday, Inc. (WDAY)?
Workday, Inc. has fallen in 9 of 10 years during this early-September 12-day window, with an average 3.33% gain in winning years for the short trade.
- 9 for 10 in this window, with the short side averaging 3.33% profit in winning years and 3% across all years.
- The 12-day window runs from Sep 3 to Sep 14 and has historically been a bearish seasonal stretch for WDAY.
- Percent Profitable sits at 90%, with 9 winning short years and just 1 losing year in the 10-year sample.
- Avg Profit reflects winners only at 3.33%, while Avg Profit - All, which includes the lone losing year, is still a solid 3%.
- Maximum adverse moves inside the window have reached nearly 10% in some years, showing that drawdowns can be sharp even when the short ultimately works.
- The TradeWave Ratio of 1.67 and a Sharpe ratio of 1.44 point to a historically efficient short window compared with typical noise.
According to historical data from TradeWave.ai, this early-September stretch has behaved very differently from an average month in Workday’s trading year, and the next iteration is less than two weeks away.
How has Workday, Inc. (WDAY) traded in the early-September window?
Workday, Inc. has closed lower in 9 of the past 10 years during the Sep 3 to Sep 14 window, making it one of the stock’s most consistently bearish short-term patterns. Today the shares finished at 198.42, up 4.1% on the session and about 20.6% below their 52-week high of 249.85, after a powerful rebound from early-summer weakness.
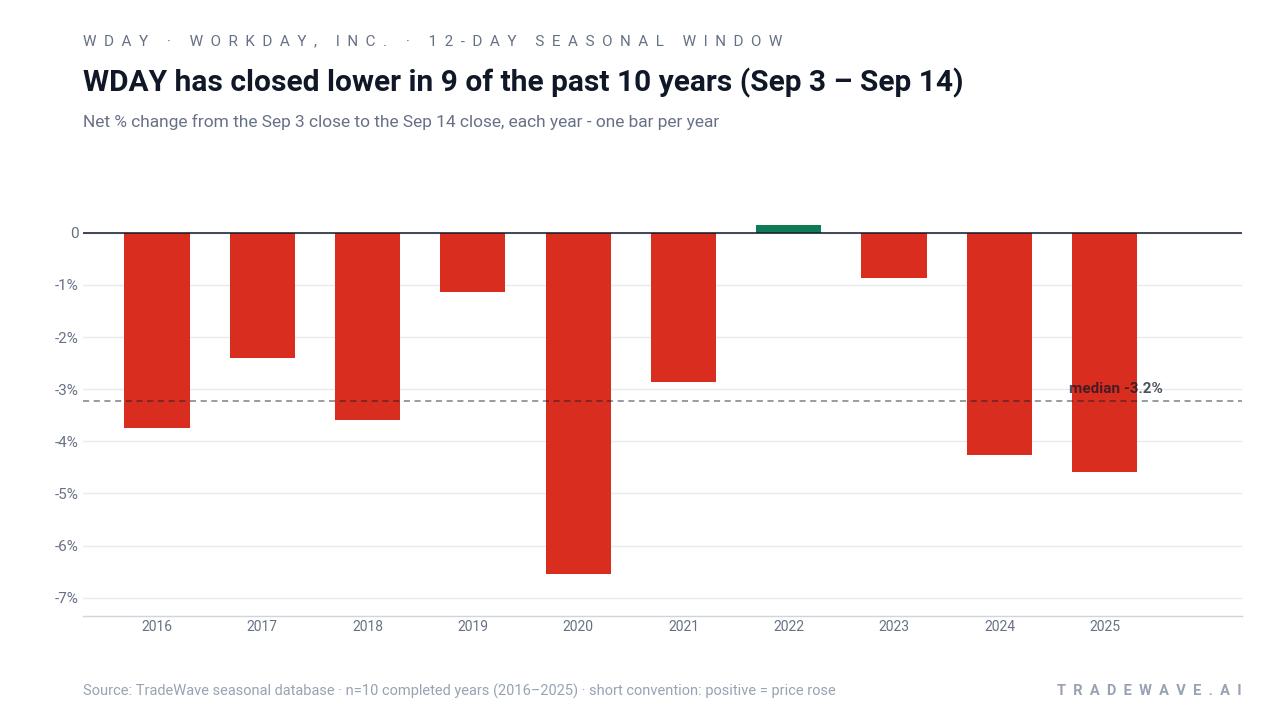
In this setup the trade direction is short, so years where WDAY drifts lower are the “wins” for the pattern. Across the 10-year lookback, 9 of those 12-day windows ended with the stock down, and only 2016 produced a meaningful countertrend rally for longs. The average profit for winning short years is 3.33%, while including the lone losing year still leaves the all-years average at 3%, which is unusually strong for such a brief window.
The per-year table shows how that plays out in practice. The strongest year for the short was 2020, when WDAY fell 6.54% between Sep 3 and Sep 14, with the worst intraperiod drawdown from entry reaching 9.69% before the window closed. At the other end of the spectrum, 2016 saw the stock rise 3.74% over the window, with a modest 5.25% adverse move against the short, underscoring that even the “bad” year for the pattern did not produce an extreme squeeze.
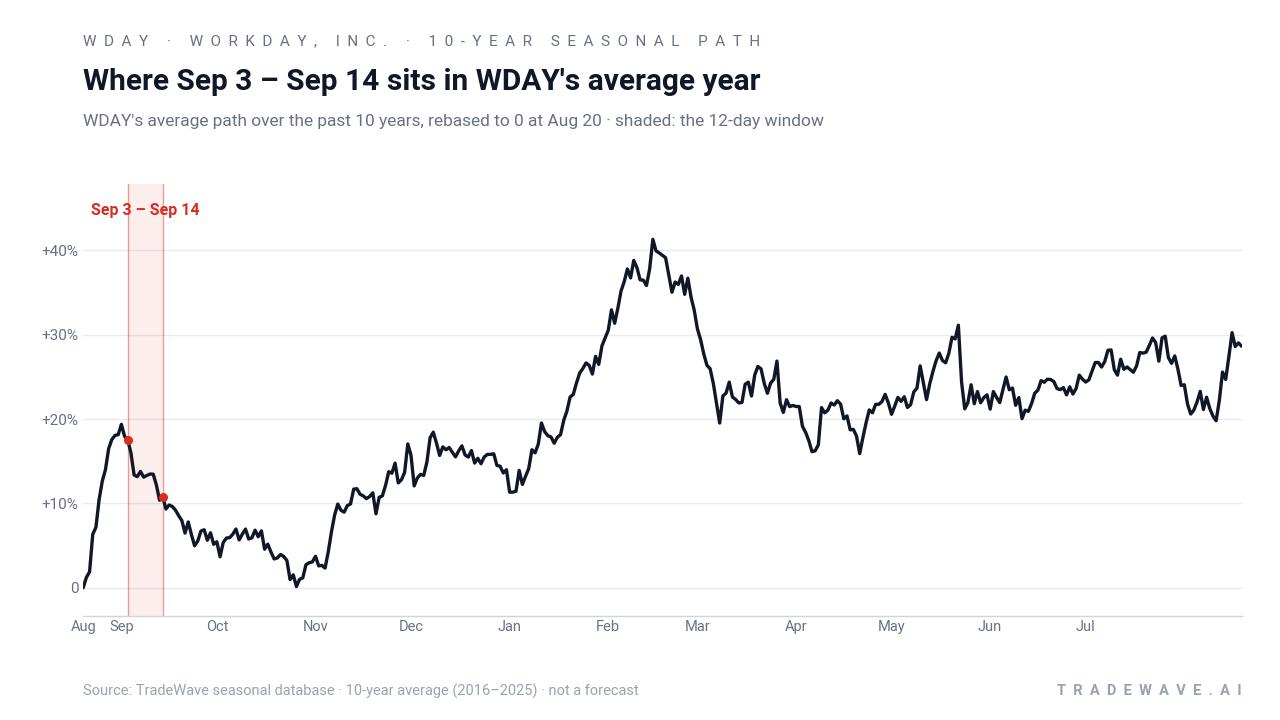
The next chart layers net results with the full intraperiod range, from worst drawdown to best rally, for each year in the window.
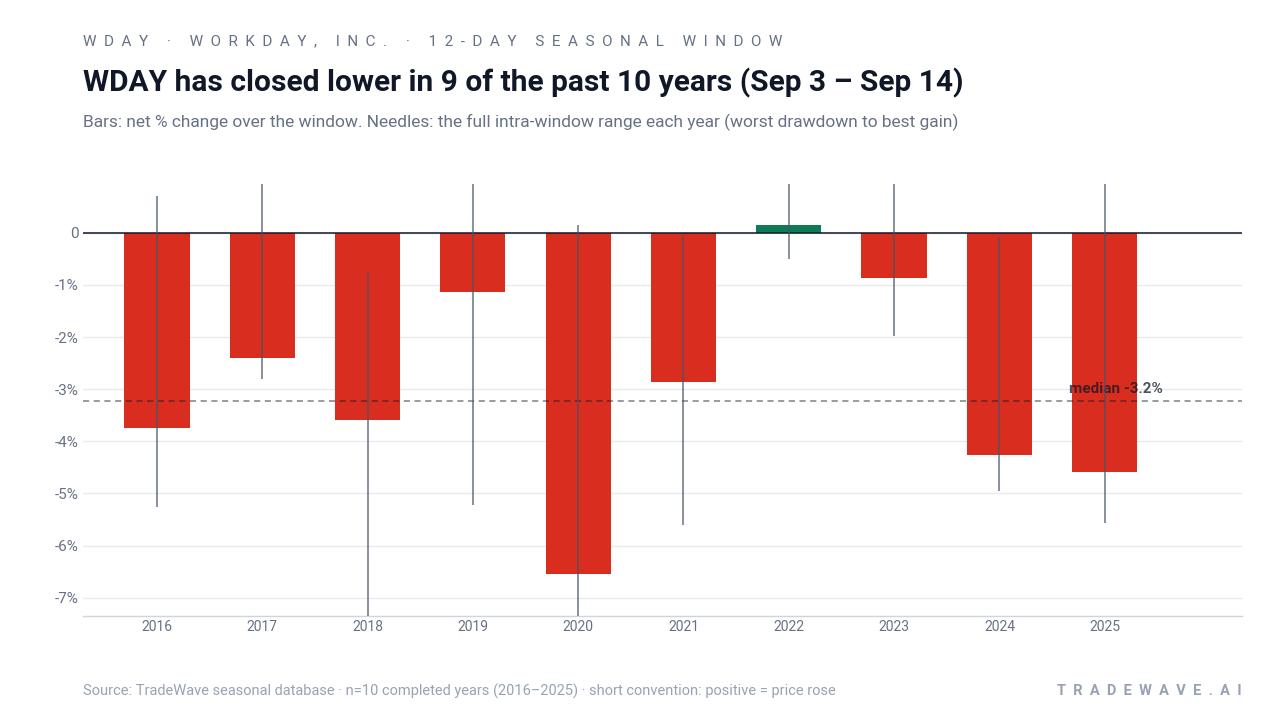
The maximum favorable move for shorts in several years has been in the mid single digits, while maximum adverse moves have occasionally pushed toward 10%, especially in 2018 and 2020. That mix points to a high-conviction but not low-volatility pattern: the short side has usually worked, yet traders have had to sit through meaningful swings along the way. The cumulative chart of stacking this 12-day window year after year compounds to roughly a one-third gain over the decade, which is a notable payoff for such a small slice of the calendar.
History does not guarantee future results; adverse excursions can be large even in winning windows, and past seasonal behavior may not repeat.
Why does Workday, Inc. (WDAY) follow this seasonal pattern?
This early-September WDAY seasonal trend likely reflects a mix of post-summer portfolio rebalancing and the enterprise software earnings calendar. One likely driver is that large institutional investors often reset exposure to higher-multiple software names ahead of the fall conference and budgeting season, which can pressure stocks like Workday after summer rebounds. The pattern may also capture recurring sector rotation as investors shift from growth software toward more cyclical or defensive areas into September, a month that has historically been choppy for equities overall.
What is driving Workday, Inc. (WDAY) today?
Workday shares jumped 4.1% to 198.42 in Thursday trading, extending a sharp rebound that has left the stock up 35.04% over the past month and still about 20.6% below its 52-week high of 249.85. The move builds on last week’s surge after Reuters reported that private equity firm Silver Lake is in talks to acquire Workday, a headline that sent the stock up nearly 18% in a single session and briefly made it the top percentage gainer on both the S&P 500 and Nasdaq 100.[2][4]
The buyout chatter has done more than just squeeze the stock price higher. Analysts told Reuters that a Silver Lake-led deal could help reset sentiment around traditional software valuations by signaling that deep-pocketed private equity still sees value in the space despite anxiety over artificial intelligence disrupting legacy platforms.[2] A separate analysis on Seeking Alpha argued that taking Workday private could give management more room to invest aggressively in AI without the quarter-to-quarter scrutiny of public markets, a theme that has resonated across the software sector.[1]
That backdrop matters because Workday had been under pressure earlier this year as investors questioned how quickly AI-native competitors might erode its edge in human capital and financial management software.[1] The prospect of a leveraged buyout at a premium has flipped that narrative, at least for now, and helped revive interest in software broadly. Reuters noted that the S&P 500 Software & Services index has climbed roughly 25% quarter-to-date, with Workday’s spike one of the more visible examples of renewed risk appetite in the group.[2]
The chart below situates the latest spike against Workday’s past year of trading and a median seasonal projection for the next two months.
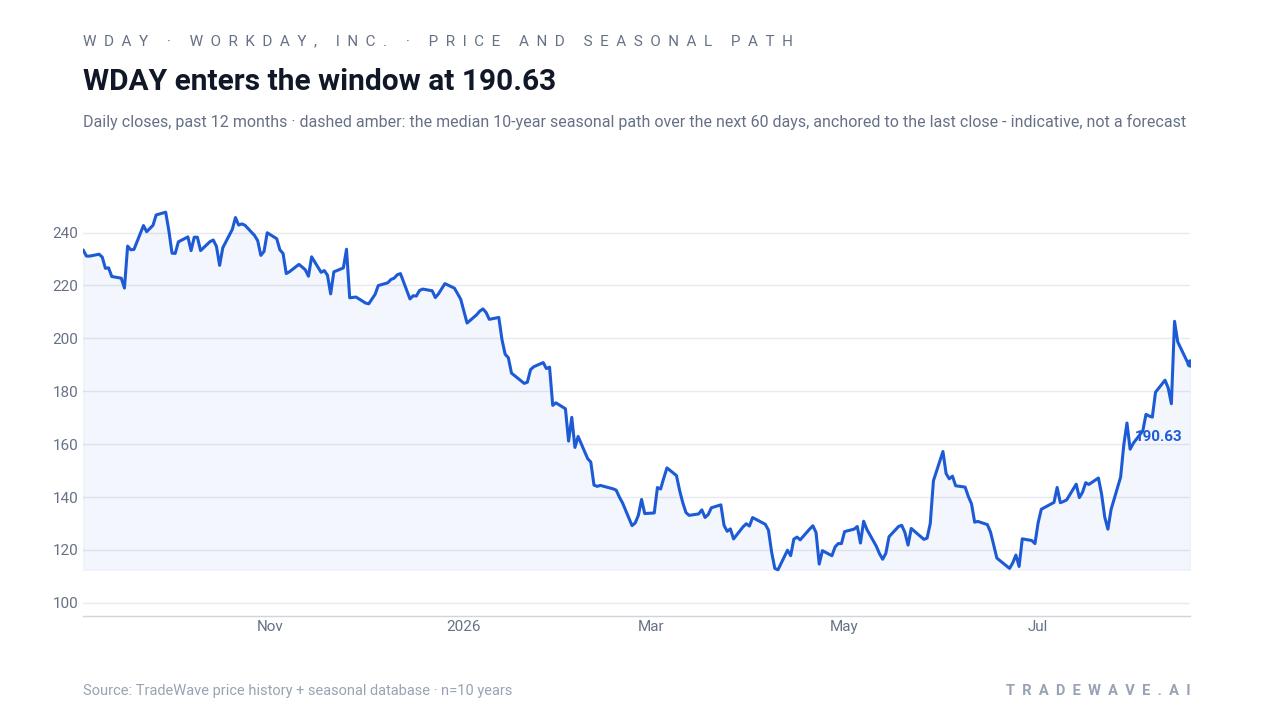
Fundamentally, Workday is not a distressed asset. For fiscal 2025 the company reported revenue of $9.6 billion, up 13%, and operating cash flow of $2.9 billion, up 19%, numbers that help explain why a financial sponsor like Silver Lake might be willing to pay a premium for control.[2] A Needham analyst cited in recent commentary suggested that Workday could be worth $240 to $250 per share in a takeover scenario, implying meaningful upside from current levels, though that estimate reflects a deal framework rather than a fresh public-market price target.[1]
Options activity has picked up alongside the takeover speculation, with WDAY’s options board drawing more attention from traders looking to position around a potential bid or deal break.[3][4] At the same time, at least one insider sale was reported in mid-July, when a Workday insider sold roughly $131,000 worth of stock, a modest transaction in the context of the company’s market value but a reminder that not all internal flows are pointing in the same direction.
What does earnings and guidance say about Workday, Inc. (WDAY)?
Workday has not yet set a public date for its next earnings release, but the latest reported fiscal year numbers show a business still growing at a healthy double-digit clip.[2] Revenue rose 13% to $9.6 billion in fiscal 2025, while operating cash flow increased 19% to $2.9 billion, suggesting that the company is converting growth into cash rather than simply buying it with higher spending.[2]
Formal forward guidance has been limited in the recent news flow, in part because the takeover narrative has overshadowed the usual quarterly cadence. Street commentary has focused more on what a private-equity owner might do with Workday’s cost structure and product roadmap than on the next quarter’s billings number.[1] Even so, the combination of steady growth and strong cash generation is central to the buyout math and to how public investors will value the stock if a deal does not materialize.
How do AI and software sector trends affect Workday, Inc. (WDAY)?
Workday sits at the intersection of two powerful themes: the shift of enterprise back-office functions to the cloud and the scramble to embed AI into every layer of software. Before the Silver Lake headlines, investor concern about AI disruption had weighed on Workday and its peers, as some feared that newer AI-native platforms could undercut incumbents on both capability and cost.[1] The buyout talks have temporarily flipped that script by framing Workday as an asset that sophisticated private capital wants to own, not avoid.
Sector-wide, the renewed interest in Workday has coincided with a broader rebound in software valuations. Reuters reported that the S&P 500 Software & Services index is up roughly 25% quarter-to-date, a move that suggests investors are again willing to pay for growth and recurring revenue after a period of skepticism.[2] If that shift in sentiment holds into September, it could set up an interesting clash between macro tailwinds and Workday’s historically weak early-September seasonal window.
How are analysts and valuation framing Workday, Inc. (WDAY)?
Traditional valuation markers like forward price-to-earnings are harder to pin down in the current environment because takeover speculation has become a key driver of the stock. A Needham analyst cited in recent coverage suggested that Workday could command $240 to $250 per share in a buyout, a range that sits well above the current price and implicitly bakes in confidence in the company’s growth and cash flow profile.[1] That framework is less a classic 12-month price target and more a view of what a financial sponsor might pay to take the company private.
For public investors, the question is how much of that potential premium to discount into today’s price given deal uncertainty, regulatory risk and the possibility that Workday remains independent. Against that backdrop, the upcoming seasonal window adds another layer: historically, early September has not been kind to WDAY’s share price, even in years when the fundamental story was intact. The stock pattern analysis suggests that traders who have chased late-summer strength in the past have often faced a tougher tape in the first half of September.
What should traders watch as Workday, Inc. (WDAY) approaches this window?
First, the calendar. The 12-day early-September window begins on Sep 3 and runs through Sep 14, a period that has historically seen WDAY close lower in 9 of 10 years with an average 3.33% gain for the short side. How the stock behaves as it enters that stretch will be an important tell on whether this year tracks the established WDAY seasonal trend or breaks it.
Second, the deal tape. Any confirmation, denial or change in tone around the Silver Lake talks could easily overwhelm seasonal tendencies in the short term.[2] Traders will be watching for additional reporting, regulatory chatter or commentary from Workday’s board that might clarify how advanced the discussions are and what price range is realistic.
Third, options and volume. The recent spike in trading activity around the Reuters headline showed how quickly positioning can swing when new information hits.[3][4] If options flow and share volume continue to build into early September, that would suggest that more investors are actively trading the takeover story, which could either amplify or mute the usual early-September weakness depending on whether the flow is skewed toward upside calls or downside protection.
Finally, levels. On the upside, traders will focus on how WDAY handles the 200 area and then the mid-200s region closer to its 52-week high of 249.85. On the downside, any sharp rejection from current levels as the Sep 3 window opens would be more consistent with the historical pattern, especially if it comes alongside broader softness in software after a strong quarter-to-date run. If instead the stock grinds higher through the window on sustained deal optimism, that would mark a rare break from a decade-long seasonal habit and signal that this year’s story is being written more by private-equity negotiations than by the calendar.
Sources
About this seasonal analysis
Seasonal pattern data is sourced from TradeWave.ai, which analyzes historical price behavior across annual calendar windows going back up to 30 years. Read the full data methodology or the book The 100-Year Pattern by Afshin Moshrefi (2026 edition). Past performance of seasonal patterns does not guarantee future results. This article is for informational purposes only and does not constitute investment advice.