HP Inc. (HPQ) Has Risen in 8 of 10 Midterm Windows, With Winners Averaging 28.55% Gains
HP Inc. is heading toward a historically strong midterm-year trading window just as shares jump above $28 and bullish options activity builds.
Price as of Jul 28, 2026: $28.29 (last close).
What is the seasonal pattern for HP Inc. (HPQ)?
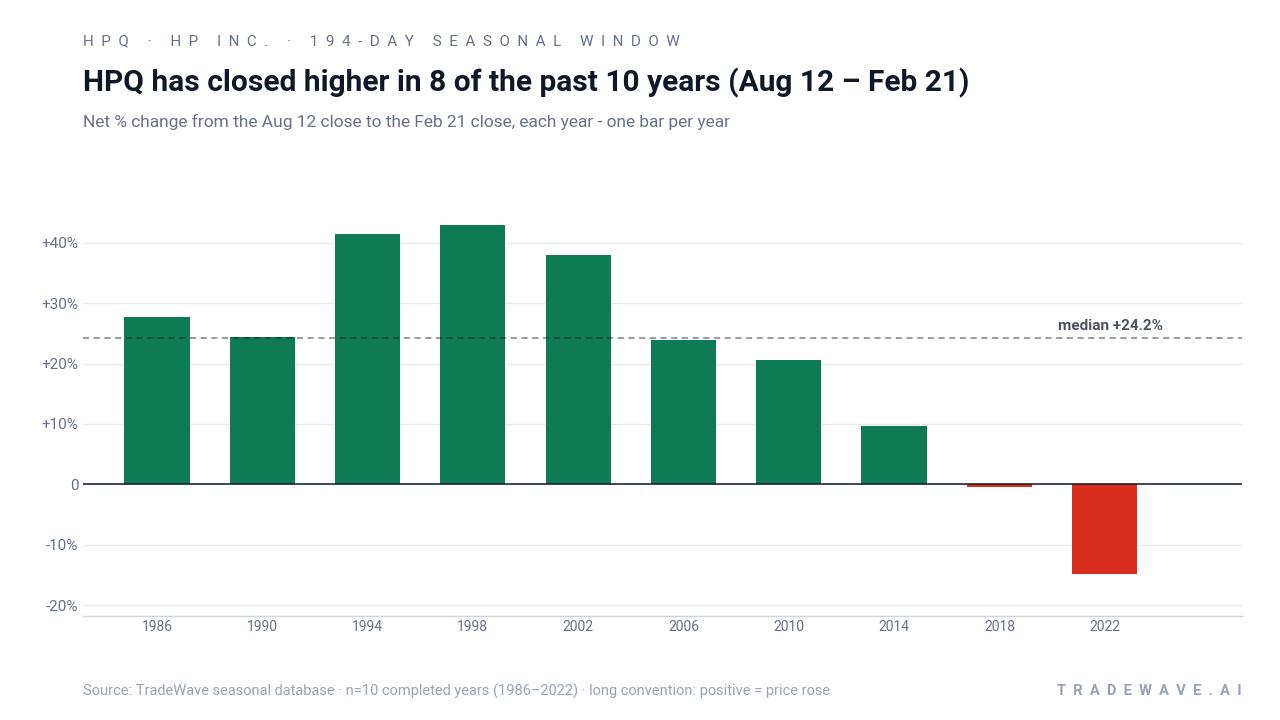
HP Inc. has risen in 8 of 10 years during the Aug 12 to Feb 21 midterm-year window, with an average gain of 28.55% in winning years.
- 8 for 10 in this window, with winning years averaging 28.55% gains and a 514% cumulative return when stacked across cycles.
- Percent Profitable is 80%, with 8 winners and 2 losers across the last 10 midterm election years in this 194-day HPQ seasonal trend.
- Including every year, Avg Profit - All is 21%, showing that losses have pulled down but not erased the strong upside bias.
- The trade direction is long, and the TradeWave Ratio (TWR) of 1.54 signals that price has typically traveled meaningfully in the trade direction within the window.
- Historical MFE/MAE ranges show that big rallies often come with sizable drawdowns inside the HP Inc. trading window, underscoring elevated volatility.
- This midterm-year seasonal pattern begins Aug 12 and runs 194 days into the pre-election year, overlapping a period that has often seen improving risk appetite for cyclicals.
According to historical data from TradeWave.ai, HP Inc. behaves very differently in the late-summer-to-winter stretch of midterm election years than it does in an average year. This next section looks at that specific seasonal window and how it lines up with today’s setup in HPQ.
How has HP Inc. (HPQ) traded in the upcoming Aug 12 to Feb 21 window?
HP Inc. has closed higher in 8 of the last 10 midterm election years during the Aug 12 to Feb 21 window, with winning years averaging gains of 28.55%. Shares finished Tuesday at $28.29, up 6.6% on the day and about 2.3% below their 52-week high of roughly $28.94. Recent reports of unusually heavy call buying, including activity around the July 17 $35 strike, suggest some traders are already positioning for upside in HPQ ahead of this historically strong stretch.[1]
The presidential election cycle matters here because this pattern is built only from midterm election years, a phase that often features tighter fiscal policy debates and more volatile risk appetite before the pre-election year typically loosens up. Pattern phase equals the midterm election year, while the calendar phase is also the midterm election year, and this 194-day HPQ seasonal pattern runs from Aug 12 deep into the following pre-election year. That means the historical results blend late-midterm uncertainty with the early pre-election tendency for investors to lean back into cyclicals and PC hardware names.
Across those 10 midterm-year samples, HPQ’s long-direction pattern shows an Annualized Return of 19.92% and a Cumulative Return of 514%. Percent Profitable sits at 80%, with 8 winners and 2 losers, and the Median Profit of 24.16% is not far from the 28.55% Avg Profit in winning years, which points to a fairly consistent upside skew rather than one or two outliers. When every year is included, Avg Profit - All drops to 21%, reflecting the drag from the two losing cycles but still leaving a strong positive bias for this HPQ seasonal trend.
The per-year table shows how that plays out in individual cycles. In 1998, HPQ gained 42.86% over the window, with a best intraperiod run-up of 62.2% and a worst drawdown of 9.21% from the entry. At the other end of the spectrum, 2022 was the weakest year, with a net loss of 14.79%, a maximum favorable move of just 1.93%, and a maximum adverse move of 29.89%, underscoring that even in a long-biased pattern, macro or company-specific shocks can overwhelm the historical tendency.
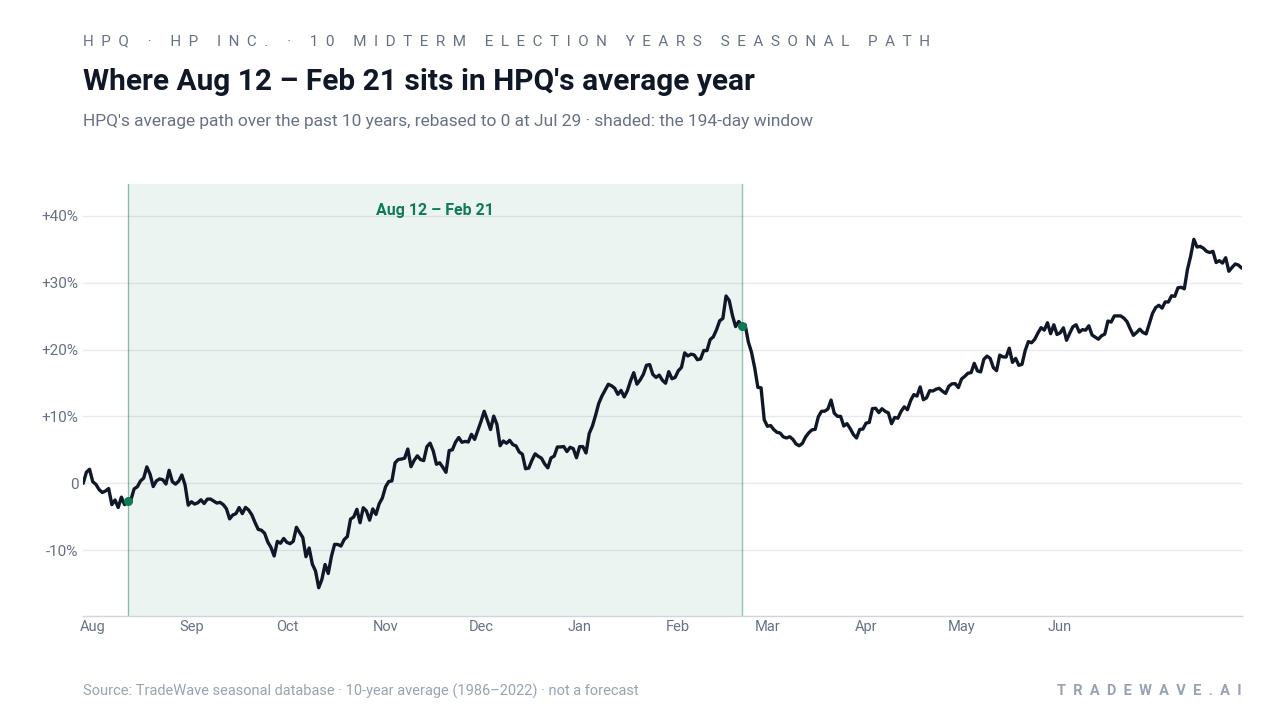
The historical seasonal average chart shows HPQ typically grinding higher into the start of the window, then accelerating through the fall and early winter before flattening out toward the end. That shape fits the idea that midterm-year volatility often peaks earlier in the year, while the late-year period into the pre-election year has tended to reward long exposure in cyclical tech and PC names.
The next view combines yearly net results with the full intraperiod range between best rally and worst drawdown.
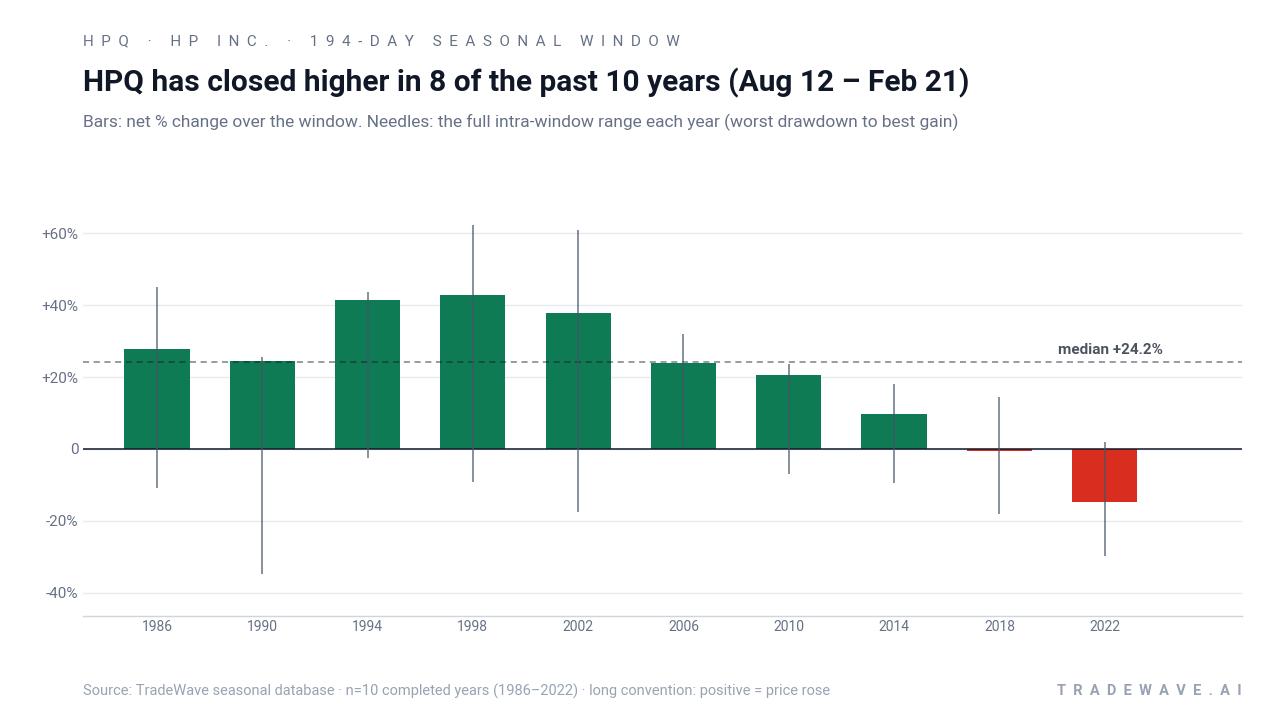
The combined net / MFE / MAE chart makes the volatility profile clear. In strong years like 2002, HPQ’s best intraperiod move reached 60.92% while the worst drawdown was 17.47%, showing that big rallies did not come without discomfort. In softer years such as 2018, the stock finished roughly flat at minus 0.46% despite a 14.43% best run-up and an 18.21% worst drawdown, a reminder that even when the final result is muted, the ride inside the window can be choppy.
History does not guarantee future results; adverse excursions (MAE) can be large even in winning windows.
Why does HP Inc. (HPQ) follow this seasonal pattern?
One likely driver is the clustering of HP’s fiscal Q4 and Q1 earnings, guidance updates, and PC product cycles in the late calendar year, which can pull forward demand and investor attention into this window.[1] Analysts have also pointed to sector rotation into value and cash-generative hardware names as the pre-election year approaches, especially when investors expect steadier policy and corporate spending.[3] The pattern may also reflect institutional portfolio rebalancing around HP’s fiscal year and the broader PC and printing sector outlook, which tends to firm up after midyear macro and regulatory debates in the midterm election year.[3]
What is driving HP Inc. (HPQ) today?
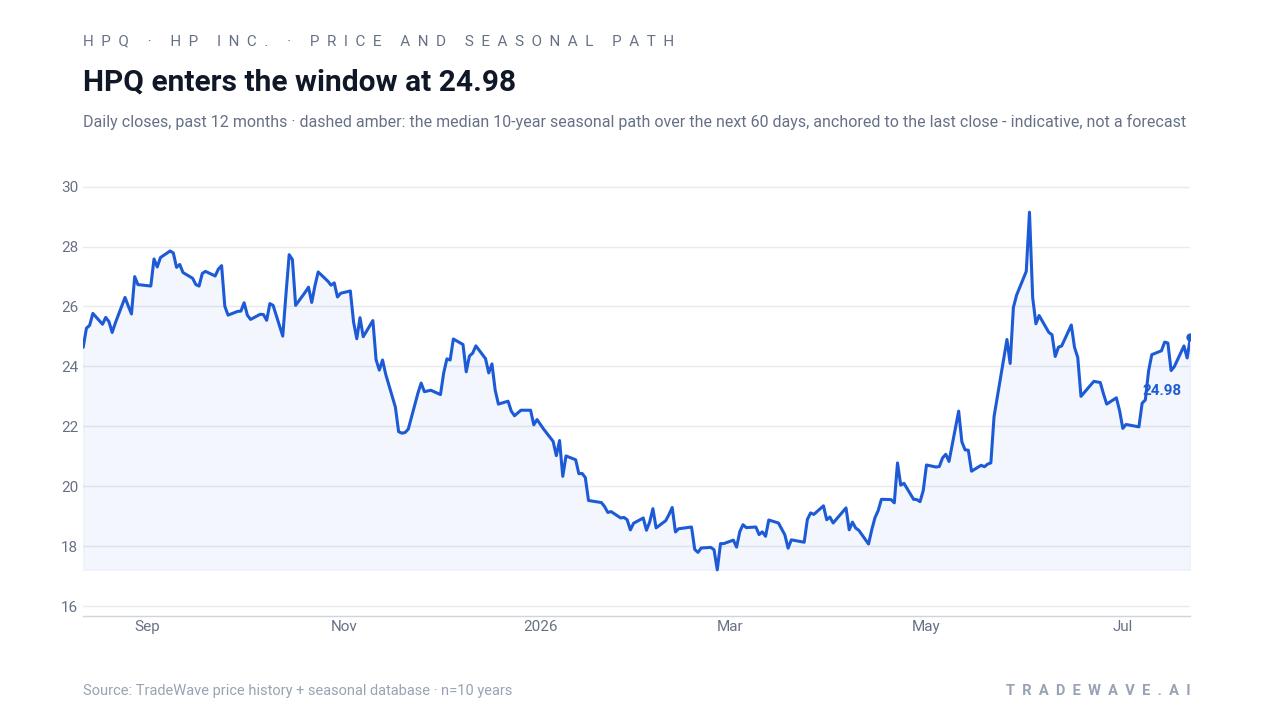
HPQ’s 6.6% jump to $28.29 on Tuesday came with heavy trading volume of about 25.4 million shares, well above its 20-day average of roughly 14.0 million, and leaves the stock just 2.3% below its 52-week high. The move extends a roughly 16.04% one-month rally and follows a stretch of upbeat fundamental news, including stronger fiscal 2026 results and an AI PC partnership that has helped reset expectations for revenue and free cash flow growth.[1]
In late May, HP reported fiscal Q2 2026 revenue of about $14.4 billion and an EPS beat, alongside a tie-up with Nvidia to push AI-capable PCs, a combination that has supported the bull case around a PC refresh cycle and higher-margin systems.[1] Earlier in the year, the company’s Q1 2026 release showed non-GAAP EPS up 9.5% year over year on 6.9% revenue growth, signaling that cost controls and mix are offsetting some of the pressure from a competitive PC and printing market.[2] Those results landed against a backdrop of prior cost-cutting and workforce reductions announced in November 2025, when HP trimmed its fiscal 2026 outlook and flagged trade-related regulation costs as a headwind.[3]
Options and positioning data add another layer. On Jun 1, Barchart highlighted unusually large call options volume in HPQ, including roughly 90 times normal activity in July 17 $35 calls, framing the flow as bullish positioning in the name.[1] More recently, MarketBeat reported that insider David P. McQuarrie sold 10,524 shares on Jun 12 at an average price of $24.68 under a Rule 10b5-1 plan, with insiders owning about 0.18% of the float, while ChartMill pegs short interest at 9.3%, leaving room for positioning to matter if the stock keeps grinding higher.[4][5]
On the macro side, analysts at Goldman Sachs have warned that rising input costs and intense PC competition could pressure HP’s margins into the back half of fiscal 2026 and into 2027, even as they raised their price target to $19 and kept a Sell rating.[3] That cautious stance sits alongside a ChartMill-aggregated analyst price target consensus of $23.17, which is well below the current share price and reflects an earlier, more conservative regime for HPQ rather than today’s stronger tape.[5] Add in sector commentary about memory and component cost pressure, and the picture is one of a company executing better than feared in a still-tough PC and printing market.[3]
The chart below situates the latest move in its recent multi-month context and overlays the median 60-day seasonal path.
What should traders watch as this HPQ seasonal window approaches?
First, the calendar: the 194-day window opens on Aug 12 and runs through Feb 21, spanning the late-midterm and early pre-election year, a phase that has historically been friendly to long HPQ exposure. Second, levels: traders will be watching whether HPQ can hold above its 50-day moving average around $23.88 on any pullbacks and whether a sustained break above the recent 52-week high near $28.94 comes with confirming volume. Third, catalysts: the next earnings report, scheduled around late August for fiscal Q3 2026, will test the AI PC narrative, margin resilience, and management’s tone on input costs and competition.[1][2][3]
The final piece is positioning. If the unusual call options activity seen in June continues or builds into later expiries, it would signal that speculative and hedging demand is leaning into the same direction as the historical seasonal pattern.[1] A fade in call volume, a rise in put activity, or a sharp increase in short interest would tell a different story and could set up a more volatile path through a window that has usually rewarded patience on the long side.[5] How HPQ trades inside this Aug 12 to Feb 21 stretch, relative to both its seasonal history and the evolving options and short-interest picture, will be the real test of whether this midterm-year pattern shows up again.
Sources
- Barchart – HP Inc. Has Unusual Call Options Volume Today - Investors Bullish on HPQ Stock (Jun 1, 2026)
- HP Investor Relations – HP Inc. Reports Fiscal 2026 First Quarter Results (Feb 24, 2026)
- CNBC – HP (HPQ) Q4 earnings report 2025 and workforce cuts (Nov 25, 2025)
- MarketBeat – HP Target of Unusually Large Options Trading (NYSE:HPQ) (Jul 28, 2026)
- ChartMill – HPQ Stock Price, Quote & Profile, including analyst targets and short interest (Jul 25, 2026)
About this seasonal analysis
Seasonal pattern data is sourced from TradeWave.ai, which analyzes historical price behavior across annual calendar windows going back up to 30 years. Read the full data methodology or the book The 100-Year Pattern by Afshin Moshrefi (2026 edition). Past performance of seasonal patterns does not guarantee future results. This article is for informational purposes only and does not constitute investment advice.