This 212-Day Sep-Apr Window Has Delivered 164% Cumulative Gains for Amphenol (APH)
Amphenol is heading toward a historically strong Sep–Apr trading window just as shares cool from recent highs and options positioning turns more active.
Price as of Aug 13, 2026: $165.75 (last close).

What is the seasonal pattern for Amphenol (APH)?
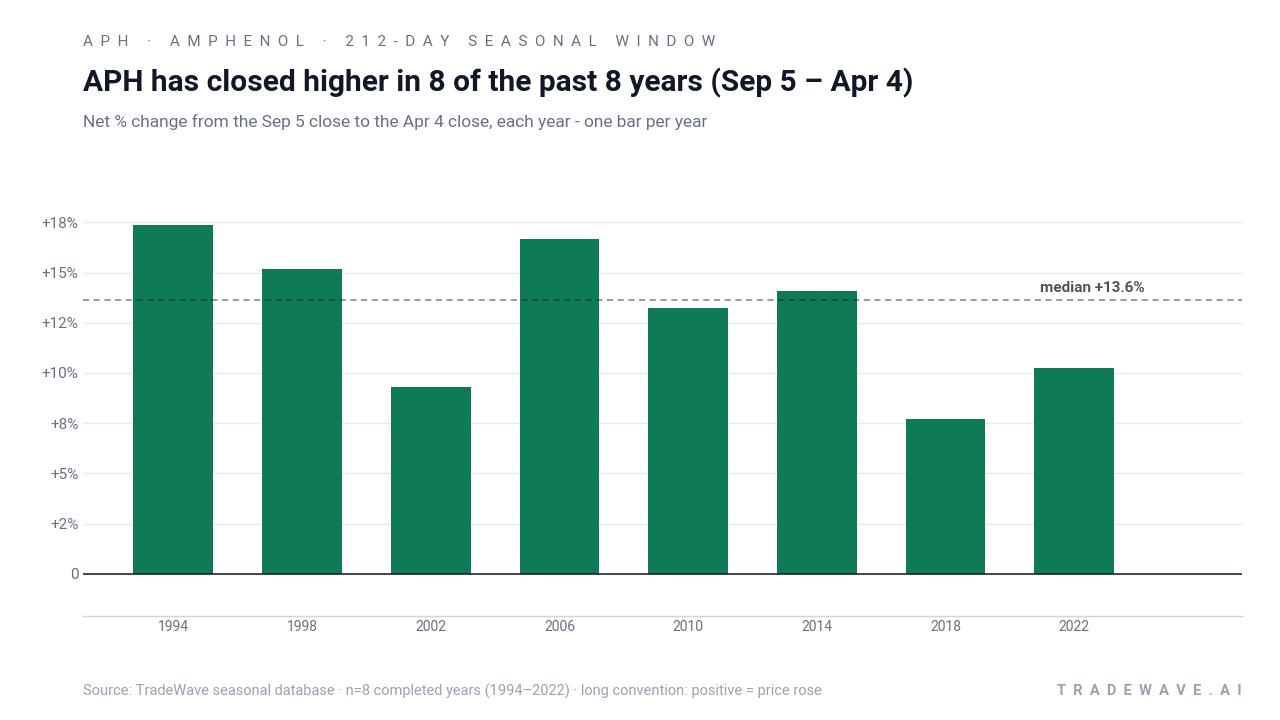
Amphenol has risen in 8 of 8 midterm-year Sep 5–Apr 4 windows, with an average gain of 12.98% in winning years.
- 8 for 8 in this window, averaging 12.98% gains in winning years across the last 8 midterm election cycles.
- Seasonal window runs 212 days from Sep 5 to Apr 4, aligning with the late midterm year into the start of the pre-election year.
- Percent Profitable is 100%, with 8 winners and 0 losers over the historical sample.
- Average winner gain of 12.98% compounds to a 164% cumulative return when the window is stacked across all 8 years.
- Intraperiod swings have been meaningful, with individual years showing double-digit peak run-ups and double-digit drawdowns before finishing higher.
- Risk-adjusted performance is strong, with a Sharpe ratio of 3.02 and a TradeWave Ratio of 2.43 for this long setup.
According to historical data from TradeWave.ai, this upcoming Sep–Apr stretch has behaved very differently from an average year for Amphenol. The next section walks through how that pattern has played out in prior midterm election cycles.
How has Amphenol (APH) traded in the Sep–Apr midterm-year window?
Amphenol has finished higher in every single Sep 5–Apr 4 window across the last 8 midterm election years, averaging a 12.98% gain for long positions. Today the stock closed at $165.75, down 2.5% on the day and about 7.1% below its 52-week high of $178.52, after a strong run that has already priced in a big chunk of the AI data center story.[3] A notable July options trade sold 5,500 July 17, 2026 $105 puts for $1.40, a bullish stance that effectively expressed confidence in the stock staying well above that strike over the coming year.[9] The combination of a clean 8-for-8 seasonal record, a pullback from highs, and visible options appetite for downside exposure sets up a window that growth-focused traders will be watching closely.
The pattern is built specifically on midterm election years, which matters because policy and liquidity often look very different in this phase than in the presidential election year or the year after. In midterm years, Washington tends to be gridlocked while the Federal Reserve and corporate capital spending plans do more of the heavy lifting, a backdrop that has historically favored steady compounders in infrastructure-heavy sectors like electronics connectors.[3]
Across the 8 completed midterm cycles since 1994, every Sep 5–Apr 4 window for Amphenol has been profitable for a long-only approach. The average gain of 12.98% sits close to the median profit of 13.64%, which tells you the distribution of outcomes has been tight rather than skewed by one monster year. Add it up and stacking those 212-day windows compounds to a 164% cumulative return across the sample, a powerful result for a single recurring slice of the calendar.
Individual years still looked very different under the surface. In 1994 the stock gained 17.35% over the window, with a best intraperiod run-up of 31.75% and a worst drawdown of 4.21% from the entry. In 2002 the net gain was a more modest 9.3%, but the path was rougher, with the worst drawdown reaching 26.16% even though the window ultimately finished in the green. That mix of strong closes and sometimes deep mid-window dips is exactly what the TradeWave Ratio of 2.43 is flagging: price has tended to travel meaningfully in the trade direction, but not in a straight line.
The maximum favorable move, or MFE, has often arrived well before the final day of the window. In 2010, for example, Amphenol’s best intraperiod gain reached 27.97% even though the final net return settled at 13.23%. The maximum adverse move, or MAE, has varied widely by year, from less than 1% in 2010 to nearly 20% in 1998 and 20.8% in 2018, underscoring that even “all green” windows can involve sharp shakeouts along the way.
A second view that layers net returns with both best and worst intraperiod swings shows how much room the stock has historically had to roam inside this window.
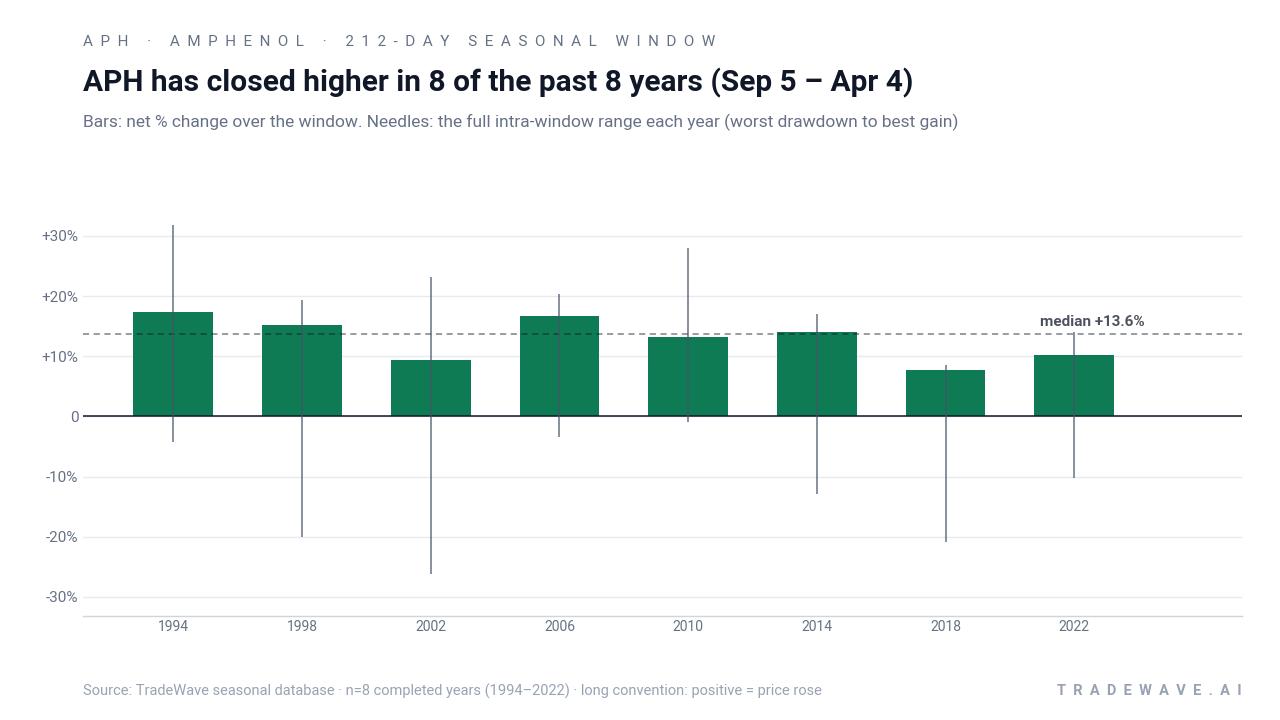
History does not guarantee future results; even in windows where Amphenol has finished higher, adverse excursions have at times been large before the trend resumed.
The single most important takeaway is simple: in the last 8 midterm election years, Amphenol is 8 for 8 in this 212-day Sep–Apr window, with double-digit average gains but enough volatility inside the window to punish weak hands.
Why does Amphenol (APH) follow this seasonal pattern?
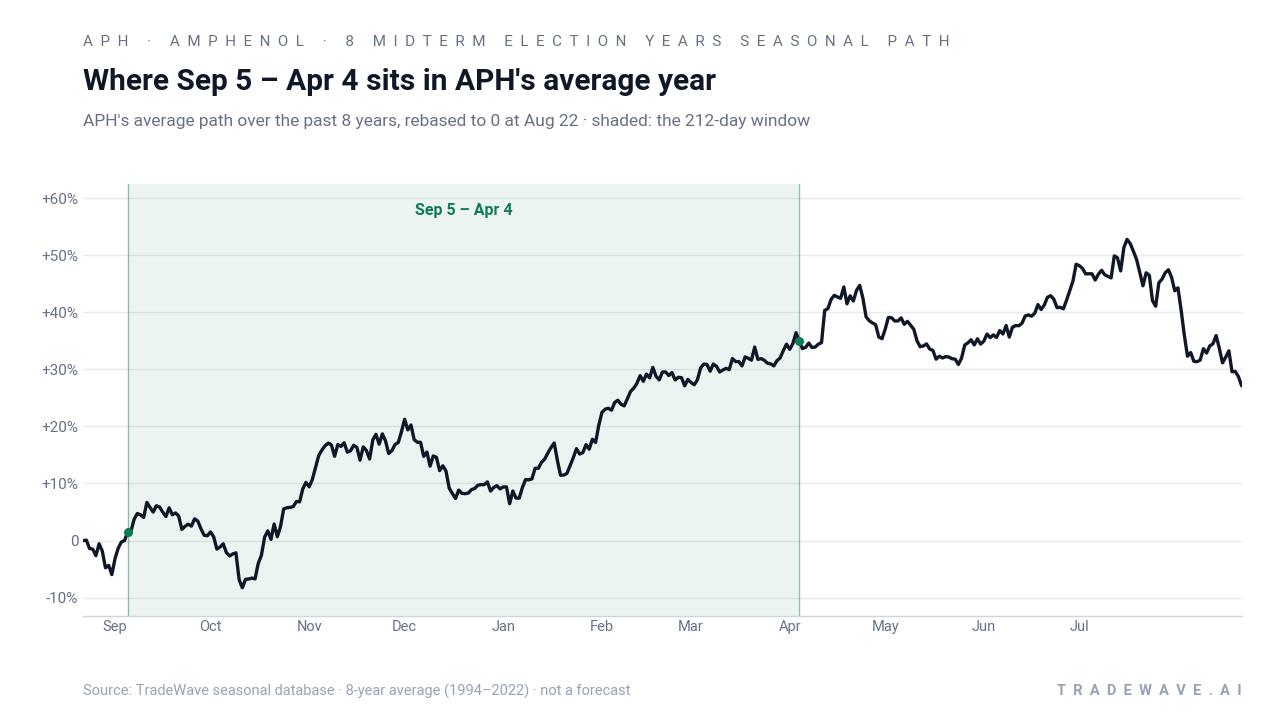
One likely driver is the way Amphenol’s earnings calendar and capital spending cycles line up with the broader presidential election cycle. The Sep–Apr stretch captures Q3 and Q4 results plus early guidance for the following year, a period when AI infrastructure and data center demand themes have repeatedly shown up in management commentary and analyst revisions.[2][3] This pattern may also reflect institutional portfolio repositioning into durable growth names after midyear volatility, as investors lean into secular stories like connectors and interconnects while policy noise around the midterm vote fades into the background.
What is driving Amphenol (APH) today?
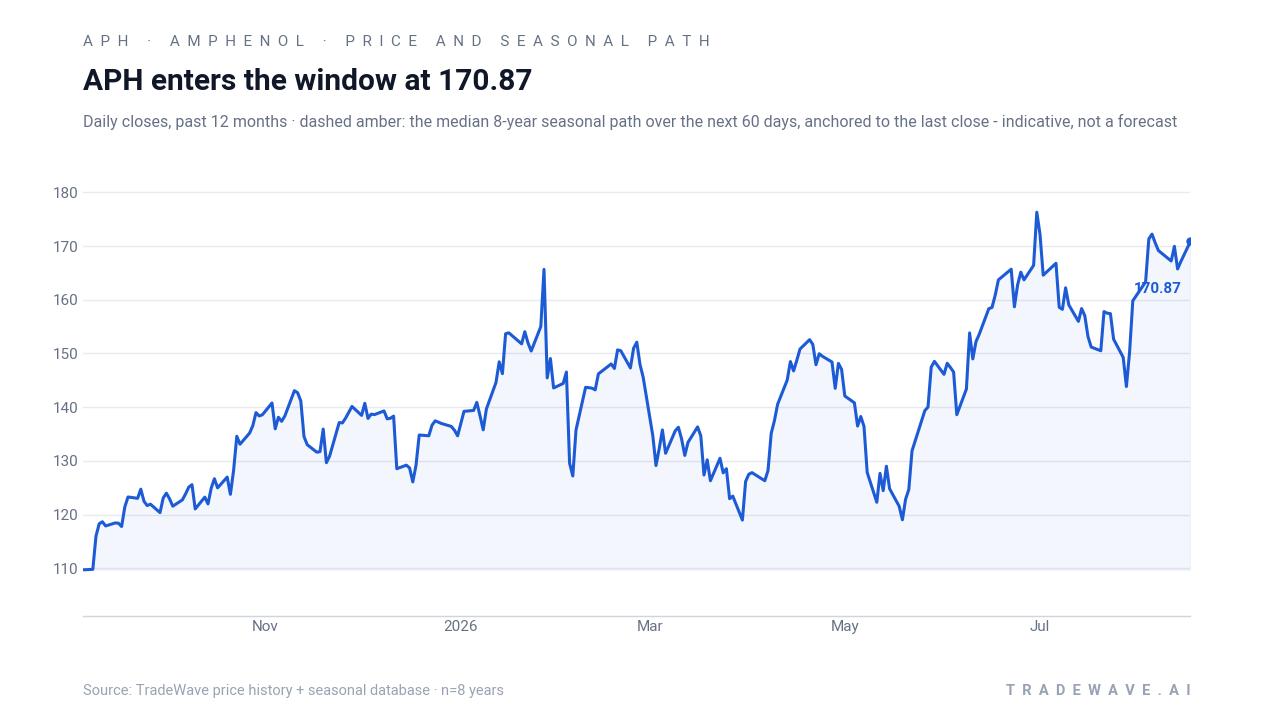
Amphenol closed Friday at $165.75, down 2.5% on the day, after trading between $165.27 and $170.40, with roughly 4.1 million shares changing hands. The stock sits about 7.1% below its 52-week high of $178.52 and above its 50-day moving average of $158.79, with one-month performance still up 8.23%, a sign that the pullback comes after a strong summer run. The near-term story remains tied to AI data center demand and the company’s ability to keep beating expectations: Q1 2026 revenue of $7.62 billion topped consensus by 7.19%, while EPS of $1.06 beat by 11.58%, and management guided to Q2 EPS growth of 43%–45% year over year on revenue of $8.1–$8.2 billion.[3][5] Street research framed that guidance as another validation of Amphenol’s AI infrastructure thesis, arguing that hyperscale and cloud customers are still in the early innings of upgrading interconnect-heavy systems.[3][7]
Options activity has added another layer to the picture. Coverage in mid-July highlighted a trade that sold 5,500 July 17, 2026 $105 puts for $1.40, collecting roughly $770,000 in premium and effectively expressing confidence that Amphenol will remain well above that level over the next year.[9] Barchart’s options analytics have also focused on implied volatility and expected moves around earnings, with traders watching how support zones line up with heavy open interest strikes.[7][8] Against that backdrop, the upcoming Sep–Apr seasonal window is less about calling a top or bottom and more about understanding how a historically favorable stretch might interact with a stock that has already delivered a 67% annual surge into mid-2026 and is now being debated on valuation as much as growth.[6]
The chart below situates the latest pullback against Amphenol’s past year of trading and the median 60-day seasonal path.
What should traders watch as the Sep–Apr window approaches?
First, the calendar. The 212-day window begins on Sep 5 and runs through Apr 4, overlapping the end of the midterm election year and the early part of the year before the presidential election, a phase that has often been friendlier to risk assets as policy uncertainty eases and corporate guidance firms up. Traders will be watching whether Amphenol’s price action into late August stabilizes above the 50-day moving average and whether dips continue to attract buyers, in line with the historical pattern of pullbacks being bought inside this window.[3]
Second, earnings and macro catalysts. The company’s Q2 2026 report on Jul 29 will set the tone for how much of the AI data center upside is already in the numbers and how much is still optionality.[2][3] Any shift in guidance around hyperscale spending, networking upgrades, or industrial demand could change how investors treat the upcoming seasonal tailwind. On the macro side, rate expectations and tech-sector risk appetite will matter: a friendlier backdrop for growth stocks has historically amplified Amphenol’s seasonal strength, while tighter financial conditions have tended to show up as deeper intraperiod drawdowns even when the window ultimately finished higher.[6][7]
Third, options and positioning. The large put-selling trade around the $105 strike is a clear marker of where at least one player is comfortable taking on downside risk, and follow-on activity will show whether that confidence is spreading or fading.[9] If options flow continues to skew toward put selling and call buying as Sep 5 approaches, it would signal that traders are leaning into the historical seasonal bias; if instead protection demand builds and implied volatility stays elevated, it would suggest more skepticism about replaying the 8-for-8 record.
Finally, behavior inside the window itself will be the real test. A pattern of higher lows and steady grind-ups through earnings season would be consistent with the historical Amphenol trading window. A break of key support levels with no quick recovery, or a year that finally ends the 100% win streak, would tell you that the election-cycle backdrop or the company’s growth profile has shifted enough to override the old playbook. For now, the message from history is clear: this specific Sep–Apr stretch has been one of the most reliable bullish seasonal patterns in Amphenol’s record, but it has rarely rewarded complacent entries or tight stops.
Sources
- Zacks.com, "Here's Why Amphenol (APH) is a Strong Growth Stock" (May 7, 2026).
- Yahoo Finance (Zacks content), "Will Amphenol (APH) Beat Estimates Again in Its Next Earnings Report?" (Jul 15, 2026).
- Yahoo Finance (Zacks content), "Is Amphenol Stock a Smart Buy Before Q2 Earnings Report?" (Jul 31, 2026).
- Yahoo Finance (Barchart content), "Are Wall Street Analysts Predicting Amphenol Stock Will Climb or Sink?" (Feb 5, 2026).
- Yahoo Finance (Zacks content), "Amphenol (APH) Reports Q1 Earnings: What Key Metrics Have to Say" (Apr 29, 2026).
- Yahoo Finance, "Amphenol (APH) Stock After 67% Annual Surge Are Growth Expectations Getting Stretched" (Jun 13, 2026).
- Barchart, "Amphenol's AI Infrastructure Thesis Gets Its Most Important Validation Yet" (Jul 28, 2026).
- Barchart, "APH Options Prices for Amphenol Corp Stock - Barchart.com" (Aug 8, 2026).
- Yahoo Finance, "Is Amphenol Corporation (APH) A Good Stock To Buy Now?" (Jul 15, 2026).
About this seasonal analysis
Seasonal pattern data is sourced from TradeWave.ai, which analyzes historical price behavior across annual calendar windows going back up to 30 years. Read the full data methodology or the book The 100-Year Pattern by Afshin Moshrefi (2026 edition). Past performance of seasonal patterns does not guarantee future results. This article is for informational purposes only and does not constitute investment advice.