Kimberly-Clark (KMB) Has Dropped in 9 of 10 Sep 8-Oct 21 Windows, Averaging 4% Declines
Kimberly-Clark is up solidly in 2026, but a historically weak 44-day early-fall trading window is about to open just as the dividend stalwart heads toward its next earnings report.
Price as of Sep 2, 2026: $109.29 (last close).

What is the seasonal pattern for Kimberly-Clark (KMB)?
Kimberly-Clark has fallen in 9 of 10 years during the Sep 8 to Oct 21 window, with an average loss of 5.32% in winning years for the short-side pattern.
- 9 for 10 in this window on the short side, with average winning-year declines of 5.32% across the past decade.
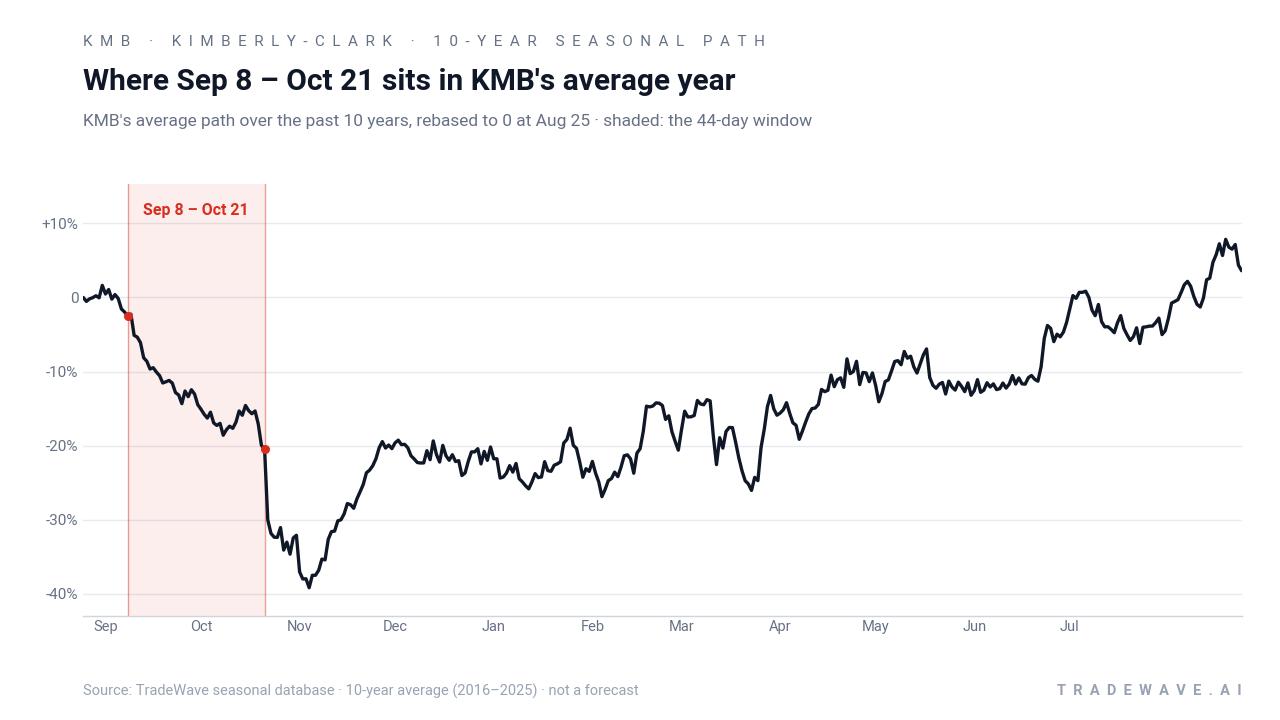
- The 44-day window runs from Sep 8 to Oct 21 and has historically been a seasonally weak stretch for KMB.
- Percent Profitable sits at 90%, with 9 winning short years and just 1 losing year in the sample.
- Including every year, Avg Profit - All is a 4% decline, showing that the lone losing year only modestly offsets the typical downside.
- Intraperiod swings have been meaningful, with a TradeWave Ratio of 2.3 and a Sharpe ratio of 0.95 for the short pattern.
- Maximum adverse moves against the short have at times been sharp, so downside for bears has historically been real even in a weak seasonal window.
According to historical data from TradeWave.ai, this early-fall stretch in Kimberly-Clark has behaved very differently from an average month on the calendar, and the next iteration is only days away.
How has Kimberly-Clark (KMB) traded in the Sep 8 to Oct 21 window?
Kimberly-Clark has declined in 9 of the past 10 years during the Sep 8 to Oct 21 window, with the short-side pattern posting average winning-year gains of 5.32% and a 4% decline when every year is included. Shares finished Thursday at 109.29, up 2.1% on the day and about 8.6% higher year to date, leaving the consumer staples name roughly 10.4% below its 52-week high and about 21.5% above its 52-week low. The combination of a strong historical seasonal bias to the downside and a stock that has already bounced off last year’s lows sets up a clean test of whether this early-fall softness shows up again in 2026.
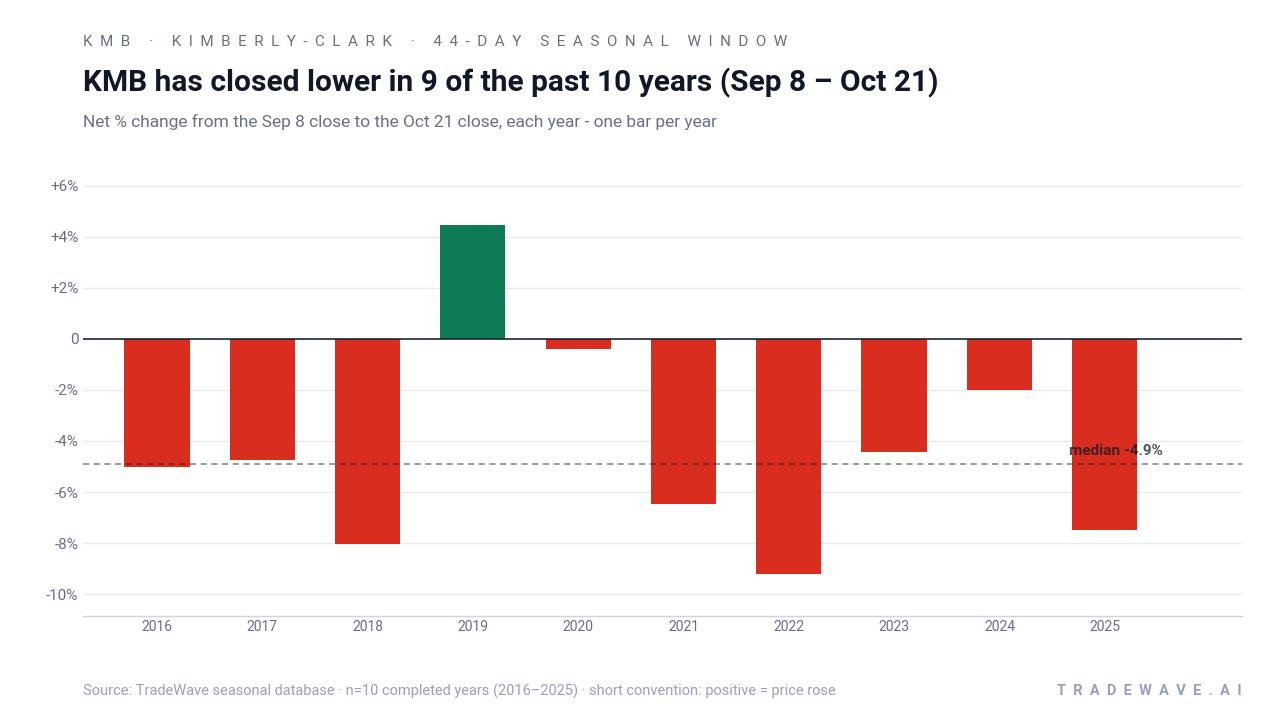
Trade direction for this pattern is explicitly short, so years in which KMB fell over the window count as winners for the strategy. Across the 10-year lookback, 9 such short trades would have finished in the green, with only 2019 posting a losing outcome as the stock rose 4.44% between the Sep 8 and Oct 21 closes. The median move over the window is a 4.88% decline, and the cumulative return from stacking the pattern each year comes to 51%, which is consistent with a persistent, if not spectacular, seasonal headwind.
Intraperiod behavior has not been one-way. Maximum favorable excursions, the best point-to-peak move in the trade direction within each window, have at times been larger than the final net change, while maximum adverse excursions, the worst drawdown from entry, show that even winning years often saw KMB move against the short before rolling over. In 2022, for example, the stock’s net decline of 9.2% came with a worst intraperiod move of 13.35% against the long side, underscoring how sharp the downswings have been in weaker years.
A second view combines net results with the full intraperiod range to show how far KMB has tended to swing inside the window.
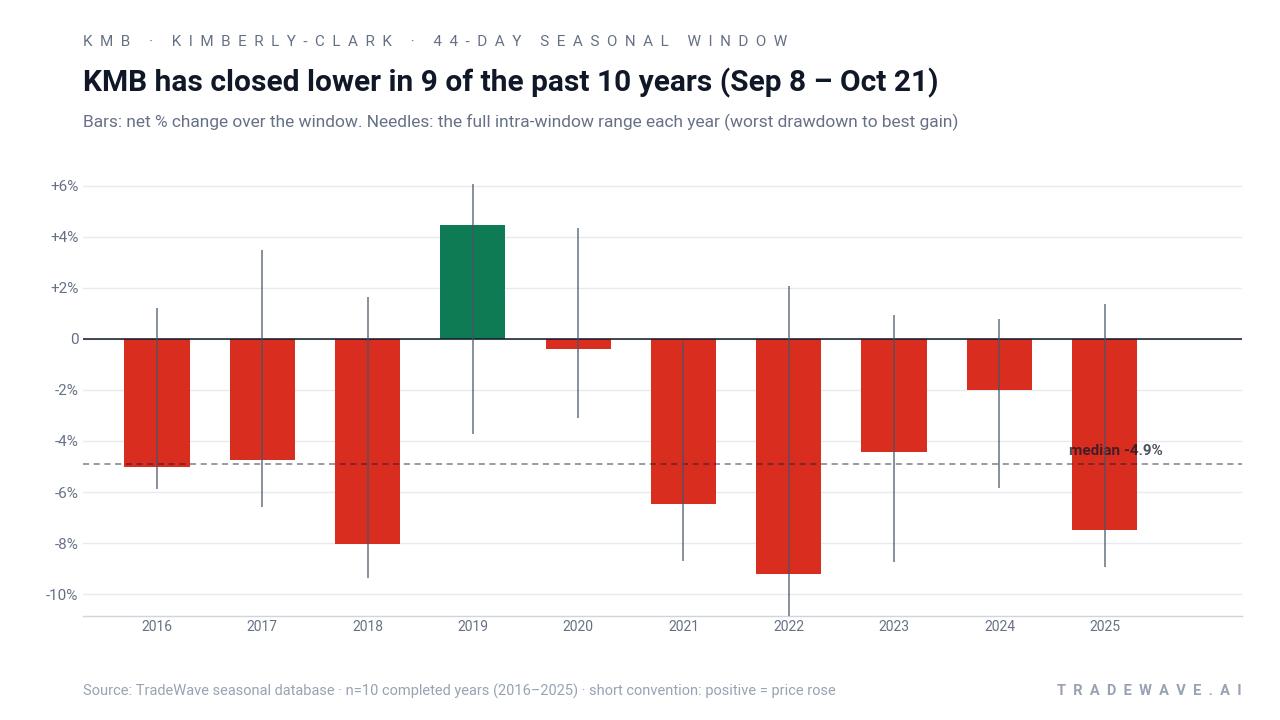
The stacked net, best-case and worst-case excursions show a pattern of steady downside with room for squeezes. In several years, including 2018 and 2025, the worst drawdown against the short was in the high single digits, while the best move in favor of the short also reached mid to high single digits. That mix aligns with a TradeWave Ratio of 2.3, which signals that price has typically traveled meaningfully in the trade direction at some point during the window, even if the final close did not capture the full swing.
The bottom line is simple: this is a historically weak slice of the calendar for Kimberly-Clark, and the record is not a coin flip. Nine for ten is a strong batting average for any seasonal pattern, especially when the all-years average still points to a 4% decline over just 44 days.
Why does Kimberly-Clark (KMB) follow this seasonal pattern?
One likely driver is the way consumer-staples stocks trade around back-to-school and early holiday inventory resets, when retailers and manufacturers fine-tune orders and pricing. Analysts also point to portfolio repositioning in the fourth quarter, as institutions rotate between defensive names like Kimberly-Clark and higher-beta sectors ahead of year-end reporting. The combination of these flows may leave KMB more vulnerable to profit-taking and valuation resets in September and October than in other parts of the year.
History does not guarantee future results; adverse excursions within the window can be large even in years that ultimately follow the seasonal pattern.
What is driving Kimberly-Clark (KMB) today?
Kimberly-Clark shares closed Thursday at 109.29, up 2.1% on the session, extending their 2026 advance to about 8.6% and leaving the stock roughly 10.4% below its 52-week high of 121.90 and about 21.5% above its 52-week low near 89.93. Trading volume of roughly 3.9 million shares ran ahead of the 20-day average of about 2.9 million, consistent with a pattern of episodic volume spikes that has shown up several times in August 2026.[1]
The near-term fundamental focus is the next earnings report, scheduled for Oct 29, 2026, after the close, when the company is expected to post earnings per share of $1.75 for the quarter ending September 2026.[5] Kimberly-Clark last topped expectations for the comparable quarter ending September 2024, delivering EPS of $1.83 versus a Zacks consensus of $1.69, an 8.28% surprise that helped reinforce the company’s reputation as a steady, if unspectacular, earner.[5] That history of modest beats sets a bar for management as investors weigh how much of the 2026 improvement is already reflected in the stock.
On the Street, the name sits squarely in “show-me” territory. MarketBeat’s aggregated data show a consensus Hold rating, with the latest breakdown including 1 strong buy, 4 buys, 11 holds and 1 sell, and a consensus price target around 117.93 from MarketBeat’s compilation of analyst models.[2][3][4][6] That target implies modest upside from Thursday’s close, consistent with the view that Kimberly-Clark is fairly valued for a mature consumer-staples business with dependable cash flows but limited growth.
Institutional interest remains active. Recent filings highlighted new or expanded positions from firms such as Sanctuary Advisors LLC and Connor, Clark & Lunn Investment Management, which have been adding exposure even as the broader analyst community stays neutral.[2][6] At the same time, GuruFocus has flagged a 4.66% dividend yield and more than five decades of dividend growth as key pillars of the bull case, while also noting that valuation metrics look attractive relative to some peers but growth and financial strength are more mixed.[8]
Insider behavior has been balanced over the longer term, with roughly $1.0 million of buys and $1.0 million of sells over the past 12 months, but the past three months have seen about $0.7 million of net selling and no reported insider buying, according to GuruFocus.[7] That pattern is not extreme for a large, mature company, yet it adds a subtle note of caution as the stock heads into a historically soft seasonal stretch and an earnings print that will need to justify the year-to-date rebound.
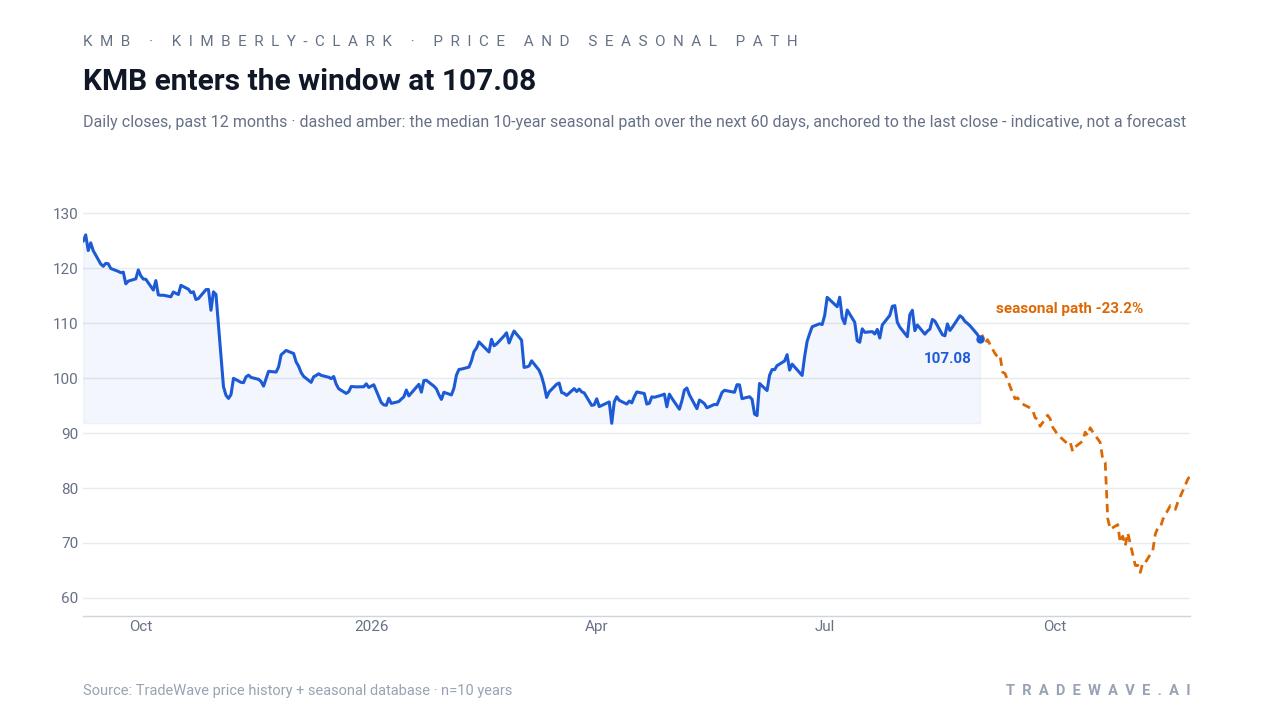
The chart below situates the latest move in its recent multi-month context and overlays the median seasonal path for the coming weeks.
What should traders watch in this Kimberly-Clark (KMB) window?
The key test over the next several weeks is whether KMB respects its early-fall seasonal pattern or breaks it. Historically, the stock has tended to drift or slide lower between Sep 8 and Oct 21, even in years when the broader market or consumer-staples sector was firm. If the shares start to roll over from the 109 to 112 area and trade back toward the mid-100s, that would be consistent with the 10-year pattern of mid-single-digit declines in this window.
Earnings on Oct 29 sit just beyond the end of the seasonal window, which means much of the pre-report positioning will occur inside this historically weak stretch.[5] Traders will be watching whether the stock can hold above its 50-day moving average around 109.66 or whether any break below that level accelerates toward the low-100s support zone that has mattered in prior pullbacks. A firm tape into earnings, especially if it carries KMB closer to the 52-week high, would mark a clear departure from the usual early-fall pattern.
Volume and insider behavior are also worth tracking. August’s episodic volume spikes suggest that large holders are already active around these levels, and a continuation of heavier-than-normal trading as the window opens would signal that institutions are leaning into the seasonal tendency rather than fading it.[1] On the insider side, any shift from the recent three-month stretch of net selling toward fresh buying would be a notable signal that management sees value into weakness, which could blunt the impact of a historically soft calendar period.[7]
Add it up: Kimberly-Clark is heading into a 44-day window that has been reliably unfriendly to the long side for a decade, just as investors line up for another earnings report and reassess the dividend-rich staple’s role in their portfolios. Whether the stock once again leans into its early-fall seasonal trend or finally breaks the pattern will say a lot about how much conviction remains behind this year’s rebound.
Sources
- MarketBeat - Kimberly-Clark (KMB) Stock Chart and Price History 2026
- MarketBeat - Sanctuary Advisors LLC Takes $11.55 Million Position in Kimberly-Clark Corporation $KMB
- MarketBeat - Jupiter Topco LLC Makes New Investment in Kimberly-Clark Corporation $KMB
- MarketBeat - Kimberly-Clark (KMB) Stock Price, News & Analysis
- Zacks - What date does KimberlyClark's (KMB) report Earnings - Earnings Calendar & Announcement
- MarketBeat - 323,052 Shares in Kimberly-Clark Corporation $KMB Purchased by Connor, Clark & Lunn Investment Management Ltd.
- GuruFocus - Kimberly-Clark Corp (KMB) Stock Up 3.4% and Still Undervalued -- GF Score: 65/100
- GuruFocus - KMB Looks 11.1% Undervalued on GF Value™ as Dividend Sustainability Faces Scrutiny
About this seasonal analysis
Seasonal pattern data is sourced from TradeWave.ai, which analyzes historical price behavior across annual calendar windows going back up to 30 years. Read the full data methodology or the book The 100-Year Pattern by Afshin Moshrefi (2026 edition). Past performance of seasonal patterns does not guarantee future results. This article is for informational purposes only and does not constitute investment advice.