Oracle Corporation (ORCL) Has Risen 9 Straight Midterm Sep-Apr Windows, Averaging 22.54% Gains
Oracle Corporation is approaching a 213-day midterm election year trading window that has never produced a losing season in the past nine cycles, even as higher bond yields pressure its debt-funded AI expansion.
Price as of Sep 1, 2026: $141.32 (last close).
What is the seasonal pattern for Oracle Corporation (ORCL)?
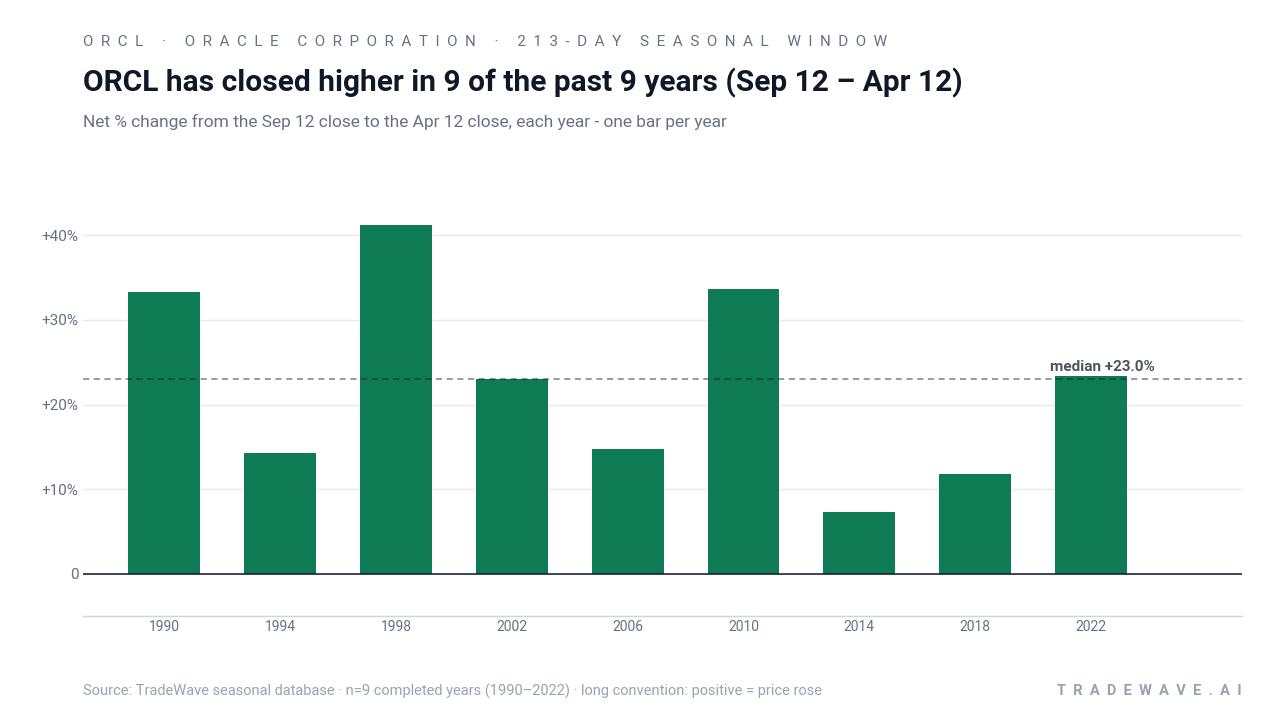
Oracle Corporation has risen in 9 of 9 midterm election year windows from Sep 12 to Apr 12, with an average gain of 22.54% in winning years.
- 9 for 9 in this window, with Oracle Corporation averaging 22.54% gains in winning years across the last nine midterm election cycles.
- The upcoming seasonal window begins Sep 12 and runs 213 days into the heart of the midterm-to-pre-election transition.
- Percent Profitable is 100%, with 9 winners and 0 losers across the historical sample.
- Median profit over the window is 23.0%, pointing to a consistently strong ORCL seasonal trend rather than one or two outlier years.
- The TradeWave Ratio of 0.99 suggests price typically travels almost a full window’s worth in the trade direction, while the Sharpe ratio of 1.75 reflects strong risk-adjusted returns.
- Intraperiod swings have been meaningful, with some years showing deep drawdowns before finishing higher, so the Oracle Corporation trading window has combined upside with volatility.
According to historical data from TradeWave.ai, this specific midterm election year stretch has behaved very differently from an average calendar period for Oracle Corporation. The next section walks through how that election-cycle pattern has played out in prior years and what it means for the upcoming Sep 12 start date.
How strong is the upcoming midterm-year seasonal window for Oracle Corporation (ORCL)?
Oracle Corporation has risen in 9 of 9 midterm election year windows running from Sep 12 to Apr 12, averaging 22.54% gains with no losing seasons across the sample. Shares finished the latest session at 141.32, down 5.2% on the day and sitting well below a 52-week high near 337.97, after a sharp pullback from last week’s close of 149.12. That combination of a strong historical seasonality profile and a stock that has just been hit hard gives this upcoming window unusual weight for traders watching the ORCL seasonal trend.
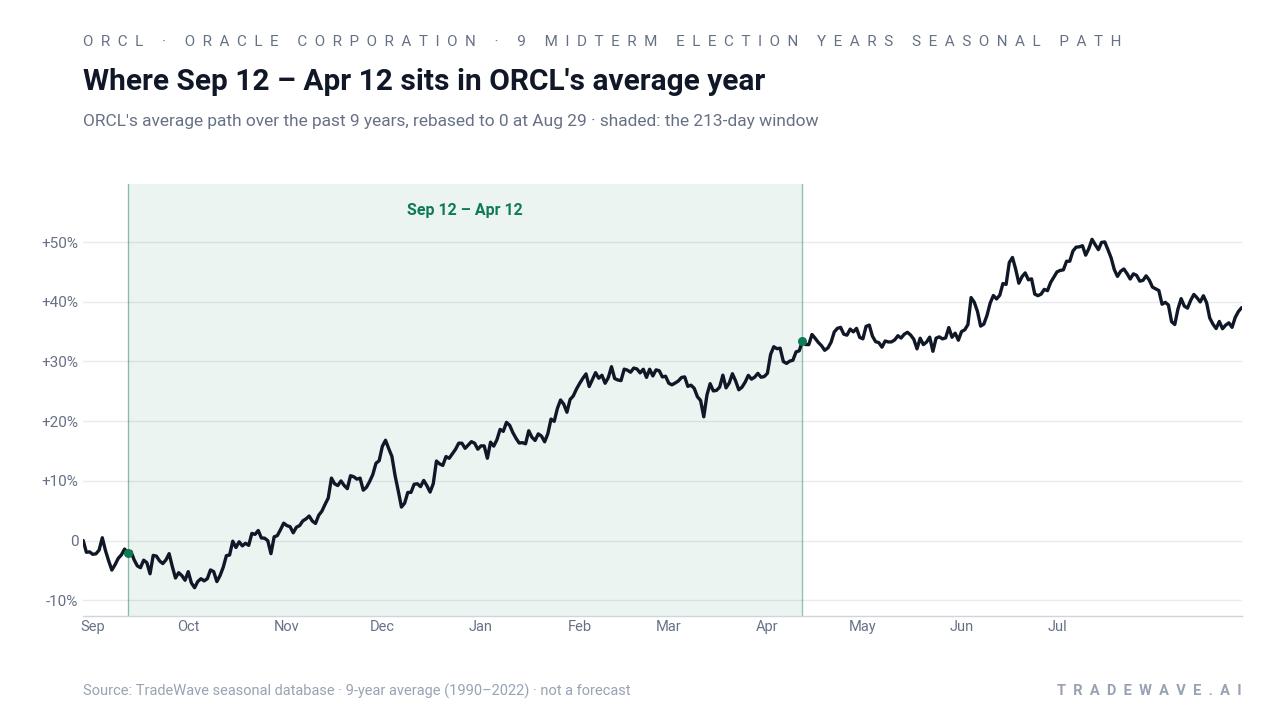
Grouping the data by the presidential election cycle matters here because this 213-day stretch sits in the concluding midterm election year and runs into the early part of the year before the presidential election, a phase that has often coincided with shifting policy expectations and risk appetite. For a large-cap tech and cloud infrastructure name like Oracle, that backdrop can influence how investors treat long-duration AI and cloud cash flows, which in turn shapes how the stock behaves inside this Oracle Corporation trading window.
Historically, the trade direction for this pattern is long, and the record is clean: 9 winners, 0 losers, and 100% of midterm-year windows finishing positive. Average profit across those years is 22.54%, with a median outcome of 23.0%, so the typical result has been a double-digit gain rather than a marginal drift higher. The strongest year in the sample was 1998, when Oracle rallied 41.18% between the Sep 12 entry and the Apr 12 exit, while the softest was 2014, which still delivered a 7.36% gain over the same calendar slice.
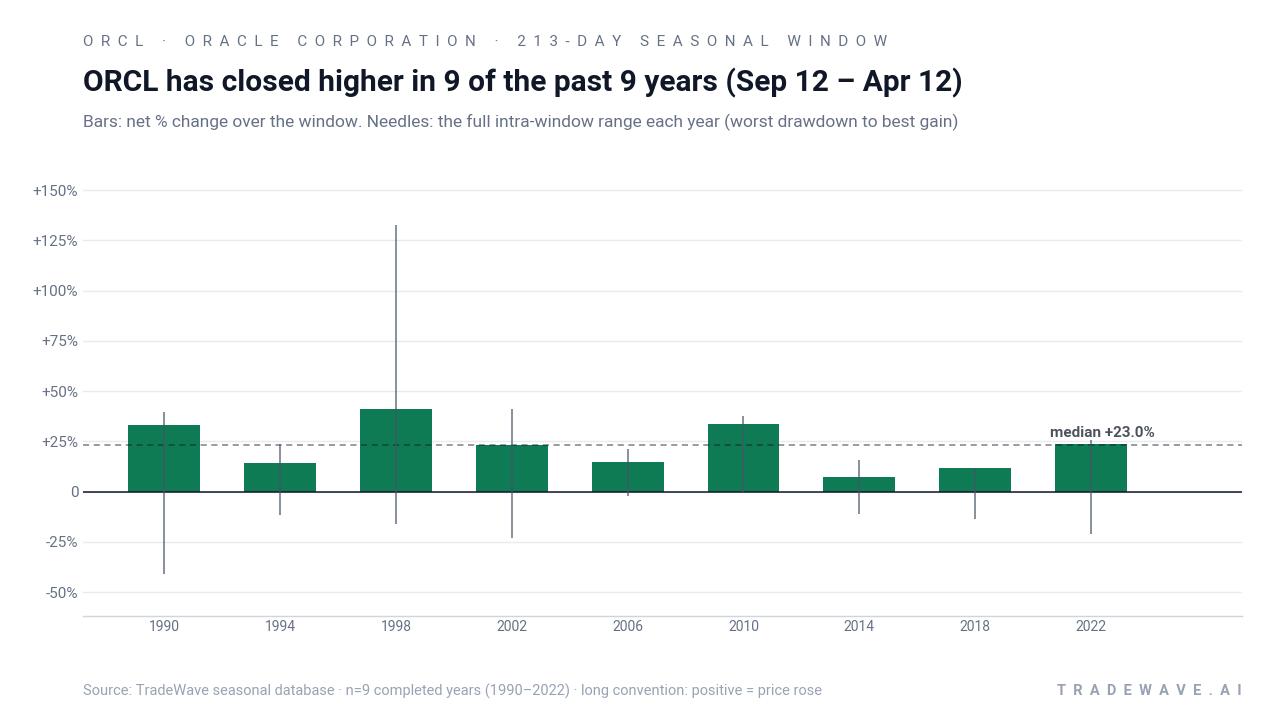
The intraperiod path has not been a straight line. Maximum favorable moves inside the window have ranged from 11.84% in 2018 to a striking 132.47% in 1998, capturing the best point-to-peak rallies before any giveback. On the downside, maximum adverse moves have at times been deep: in 1990, Oracle saw a worst drawdown of -40.92% within the window before finishing the period higher, and several other years, including 2002 and 2022, experienced drawdowns of more than -20% at some point. That mix of large MFE and sizable MAE shows a high-variance window where both sharp rallies and sharp pullbacks have been part of the historical playbook.
A second view stacks net returns with both best rallies and worst drawdowns to show the full intraperiod range each year.
Across the nine midterm election years in this sample, stacking the Sep 12 – Apr 12 window compounds to a cumulative return of 501%, which is unusually strong for a single recurring slice of the calendar. The pattern is clear: this has been a long-biased regime for Oracle Corporation, with consistent positive finishes and enough volatility inside the window to matter for risk management.
History does not guarantee future results; adverse excursions (MAE) can be large even in winning windows.
Why does Oracle Corporation (ORCL) follow this seasonal pattern?
One likely driver is the way Oracle’s fiscal calendar and enterprise spending cycles line up with the midterm-to-pre-election phase, when CIO budgets and cloud commitments often get finalized for the coming year. Analysts have also pointed to institutional portfolio repositioning around policy expectations in the year before the presidential election, which can favor large-cap software and cloud infrastructure names. This pattern may also reflect how multi-quarter AI and cloud infrastructure narratives tend to build through winter and early spring, especially when management has highlighted large contracted but unrecognized revenue that investors gradually price in over time.[1]
What is driving Oracle Corporation (ORCL) today?
Oracle Corporation closed at 141.32 in the latest session, down 5.2% after trading between 139.95 and 146.79, with volume of about 25 million shares against a 20-day average near 21.8 million. The stock has pulled back sharply from a prior close of 149.12 and sits well below a 52-week high around 337.97, even as it remains comfortably above a 52-week low of 114.50. The move comes as a bond selloff pushes the 10-year Treasury yield toward a one-year high near 4.8%, pressuring debt-funded AI infrastructure plays like Oracle that are investing heavily in new capacity.[1]
In fiscal 2026, Oracle posted 17% revenue growth, with its cloud infrastructure segment expanding 77%, and management pointed to roughly $553 billion in contracted but unrecognized revenue on the earnings call, underscoring the long-duration nature of its backlog.[1] That backlog is tied directly to the company’s AI and cloud infrastructure buildout, including a partnership with AMD to deploy an AI supercluster using 50,000 Instinct MI450 GPUs starting in calendar Q3 2026, which positions Oracle as a major AI infrastructure provider but also increases its sensitivity to funding costs and execution risk.[2] Against that backdrop, the upcoming ORCL seasonal trend window from Sep 12 to Apr 12 will unfold as investors weigh higher rates against a large, contracted revenue base and a capital-intensive AI expansion.
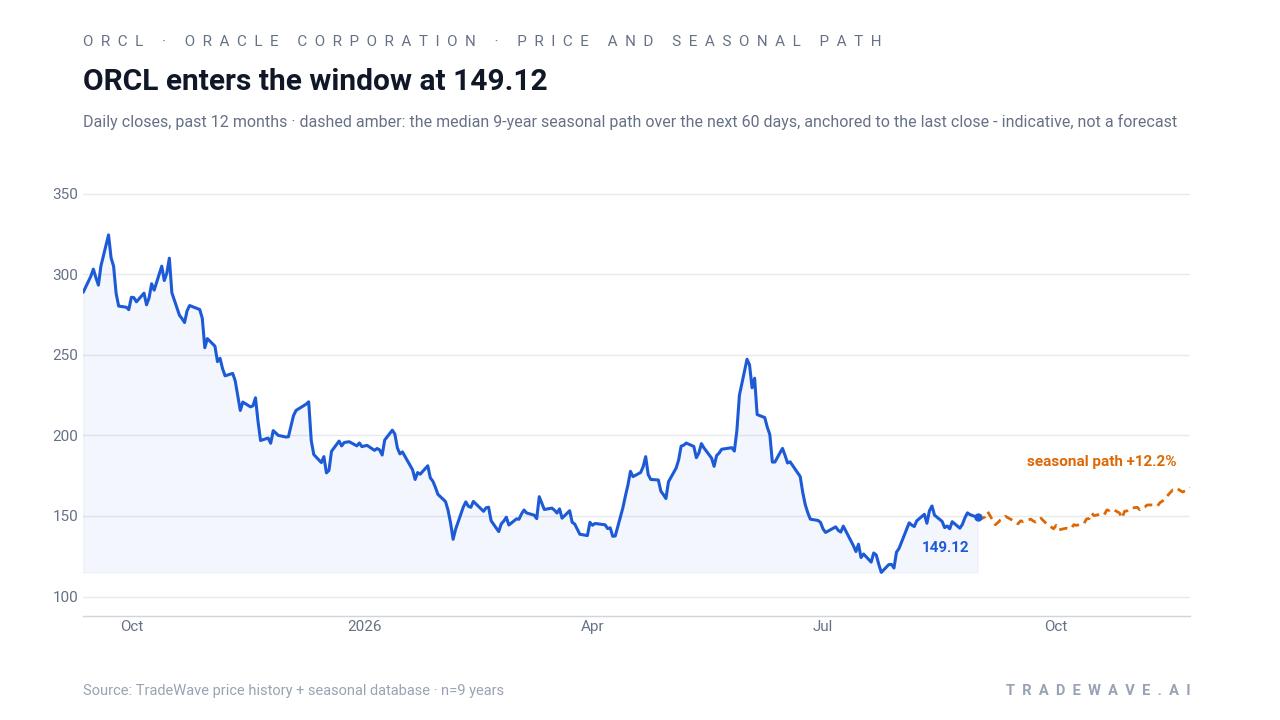
The chart below shows Oracle’s recent price path alongside a historical seasonal projection for the next two months.
What should traders watch as this Oracle Corporation seasonal window approaches?
First, the calendar: the 213-day window opens on Sep 12, so price action in the days leading up to that date will set the entry level that anchors this cycle’s comparison to prior midterm years. Second, the policy backdrop: if 10-year Treasury yields stay near recent highs or push higher, any renewed pressure on debt-funded AI infrastructure spending could test how resilient this historical seasonality has been when rates are rising.[1] Third, execution on Oracle’s AI and cloud roadmap, including progress on the AMD-powered supercluster deployment and any updates on contracted revenue, will shape whether investors continue to treat the stock as a long-duration AI infrastructure play or rotate toward shorter-duration software and services.[2] Finally, behavior inside the window will matter: a pattern of buying dips after sharp drawdowns, similar to prior years with large MAE but positive finishes, would align with the historical ORCL seasonal trend, while a failure to recover from early weakness would mark a clear break from the 9-for-9 record.
Sources
About this seasonal analysis
Seasonal pattern data is sourced from TradeWave.ai, which analyzes historical price behavior across annual calendar windows going back up to 30 years. Read the full data methodology or the book The 100-Year Pattern by Afshin Moshrefi (2026 edition). Past performance of seasonal patterns does not guarantee future results. This article is for informational purposes only and does not constitute investment advice.