Synopsys (SNPS) Has Closed Higher in Every Sep-May Midterm Window for 8 Straight Cycles
Synopsys is heading into a historically powerful 236-day trading window even as the stock trades well below its 52-week high after a strong earnings beat and raised guidance.
Price as of Aug 31, 2026: $439.59 (last close).

What is the seasonal pattern for Synopsys (SNPS)?
Synopsys has risen in 8 of 8 midterm-election-year windows starting around Sep 23, with an average gain of 25.0% in winning years.
- 8 for 8 in this window, averaging 25.0% gains in winning years across the last 8 midterm election years.
- Seasonal window runs from Sep 23 through roughly May 16, spanning 236 calendar days with a long trade direction.
- Percent Profitable is 100%, with 8 winners and 0 losers in the historical sample.
- Average profit of 25.0% comes with an annualized return of 24.76% and a Sharpe ratio of 2.72.
- TradeWave Ratio of 1.7 indicates price has typically traveled meaningfully in the long direction within the window.
- Individual years have seen sizable intraperiod swings, with some windows experiencing drawdowns of more than 20% before finishing higher.
According to historical data from TradeWave.ai, this upcoming stretch for Synopsys behaves very differently from an average year. The next section looks at how that election-cycle pattern has played out in prior midterm years.
How strong is the upcoming seasonal window for Synopsys (SNPS)?
Synopsys has closed higher in every single Sep 23 to mid-May window across the last 8 midterm election years, averaging 25.0% gains with a long bias. Shares finished the prior session at 439.59, down 0.7% on the day and about 28.6% below the 52-week high of 615.79, even after a solid year-to-date gain of 6.41% so far.[2]
Grouping by the presidential election cycle matters here because this pattern only looks at midterm election years, which often feature policy uncertainty early in the year followed by a more supportive backdrop as markets pivot toward the pre-election year. In this case, the window that begins on Sep 23 sits in the late part of the midterm election year and runs deep into the year before the presidential election, a phase that has historically been one of the strongest stretches for risk assets.
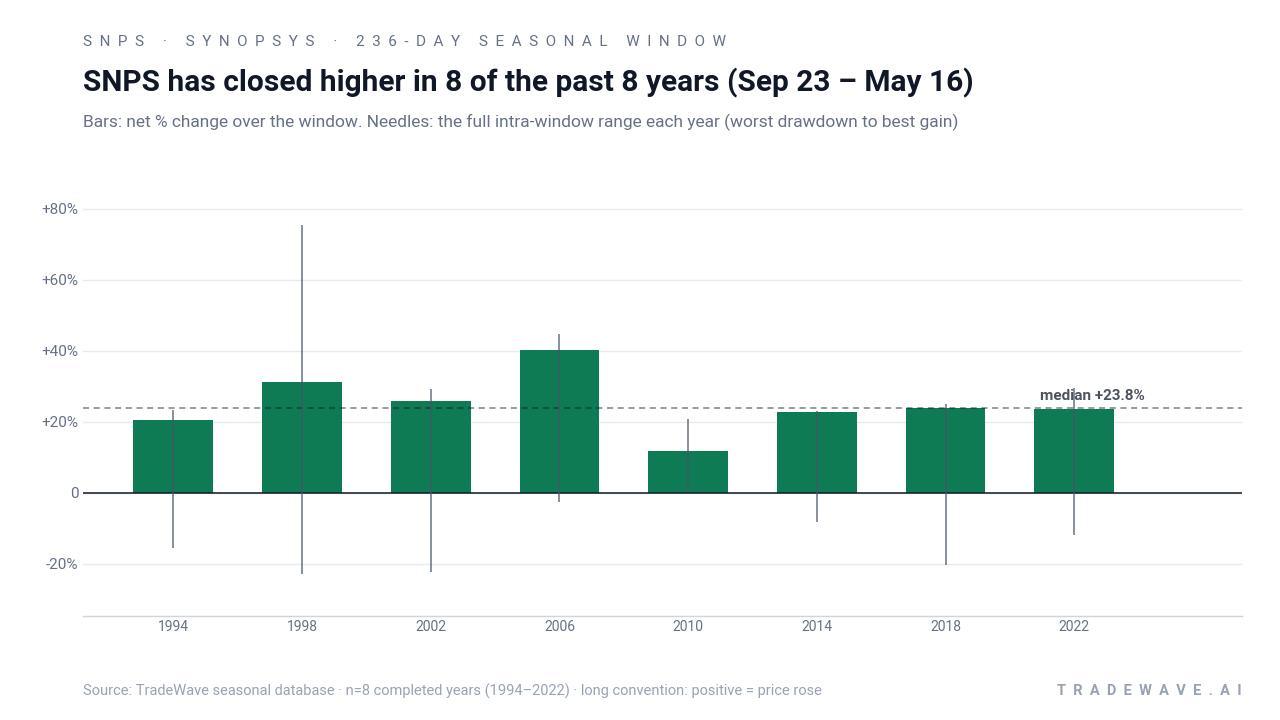
This seasonal window begins on Sep 23, 2026 and spans 236 days, covering the last week of the midterm election year through roughly mid-May of the year before the presidential election. Historically, during this period, Synopsys has shown a strong upside tendency with a long trade direction and no losing years in the sample. Percent Profitable is 100%, with 8 winners and 0 losers, and the average profit across those winners is 25.0%, compared with a median gain of 23.79%.
The per-year breakdown shows how consistent that SNPS seasonal trend has been. The weakest outcome in the sample was a still-solid 11.8% gain in 2010, while the strongest was a 40.3% rally in 2006. In 1998, the stock’s best intraperiod move reached 75.31% above the entry level before settling back to a 31.13% net gain by the end of the window, underscoring how powerful some of these midterm-to-pre-election runs have been.
Volatility inside the window has been real. Maximum adverse excursions, or the worst drawdowns from entry during the window, have ranged from a mild 0.27% dip in 2010 to drawdowns of roughly 20% to 23% in 1998, 2002 and 2018. On the upside, maximum favorable excursions have often pushed well beyond the final net result, with several years seeing peak gains in the high 20% to mid-40% range before any giveback.
The Sharpe ratio of 2.72 for this pattern points to strong risk-adjusted returns based on end-of-window outcomes, while the TradeWave Ratio of 1.7 signals that price has typically traveled meaningfully in the long direction within the window, not just drifted higher. Add it up: compounding this 236-day window across the 8 historical midterm-election-year samples would have produced a cumulative return of roughly 486%.
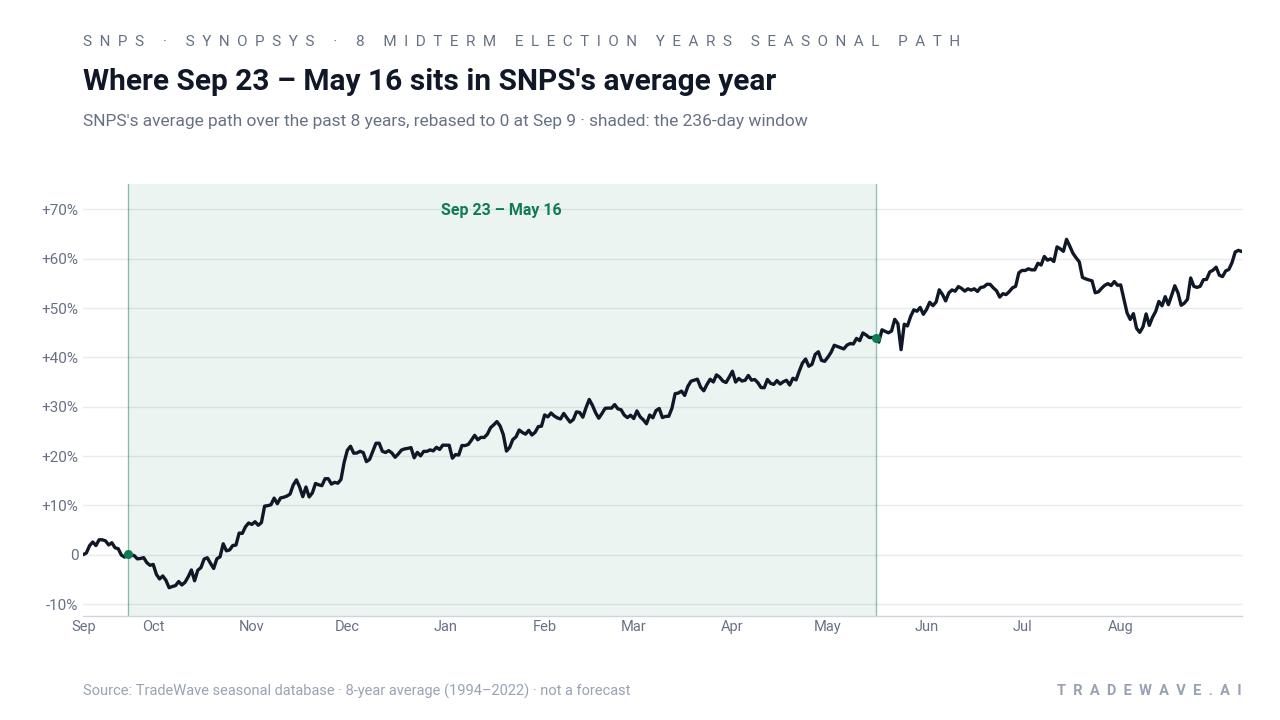
Year-by-year ranges show how those average gains have come with sizable swings both up and down inside the window.
History does not guarantee future results; even in a perfect 8-for-8 window, adverse excursions have topped 20% in some years before the stock finished higher.
The pattern is clear: this midterm-to-pre-election window has favored longs in all 8 historical samples, with double-digit gains every time.
Why does Synopsys (SNPS) follow this seasonal pattern?
One likely driver is the clustering of Synopsys earnings and guidance updates across the fall, winter and early spring, which can concentrate positive surprises into this part of the calendar.[1] Analysts have also pointed to institutional portfolio repositioning around the midterm-to-pre-election transition, when investors often lean back into growth and AI-linked software names like Synopsys after earlier-year volatility.[6] The pattern may also reflect broader semiconductor and EDA sector rotation, as design budgets and next-year chip roadmaps tend to firm up heading into the new fiscal year.
What is driving Synopsys (SNPS) today?
Synopsys closed Monday at 439.59, down 0.7% on the day, leaving the stock about 28.6% below its 52-week high of 615.79 and up 6.41% year to date.[2] The pullback comes just days after the company delivered a strong Q3 FY26 earnings beat, with revenue up 42.4% year over year and adjusted EPS of $3.91 topping consensus by $0.24, while management raised full-year guidance on the back of robust EDA demand and early Ansys integration benefits.[1][3]
Brokerage coverage remains constructive. MarketBeat data show Synopsys carries a “Moderate Buy” consensus rating, with a blended price target around $544.97 from Yahoo Finance’s aggregated estimates, and Benchmark recently reiterated a Buy rating with a $570 target.[1][2][7] Some valuation frameworks still flag the stock as undervalued relative to long-term growth assumptions, even after a multi-year run, which has helped keep institutional interest high.[9]
On the technical side, SNPS is trading above its 50-day moving average of roughly 416.69 and has gained about 12.12% over the past month, suggesting momentum has turned higher again after a deeper correction earlier in the year.[2][8] Average 20-day volume sits near 1.64 million shares, close to current trading activity, which points to steady participation rather than a speculative blow-off.[2] That backdrop matters heading into late September, because the historical seasonality window has often started from similar “reset” levels rather than from fresh highs.
Fundamentally, Synopsys remains tied to two powerful themes: the rising complexity of semiconductor design and the push to embed AI into every layer of the compute stack.[1][6] Management has highlighted accelerating demand for its EDA tools and IP as chipmakers race to build AI-optimized architectures, and the pending Ansys integration is seen as a way to deepen its position in system-level design and simulation.[1][3] That combination has made SNPS a core holding in many technology and AI-focused portfolios, which can amplify flows when seasonal tailwinds line up with strong fundamentals.
One counterpoint is insider activity. MarketBeat data show insiders have been net sellers over the past year, with roughly $20.2 million sold versus about $0.1 million bought, including about $8.2 million in sales over the last three months and a headline-grabbing tally of $1,113,875,000 in cumulative insider selling referenced in a recent alert.[5][9] Those sales have not derailed the long-term uptrend, but they add a note of caution for traders leaning heavily on the historical SNPS seasonal trend.
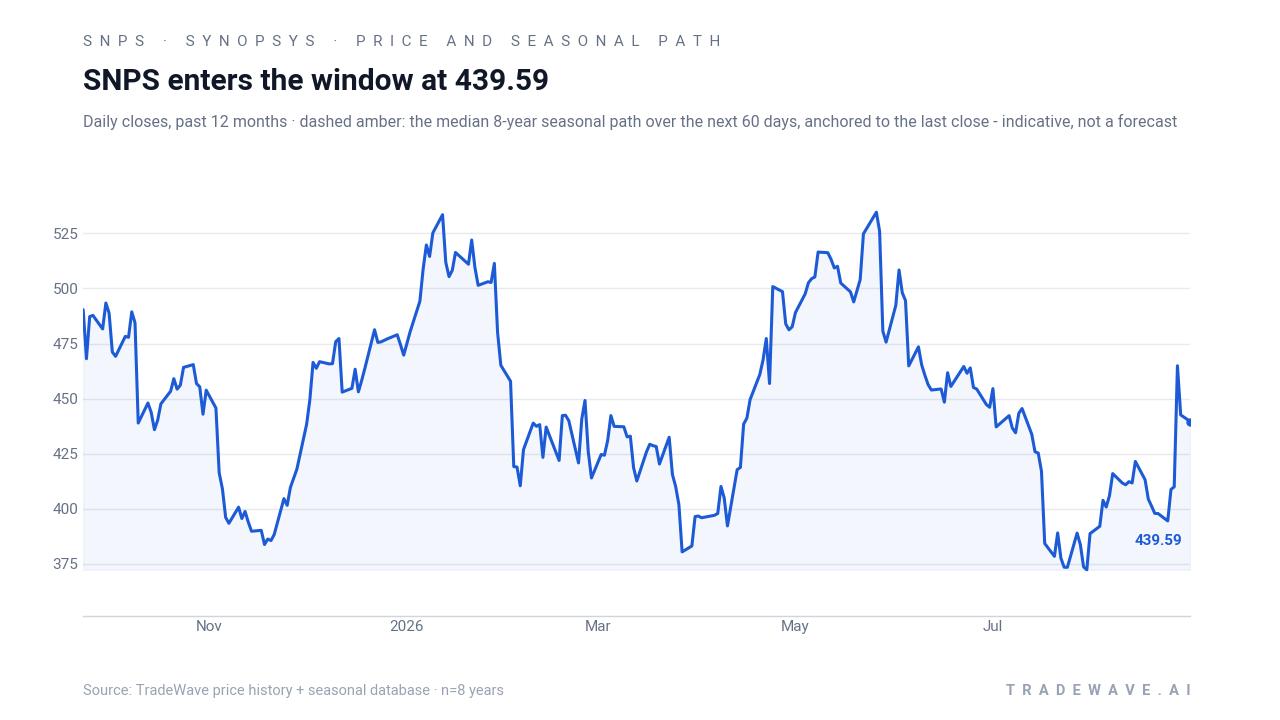
The chart below shows how the latest pullback and rebound fit into the past year’s trading range, alongside the median 60-day seasonal path.
What should traders watch as this Synopsys (SNPS) window approaches?
First, the calendar: the 236-day window kicks off on Sep 23, so price behavior in the next three weeks will set the entry level for this historically strong stretch. Traders will be watching whether SNPS holds above its 50-day moving average and whether the recent 12.12% one-month rebound can extend without retesting the summer lows.[2][8]
Second, earnings and guidance follow-through. The company just raised its FY26 outlook, and any incremental commentary from conferences or investor days on EDA demand, AI workloads or the Ansys integration will help confirm whether the fundamental story still lines up with the bullish historical seasonality.[1][3][6] Strong order trends into year-end would rhyme with prior midterm-year windows that delivered the biggest gains.
Third, insider and institutional flows. With insiders having sold heavily over the past year, traders will be alert to any shift in that pattern, such as a slowdown in selling or fresh insider buys, which could signal renewed confidence at current levels.[5][9] On the institutional side, filings that show large funds adding or trimming SNPS into the midterm-to-pre-election transition will offer clues about how much of the seasonal edge is already priced in.[3]
Finally, watch how SNPS trades relative to the broader software and semiconductor complex. If the stock starts to outperform its peers as the Sep 23 window opens, with rallies that mirror the historical maximum favorable excursions while keeping drawdowns contained, that would be a strong sign the long-standing seasonal pattern is still in play. If instead the stock lags despite a supportive macro and sector backdrop, it would be an early signal that this cycle may diverge from the 8-for-8 record.
Sources
- MarketBeat - Synopsys, Inc. (NASDAQ:SNPS) Given Consensus Rating of "Moderate Buy" by Brokerages
- Yahoo Finance - Synopsys, Inc. (SNPS) Stock Price, News, Quote & History - Yahoo Finance
- MarketBeat - Wellington Management Group LLP Lowers Stake in Synopsys, Inc. $SNPS
- Barchart - SNPS - Synopsys Stock Price - Barchart.com
- MarketBeat - Insider Selling: Synopsys (NASDAQ:SNPS)
- Yahoo Finance (article) - Synopsys Stock: Analyst Estimates & Ratings
- GuruFocus - SNPS Reiterated by Benchmark -- Price Target Maintained at 570
- ChartMill - SNPS Technical Analysis | Trend, Signals & Chart Patterns | ChartMill.com
- GuruFocus - SNPS Looks 38.8% Undervalued on GF Value™
About this seasonal analysis
Seasonal pattern data is sourced from TradeWave.ai, which analyzes historical price behavior across annual calendar windows going back up to 30 years. Read the full data methodology or the book The 100-Year Pattern by Afshin Moshrefi (2026 edition). Past performance of seasonal patterns does not guarantee future results. This article is for informational purposes only and does not constitute investment advice.