Walmart (WMT) Earnings on Aug. 20 Meet a 10-for-10 Sep-Apr Rally Streak
Walmart shares are hovering near $103 with modest YTD gains as the stock approaches a late-September window that has delivered double-digit average returns over the past decade, putting extra focus on earnings and consumer demand.
Price as of Aug 28, 2026: $103.09 (last close).

What is the seasonal pattern for Walmart (WMT)?
Walmart has risen in 10 of 10 years during the Sep 29 to Apr 15 window, with an average gain of 11.75% in winning years.
- 10 for 10 in this window, with Walmart averaging 11.75% gains across all winning years from 2016 to 2025.
- The upcoming seasonal stretch runs roughly 199 days from Sep 29 through mid-April and has historically favored long positions in WMT.
- Percent Profitable is 100%, with 10 winners and 0 losers across the past decade in this specific Walmart trading window.
- Individual winning years have ranged from about 3.0% to 21.53% gains, showing both steady and outsized upside in the historical WMT seasonal trend.
- Intraperiod swings have been meaningful, with some years seeing double-digit drawdowns before finishing higher, underscoring the volatility inside an otherwise strong pattern.
- Stacked over 10 years, this Sep–Apr window compounds to roughly 200% cumulative gains, making it one of Walmart’s most powerful historical seasonality regimes.
According to historical data from TradeWave.ai, this late-September window has behaved very differently from an average month on the calendar for Walmart. The next section walks through how that pattern has played out over the past decade and what it means as the 2026 iteration approaches.
How has Walmart (WMT) traded in the Sep 29 to Apr 15 seasonal window?
Walmart has closed higher in every single Sep 29 to Apr 15 window for the past 10 years, averaging 11.75% gains with a long bias. The next 199-day stretch in this pattern begins on Sep 29, 2026, with the stock currently around $103 and up about 1.5% year to date.
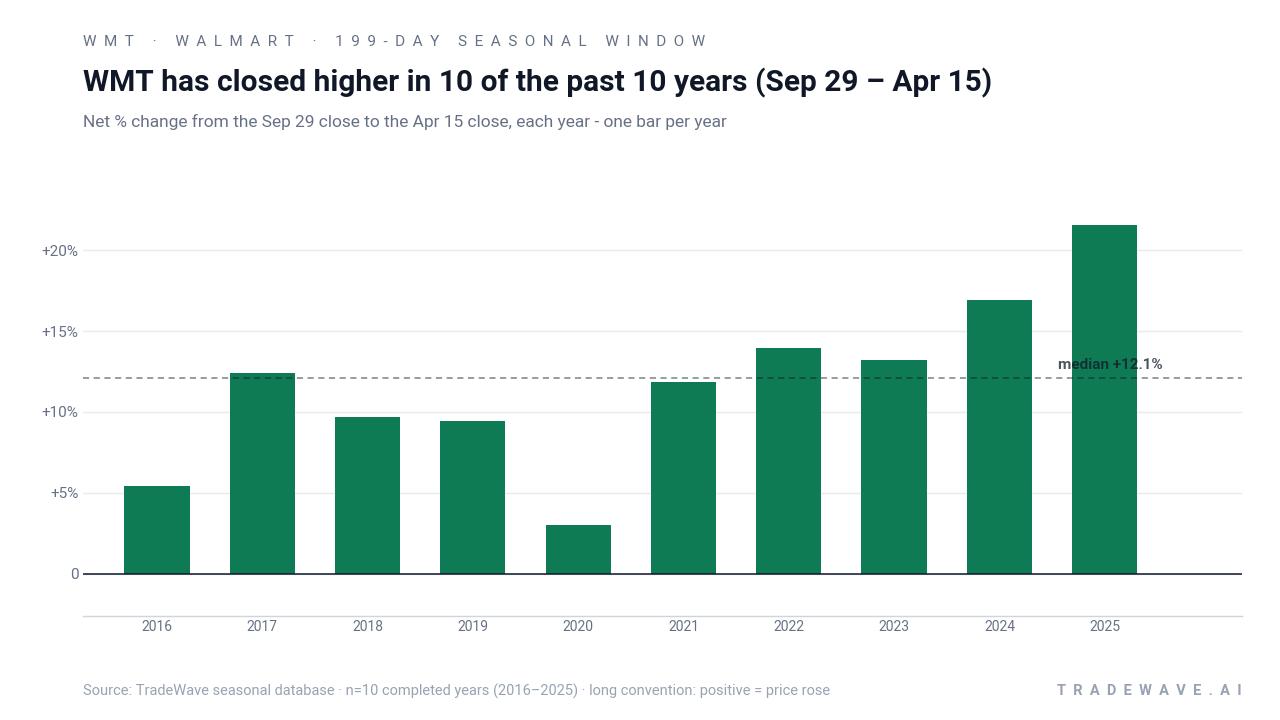
Across the 2016–2025 sample, the strongest year in this Walmart trading window was 2025, when the stock gained 21.53% between late September and mid-April, while the softest outcome was 3.0% in 2020. Even that weakest year still finished positive, which is unusual for a single stock over a 199-day span. The annualized return for the pattern clocks in at 11.63%, and stacking the window year after year compounds to roughly 200% cumulative gains over the decade.
Intraperiod swings have been real. In 2019, for example, Walmart finished the window up 9.46% but at one point was down 13.67% from the entry before recovering. In 2017, the stock’s best run-up inside the window reached 41.49% from the starting level, with only a shallow 0.82% drawdown along the way. That mix of deep pullbacks in some years and smooth climbs in others is exactly what the TradeWave Ratio of 1.49 is flagging: the stock has typically traveled meaningfully in the trade direction during this stretch.
The historical path also shows a tendency for gains to build as the window progresses rather than spiking only at the end. Several years, including 2022, 2023 and 2024, saw Walmart log double-digit maximum favorable moves of 16.93%, 16.49% and 30.69% respectively before settling into final returns of 13.95%, 13.22% and 16.95%. That suggests the typical WMT seasonal trend in this period has been a grind higher with intermittent shakeouts, not a single news-driven pop.
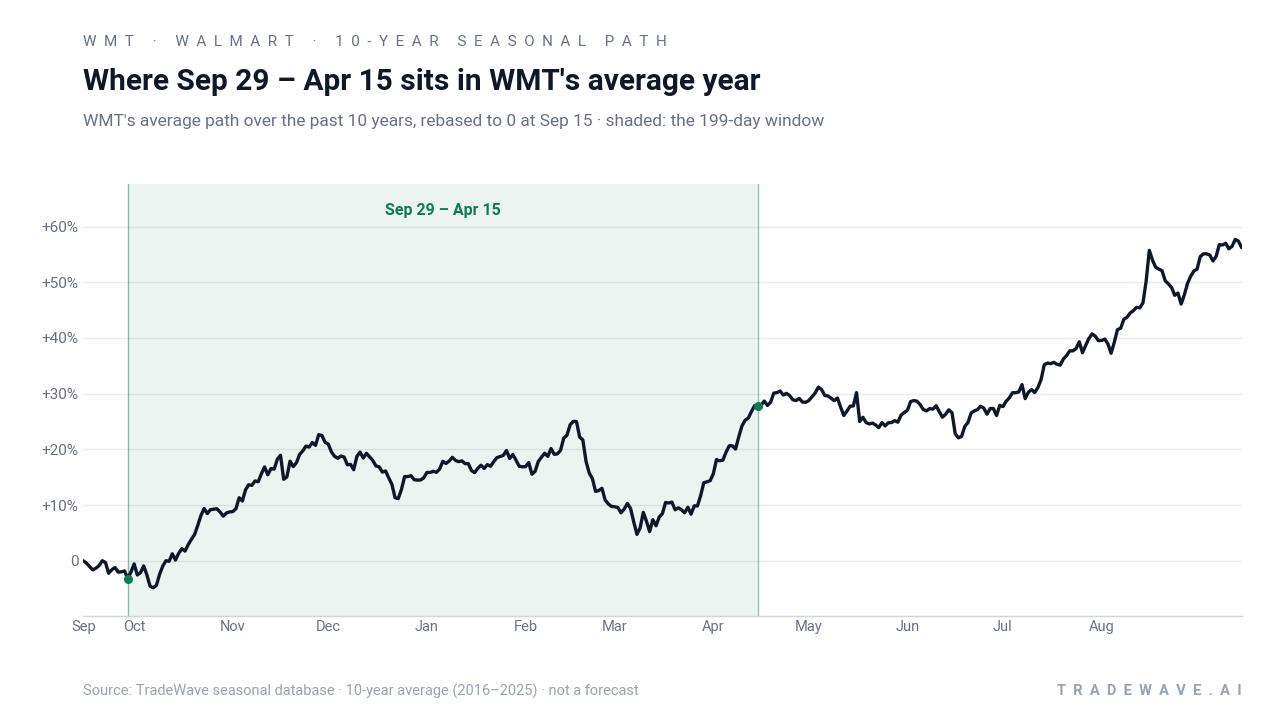
Year-by-year ranges show how far Walmart has tended to swing inside this window before settling at its final result.
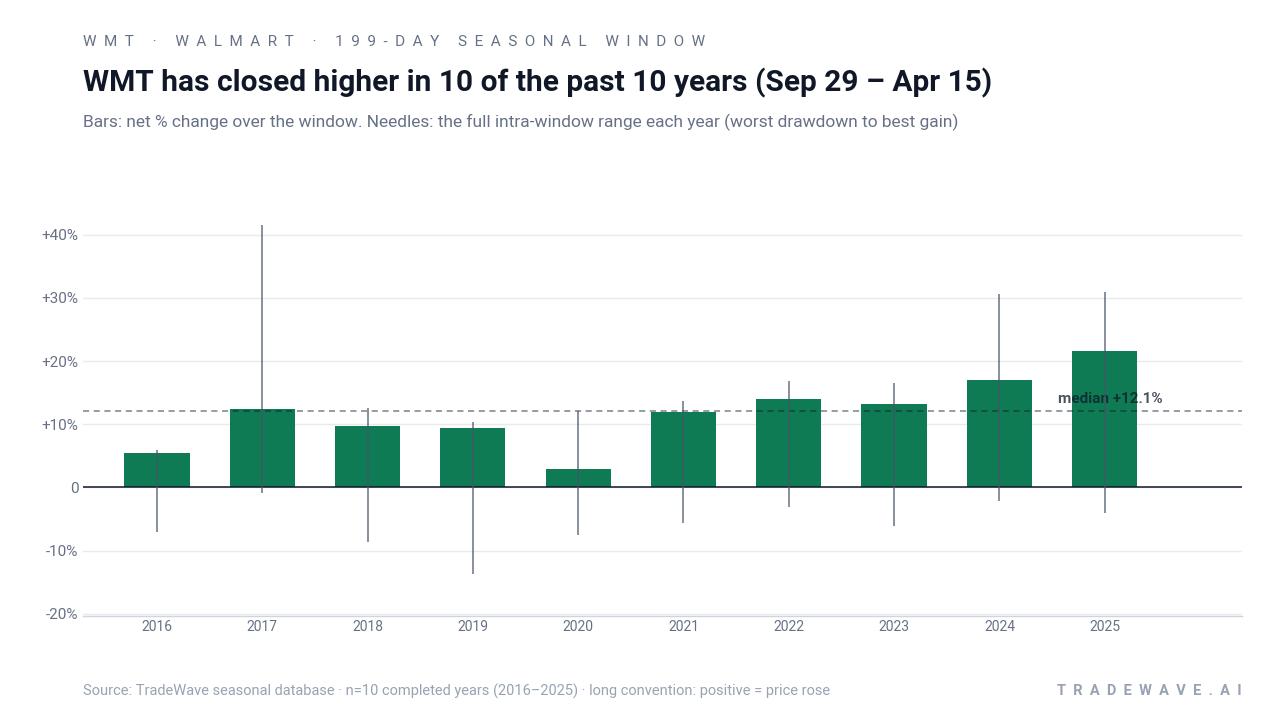
Those ranges underline the risk side of the story. Maximum adverse moves have reached between roughly 3% and 14% in different years, even though every window finished in the green. Maximum favorable moves have often stretched into the low to mid-teens, and in a couple of years into the 30% zone, which is consistent with a long pattern that has historically rewarded patience but not without turbulence.
History does not guarantee future results; adverse excursions can be large even in winning windows, and past seasonality does not ensure similar outcomes in 2026–2027.
Why does Walmart (WMT) follow this seasonal pattern?
One likely driver is the clustering of Walmart’s key retail periods inside this window, from back-to-school and holiday shopping through early-year clearance and tax-refund spending. Analysts have also pointed to institutional portfolio rebalancing around year-end and the company’s earnings cadence as reasons large investors tend to adjust Walmart exposure in this stretch.[1][2] The result is a calendar zone where consumer spending cycles, earnings updates and fund flows often line up in the same direction for the stock.
What is driving Walmart (WMT) today?
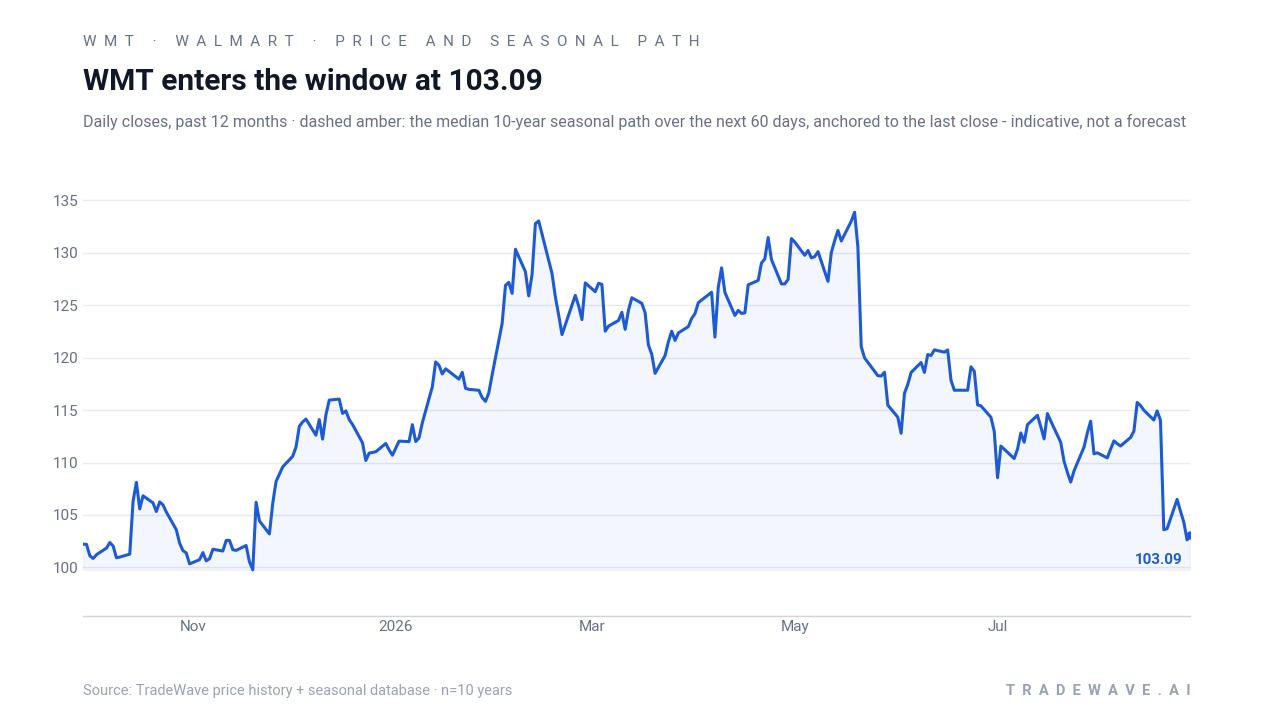
Walmart closed the latest session at $103.09, up 0.45% on the day, leaving the stock roughly 1.5% higher for 2026 and well below its 52-week high near $134.52. The shares have slipped about 6.85% over the past month and now sit under their 50-day moving average around $111.53, a sign that the near-term trend has cooled after a strong run earlier in the year.
On the fundamental side, investors are focused on the company’s upcoming earnings release scheduled for Aug 20, 2026, where Wall Street is looking for quarterly EPS of about $0.73–$0.74 on revenue of roughly $186–189 billion, implying modest year-over-year growth.[2][4] In the most recent reported quarter, Walmart delivered revenue of $177.8 billion with adjusted EPS of $0.66, matching expectations, and guided for Q3 net sales growth of 3%–3.75% with operating income up 2%–4% and adjusted EPS of $0.62–$0.64.[2] That guidance, along with reaffirmed fiscal 2027 adjusted EPS of $2.75–$2.85, has set a relatively steady fundamental backdrop even as the stock has become more expensive versus some high-profile tech names.[6]
Analyst sentiment remains constructive. MarketWatch’s compilation of Street estimates shows an “Overweight” consensus rating on Walmart, with a mean price target around $129.08, implying upside from current levels.[1][6] Some firms have recently argued that the outperformance case is less compelling after the stock’s multi-year rally, citing valuation and potential consumer strain as higher tax refunds fade, but they still see the company’s scale and defensive profile as attractive in a choppy macro environment.[5]
Under the surface, positioning has been active. MarketBeat has flagged a series of new institutional investments in late August, including Portfolio Design Labs LLC, Vise Technologies Inc., PCM Encore LLC and Corient Private Wealth LP, all adding to or initiating stakes in Walmart.[7][8][9][13] Short interest remains modest at about 63.1 million shares, or roughly 0.79% of the float as of Aug 14, 2026, suggesting limited outright bearish pressure.[11] Insider and institutional transaction logs on Yahoo Finance also show a steady drumbeat of buying activity rather than large-scale selling.[12]
The chart below situates the latest pullback against Walmart’s past year of trading and the median 60-day seasonal projection.
What should traders watch as Walmart (WMT) approaches this seasonal window?
First, the earnings print and guidance on Aug 20 will set the tone heading into the Sep 29 start of the historical window.[2] If Walmart reiterates mid-single-digit sales growth and stable margins, it would align with the kind of steady backdrop that has often accompanied prior winning years in this pattern.
Second, price levels matter. The 50-day moving average near $111.53 is the first technical hurdle after the recent slide, while the 52-week high around $134.52 marks the top of the current range. How Walmart behaves between roughly $100 and $112 in September will tell traders whether the stock is stabilizing ahead of the seasonal stretch or still digesting earlier gains.
Third, watch institutional flows and short interest. Continued filings showing new or increased positions from asset managers, along with short interest staying contained or drifting lower, would signal that large investors are leaning with the long-term WMT seasonal trend rather than against it.[7][8][9][11][13] A sharp reversal in those flows or a jump in short interest would be an early sign that this cycle could diverge from the past decade’s script.
Finally, the pattern itself offers a simple test. If Walmart enters the Sep 29 to Apr 15 window and quickly regains its 50-day average while holding pullbacks to single digits, that would be consistent with the historical profile of strong maximum favorable moves and manageable drawdowns. A failure to participate in any year-end or early-2027 strength, or a deep drawdown that does not recover by mid-April, would be a clear break from the 10-for-10 record that has defined this window so far.
Sources
- MarketWatch - WMT | Walmart Inc. Analyst Estimates | MarketWatch
- Yahoo Finance - Walmart (WMT) Stock Sinks As Market Gains: Here's Why
- Yahoo Finance (24/7 Wall St. via Yahoo) - Walmart (WMT) Stock Price Prediction: Where Our Price Target Sees the Stock Going Over the Next 12 Months
- Yahoo Finance (Zacks) - What Analyst Projections for Key Metrics Reveal About Walmart (WMT) Q4 Earnings
- Yahoo Finance / Stocktwits - Walmart Downgraded Ahead Of Earnings This Month – Oppenheimer Sees A ‘Less Compelling Outperformance Case’
- Yahoo Finance (Barchart) - Walmart Stock Is More Expensive Than Nvidia Amid Earnings Miss
- MarketBeat - Portfolio Design Labs LLC Invests $2.87 Million in Walmart Inc. $WMT
- MarketBeat - Vise Technologies Inc. Makes New Investment in Walmart Inc. $WMT
- MarketBeat - Corient Private Wealth LP Acquires Shares of 1,886,620 Walmart Inc. $WMT
- Yahoo Finance (Barchart) - How to Trade Unusual Options Activity in Walmart Stock Now Before March 20
- MarketBeat - Walmart (WMT) Short Interest & Short Float | Updated Aug 2026
- Yahoo Finance - Walmart Inc. (WMT) Recent Insider Transactions - Yahoo Finance
- MarketBeat - 26,388 Shares in Walmart Inc. $WMT Bought by PCM Encore LLC
About this seasonal analysis
Seasonal pattern data is sourced from TradeWave.ai, which analyzes historical price behavior across annual calendar windows going back up to 30 years. Read the full data methodology or the book The 100-Year Pattern by Afshin Moshrefi (2026 edition). Past performance of seasonal patterns does not guarantee future results. This article is for informational purposes only and does not constitute investment advice.