10-for-10 Midterm Run: Johnson & Johnson (JNJ) Enters a 57-Day Window Averaging 5.29% Gains
Johnson & Johnson is heading into a historically strong 57-day midterm-year trading window just as shares press near record highs and options activity picks up ahead of October earnings.
Price as of Sep 2, 2026: $275.21 (last close).

What is the seasonal pattern for Johnson & Johnson (JNJ)?
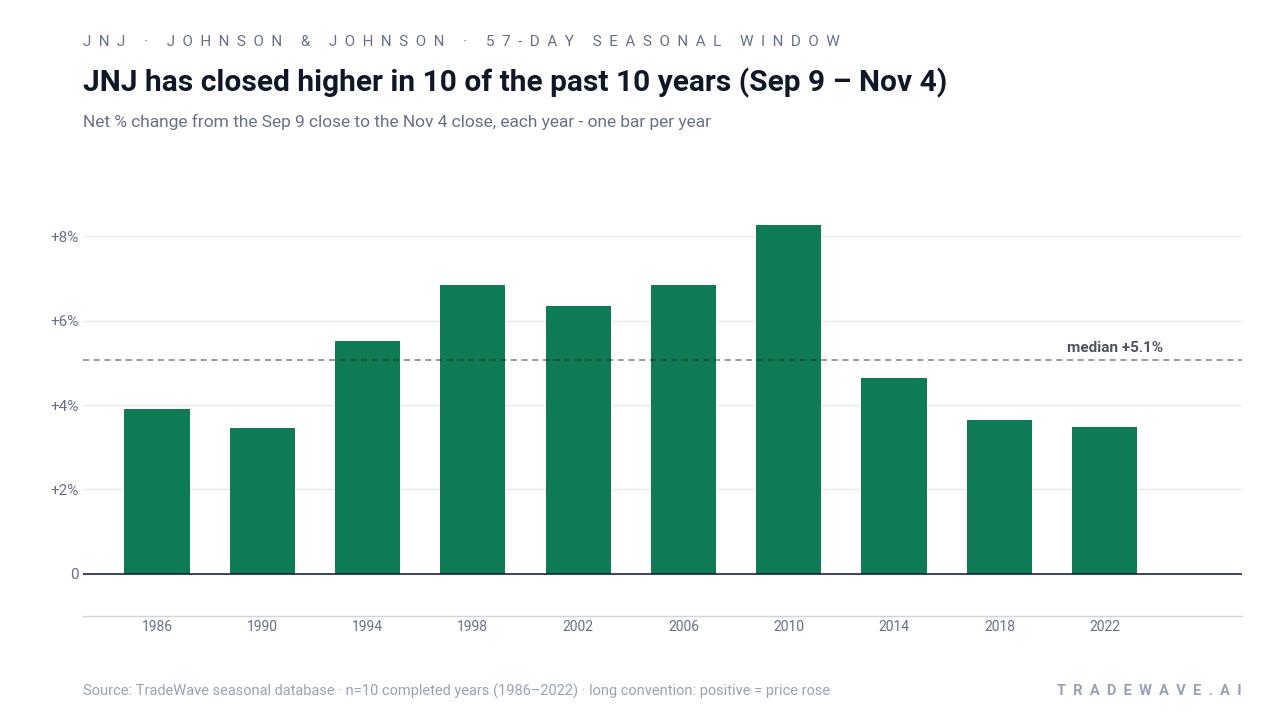
Johnson & Johnson has risen in 10 of 10 midterm-year Sep 9 to Nov 4 windows, with an average gain of 5.29% in winning years.
- 10 for 10 in this window, averaging 5.29% gains in winning years across the last 10 midterm election cycles.
- Seasonal window runs from Sep 9 through Nov 4, spanning 57 calendar days in the late part of the midterm election year.
- Percent Profitable is 100%, with 10 winners and 0 losers for long trades in this Johnson & Johnson seasonal trend.
- Annualized return of 5.28% and a Sharpe ratio of 2.72 point to a historically strong risk‑adjusted profile for this JNJ trading window.
- TradeWave Ratio of 2.28 suggests price has typically traveled meaningfully in the long direction within the window, even before final closes.
- Cumulative gains across the 10 completed windows add up to 67%, underscoring how persistent this late‑midterm seasonal pattern has been.
According to historical data from TradeWave.ai, this specific slice of the calendar has behaved very differently from an average autumn for Johnson & Johnson, and the next iteration is about to open again.
How has Johnson & Johnson (JNJ) traded in the upcoming Sep 9 to Nov 4 window?
Johnson & Johnson has closed higher in every single Sep 9 to Nov 4 window across the last 10 midterm election years, averaging 5.29% gains for long positions. Shares finished Thursday at $275.21, up 1.48% on the day and about 0.5% below their 52‑week high of $276.47, leaving the stock effectively at record territory as this pattern approaches. Recent weeks have also seen elevated options activity, including notable put buying ahead of July earnings and a spike in call volume in August, signaling that derivatives traders are leaning in as the next catalyst cluster approaches.[8][9]
Grouping the data by the presidential election cycle matters here because this 57‑day stretch sits in the late part of the midterm election year, just before markets pivot into the historically more risk‑on year before the presidential election. For a defensive healthcare bellwether like Johnson & Johnson, that transition has often coincided with investors rotating toward stable earnings compounders while policy and fiscal debates heat up in Washington.
This seasonal window begins on Sep 9 and spans 57 days, and in the last 10 midterm election years Johnson & Johnson has posted a gain every time. The trade direction is long, and the 100% Percent Profitable record means there were 10 winners and 0 losers across the sample. Average profit in those winning years was 5.29%, while the median outcome was close at 5.07%, suggesting the JNJ seasonal trend has been relatively consistent rather than driven by a single outlier year.
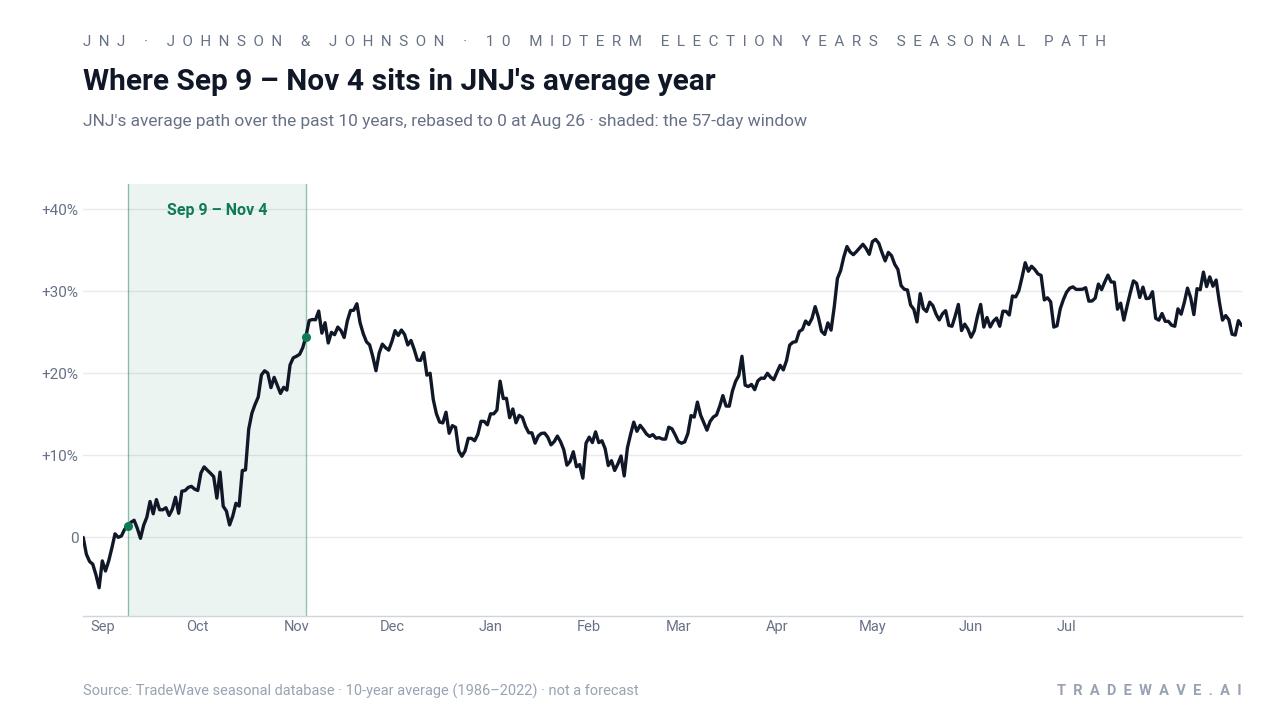
The historical average path shows JNJ typically grinding higher into this late‑midterm window, then adding another leg of gains through early November. The trend profile is skewed to the upside, with “Trend Long” readings of 69 and 57 on the longer and shorter horizons, and no corresponding short bias, which lines up with the clean 10‑for‑10 record.
The next chart shows how much JNJ has tended to swing inside the window, not just where it finished.
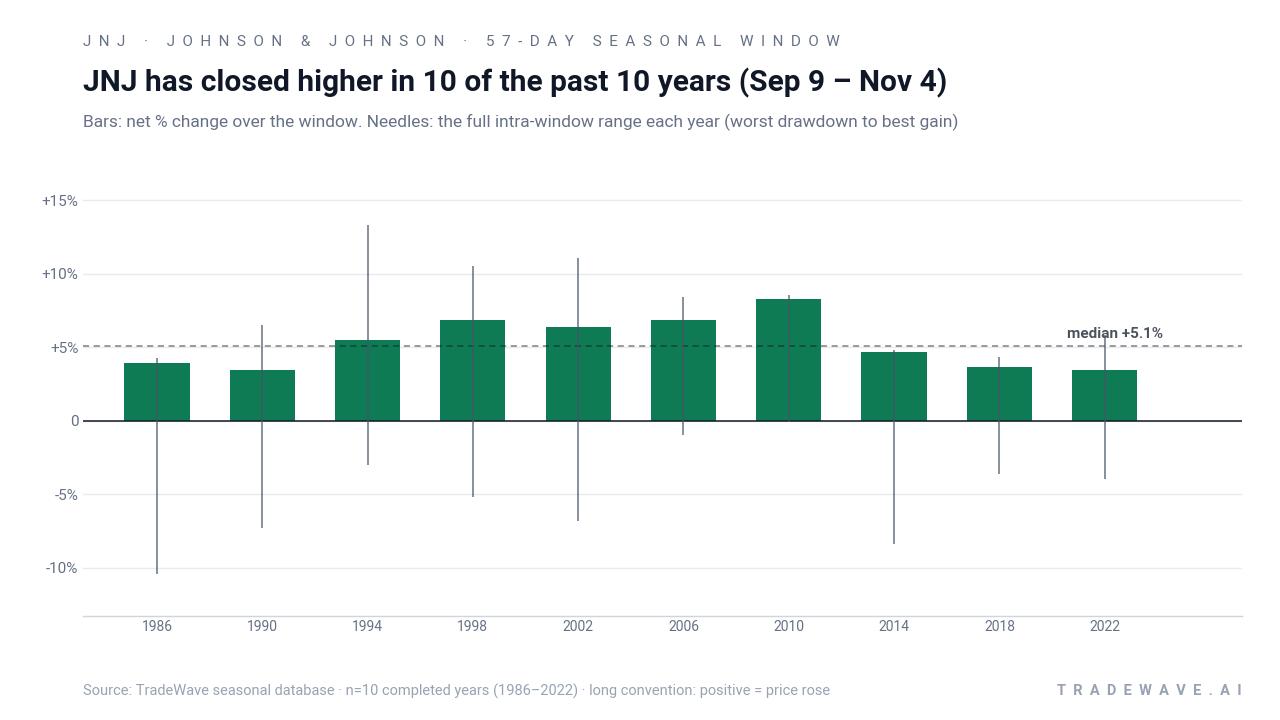
The per‑year bars with full intraperiod ranges show that even in winning years, Johnson & Johnson has often seen meaningful swings inside the window. Maximum favorable moves have reached into double‑digit territory in several cycles, while maximum adverse moves have at times pushed into mid‑single‑digit drawdowns before the stock recovered. Add it up: 67% cumulative gains across the 10 completed windows, but with enough volatility inside each one that position sizing and risk controls still mattered.
History does not guarantee future results; adverse excursions can be large even in winning windows, and past seasonal strength does not ensure similar outcomes in 2026.
Why does Johnson & Johnson (JNJ) follow this seasonal pattern?
One likely driver is the way the healthcare sector sits at the crossroads of policy and earnings during the back half of a midterm election year. Analysts have pointed to portfolio rebalancing into defensive, cash‑generative names like Johnson & Johnson as investors navigate election rhetoric, drug‑pricing headlines and shifting rate expectations.[1][2] This pattern may also reflect the company’s earnings calendar, with investors positioning around October results and guidance updates that often land inside this Sep 9 to Nov 4 trading window.[4][6]
What is driving Johnson & Johnson (JNJ) today?
Johnson & Johnson closed Thursday at $275.21, up 1.48% on the session and sitting about 0.5% below its 52‑week high, after a summer run that has lifted the stock roughly 6.38% over the past month. The move caps a stretch in which the healthcare giant delivered a clean Q2 beat, posting EPS of $2.90 versus estimates around $2.84 to $2.85 and revenue of $25.31 billion, up 6.6% year over year, helped by strength in its Innovative Medicine and MedTech franchises.[1][2][5] UBS this week reiterated a bullish stance and raised its price target to $320, citing the company’s roughly $670 billion market value and confidence in oncology and cardiovascular growth drivers, while broader analyst consensus sits at a “Moderate Buy” with an aggregate target near $272.83 that has already been overtaken by the latest rally.[1][2]
Options markets have been active around the name. In July, derivatives desks flagged unusual put buying ahead of the July 15 earnings release, followed by a surge in call contracts in August, with one report noting 34,603 calls traded, about 29% above normal volumes.[8][9] That mix of hedging and upside positioning sets the stage for the next catalyst: Johnson & Johnson’s scheduled earnings report on Oct 13, where management is expected to update on full‑year EPS guidance of $11.600 to $11.750 against Street estimates clustered just below that range.[4][6]
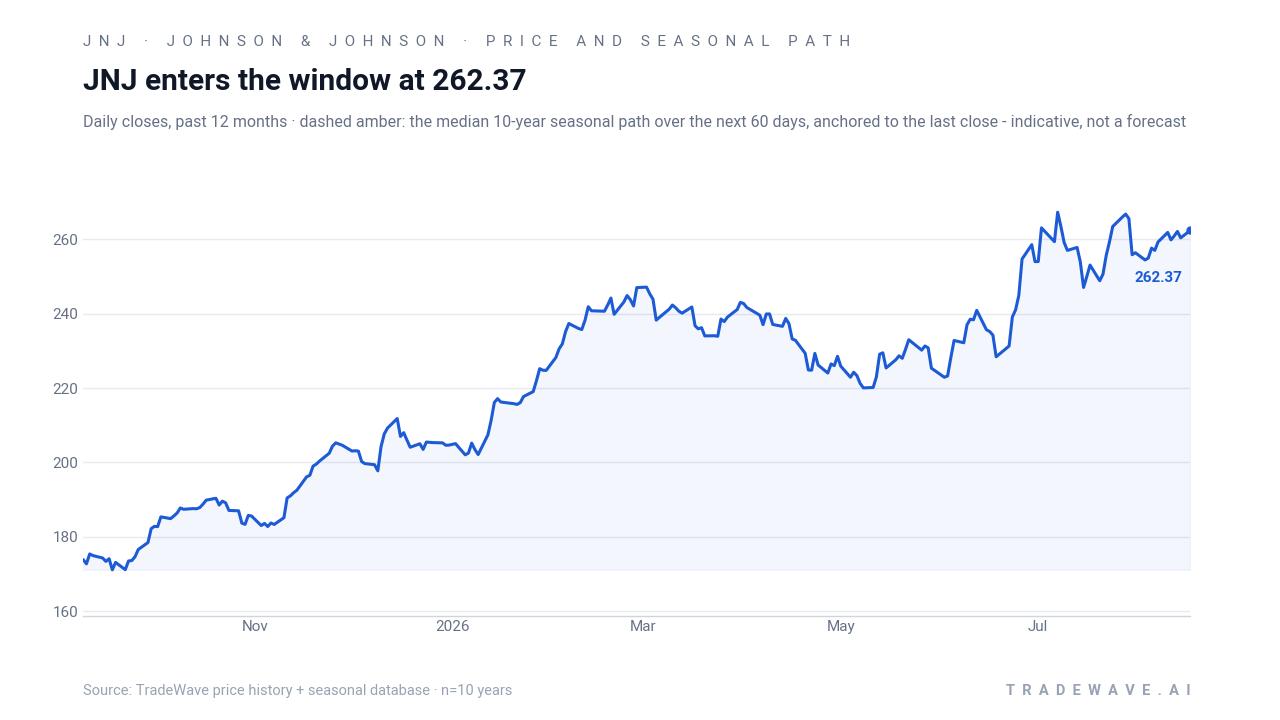
The chart below situates the latest move against the past year of trading and the median seasonal path into early November.
What should traders watch as this Johnson & Johnson seasonal window opens?
First, the calendar: the 57‑day window kicks off on Sep 9 and runs through Nov 4, overlapping both the run‑up to the Oct 13 earnings report and the final stretch of the midterm election year.[4][6] Historically, JNJ has tended to build gains steadily across this span rather than spiking in a single day, so traders watching this Johnson & Johnson trading window will be focused on whether price action tracks that gradual climb or stalls near current highs.
Second, levels matter. With the stock hovering just under its 52‑week high, how JNJ behaves around the $276 to $280 zone will be an early tell for whether this midterm‑year seasonal pattern can extend the move or whether supply emerges from profit‑takers. A decisive break higher on solid earnings and guidance would be consistent with the historical seasonality, while a failure at these levels followed by deeper drawdowns inside the window would mark a clear departure from the last 10 cycles.
Third, options flow bears watching. If the elevated call activity seen in August persists or builds into October, it would signal that speculative and hedging demand is leaning into the upside narrative that has defined prior Sep‑to‑Nov windows.[8][9] A sharp reversal toward heavy put buying or a collapse in overall options volume, by contrast, would suggest traders are less willing to pay for exposure to a pattern that has been nearly flawless on paper.
Finally, the macro and policy backdrop will color how this healthcare seasonal outlook plays out. Any shift in drug‑pricing rhetoric, reimbursement policy or rate expectations that affects defensive yield‑and‑growth names could either reinforce or blunt the historical bias. For a mega‑cap like Johnson & Johnson, which anchors both healthcare indices and broad equity benchmarks, how it trades inside this window will be one of the cleaner real‑time tests of whether election‑cycle seasonality still has teeth in 2026.[1][2][4]
Sources
- MarketBeat - Johnson & Johnson (NYSE:JNJ) Given New $320.00 Price Target at UBS Group
- GuruFocus - JNJ Maintained by UBS -- Price Target Raised to $320
- Yahoo Finance - Johnson & Johnson (JNJ) Q2 Earnings Preview: What You Should Know Beyond the Headline Estimates
- Yahoo Finance - Johnson & Johnson (JNJ) Rises As Market Takes a Dip: Key Facts
- Public.com - JNJ Earnings: Latest Report, Earnings Call & Financials
- Zacks - What date does Johnson & Johnson's (JNJ) report Earnings - Earnings Calendar & Announcement
- Johnson & Johnson Investor Relations - Johnson & Johnson reports Q4 and Full-Year 2025 results
- Barchart - Unusual Put Option Activity in Johnson & Johnson After JNJ Stock's Recent Runup
- MarketBeat (options page) - Johnson & Johnson (JNJ) Options Chain & Prices 2026
About this seasonal analysis
Seasonal pattern data is sourced from TradeWave.ai, which analyzes historical price behavior across annual calendar windows going back up to 30 years. Read the full data methodology or the book The 100-Year Pattern by Afshin Moshrefi (2026 edition). Past performance of seasonal patterns does not guarantee future results. This article is for informational purposes only and does not constitute investment advice.