HP Inc. (HPQ) Earnings Beat Sparks Rally Into a 14-of-15 Midterm Fall-Winter Run
HP Inc. is heading into a historically strong Sep 27–Feb 11 trading window just as shares trade near a 52-week high after an earnings beat and heavy options positioning.
Price as of Aug 28, 2026: $30.52 (last close).
What is the seasonal pattern for HP Inc. (HPQ)?
HP Inc. has risen in 14 of 15 midterm-year Sep 27–Feb 11 windows, with an average gain of 28.73% in winning years.
- 14 for 15 in this window, with winning years averaging 28.73% gains and only one losing year across the sample.
- Seasonal window runs from Sep 27 for 138 days into mid-February, covering the late midterm election year and early pre-election year.
- Percent Profitable is 93%, with 14 winners and 1 loser in the last 15 midterm election years.
- Avg Profit is 28.73% in winning years, while Avg Profit - All, which includes the lone losing year, is still a strong 26%.
- Historical maximum favorable moves have often exceeded 40%, but adverse excursions within the window have reached more than 20% in the weakest year.
- The pattern aligns with a long trade direction, with a Sharpe ratio of 1.43 and a TradeWave Ratio of 1.67 indicating strong risk-adjusted and directional travel in this HPQ seasonal trend.
According to historical data from TradeWave.ai, this specific fall–winter stretch has behaved very differently from an average month on the calendar for HP Inc., and the next iteration is approaching quickly.
How strong is HP Inc. (HPQ) in the upcoming Sep 27–Feb 11 window?
HP Inc. has closed higher in 14 of the past 15 midterm-year Sep 27–Feb 11 windows, a near-perfect record that has compounded to a 2,731% cumulative return when stacked year after year. The stock finished the prior session at 30.52, up 3% on the day and about 5.2% below its 52-week high of 32.19, leaving it near the top of its recent range. Options traders recently bought 47,622 HPQ put contracts, roughly 55% above typical daily volume, signaling a notable hedge or downside bet into this historically bullish stretch.[8] That mix of a powerful historical tailwind and fresh caution in the derivatives market sets up a tension that traders will be watching as the window opens on Sep 27.
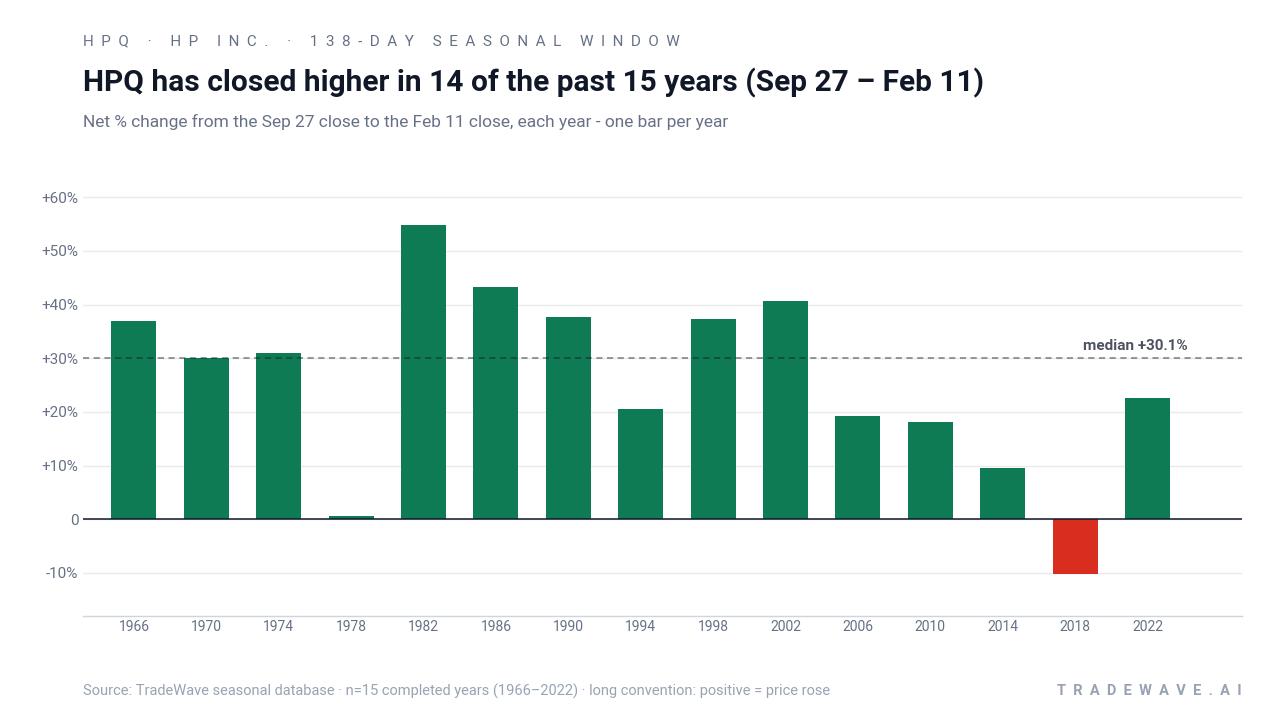
Because this pattern is grouped by the presidential election cycle, it reflects how HPQ has behaved specifically in the last 15 midterm election years as markets transition into the year before the presidential election. That matters for a PC and AI hardware name like HP Inc., since corporate IT budgets, government spending and risk appetite often shift as Washington moves from midterm gridlock toward a more stimulus-friendly pre-election backdrop.
This seasonal window begins on Sep 27 and spans 138 days into Feb 11. Historically, during this period, HP Inc. has shown a strong bullish tendency in midterm election years, with a long trade direction and only one losing outcome in 15 tries. Percent Profitable sits at 93%, with 14 winners and 1 loser, and the average gain in winning years is 28.73%, while the all-years average, including the down year, is still 26%. The median profit of 30.05% and an annualized return of 24.97% underline how consistently this HPQ seasonal trend has rewarded long exposure in this slice of the calendar.
The per-year breakdown shows how that strength has played out. In 2002, HPQ logged a 40.67% net return in the window, with a maximum favorable move of 76.99% from the entry before giving some back by the close. In contrast, the lone losing year, 2018, saw a net loss of 10.17% and a worst intraperiod drawdown of 24.47%, illustrating that even in a pattern dominated by winners, the downside in a bad year can be sharp.
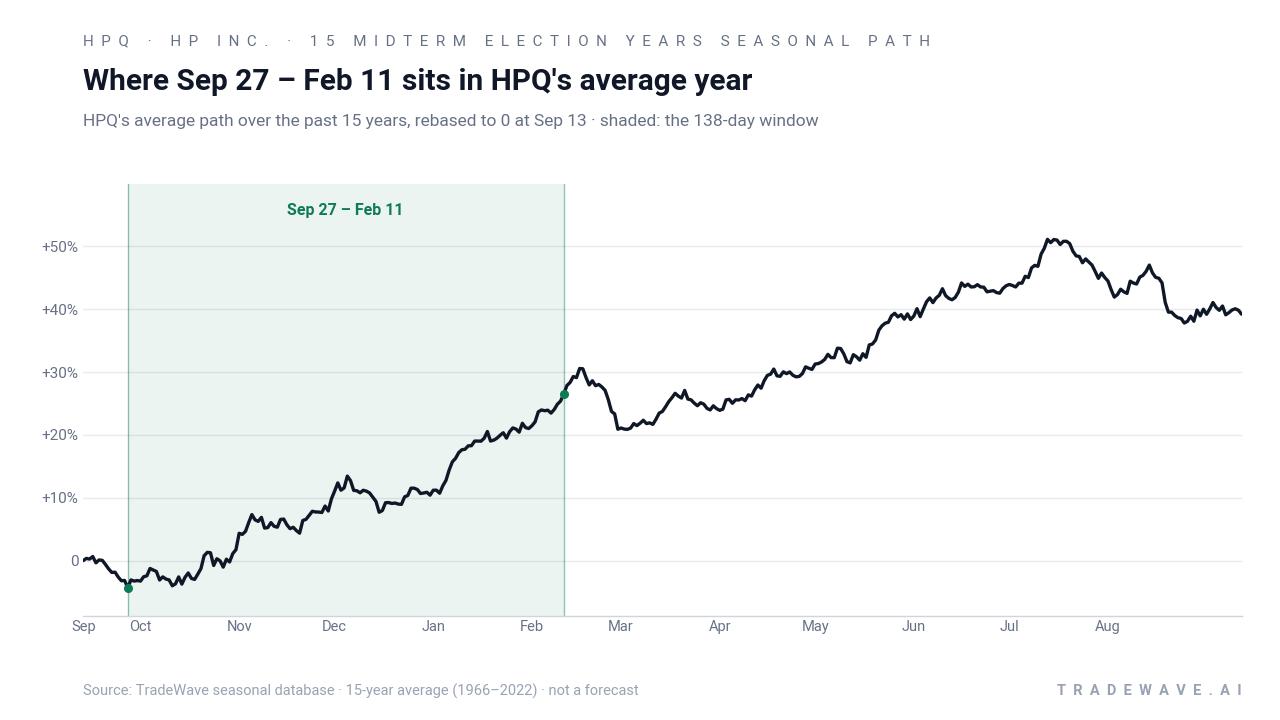
The historical seasonal average shows HPQ typically grinding higher into the start of the window, then accelerating through the heart of the fall and early winter before flattening out closer to February. That profile suggests the strongest gains have often clustered in the first two-thirds of the window, with later weeks more about consolidation than fresh breakouts.
Yearly net and intraperiod swings highlight how upside and drawdowns have coexisted in this HP Inc. trading window.
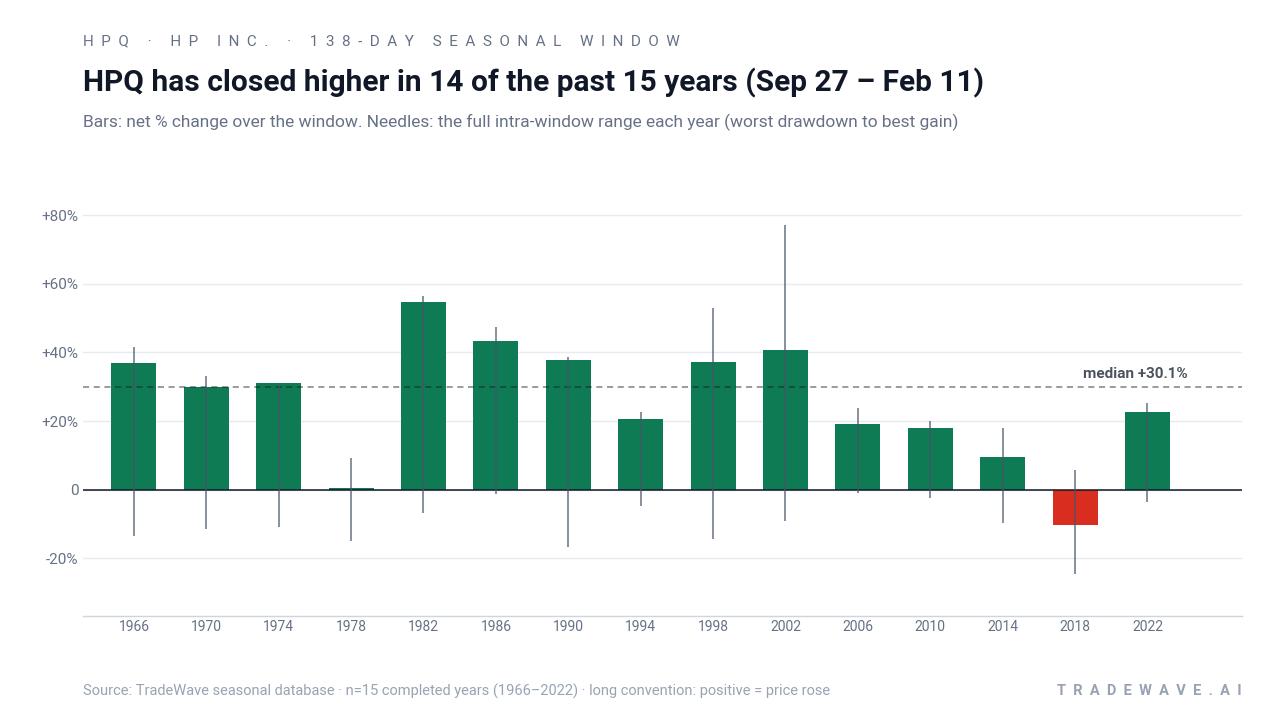
The combined net / maximum favorable / maximum adverse chart makes the risk-reward profile clear. In strong years like 1998 and 2002, HPQ’s best intraperiod gains exceeded 50% and 70% respectively, while the worst drawdowns stayed in single digits, a favorable setup for long trades that could sit through modest volatility. In weaker years, the maximum adverse move has pushed beyond 15% even when the final result was positive, and in 2018 the 24.47% worst drawdown shows how quickly sentiment can flip inside this otherwise bullish seasonal pattern.
History does not guarantee future results; adverse excursions (MAE) can be large even in winning windows.
Why does HP Inc. (HPQ) follow this seasonal pattern?
One likely driver is the clustering of HP’s fiscal year-end and key earnings reports around this period, which can reset expectations and trigger multi-month repricing in the stock.[4] Analysts have also pointed to PC replacement cycles and holiday-season demand, which tend to support HP’s Personal Systems segment into year-end before corporate IT budgets refresh early in the new year.[2] Layered on top of that, the shift from the midterm election year into the year before the presidential election has often coincided with a more supportive policy and liquidity backdrop for cyclical tech names, amplifying the historical seasonality.
What is driving HP Inc. (HPQ) today?
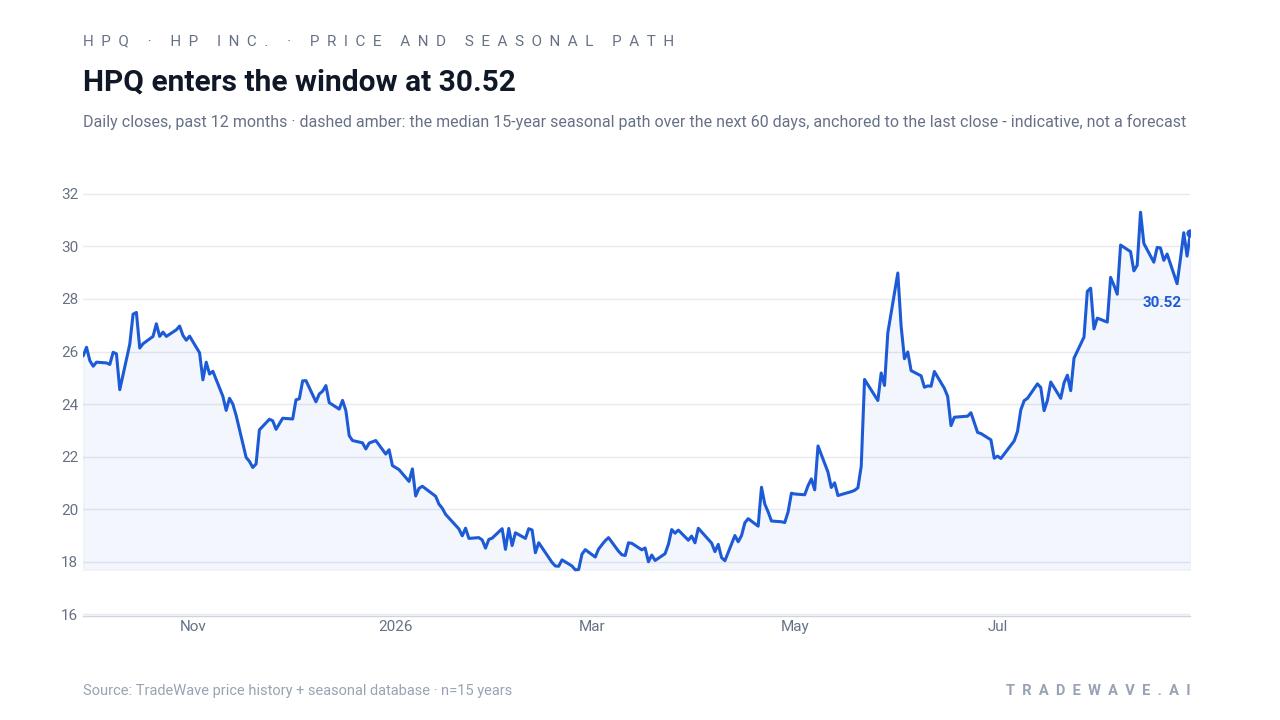
HPQ closed at 30.52 in the prior session, up 3% on the day and roughly 11.9% higher over the past month, leaving the stock just under its 52-week high after a strong run.[9] The latest leg higher followed HP’s Aug 26 quarterly report, where the company beat on both revenue and earnings, posting adjusted EPS of $0.83 versus expectations closer to $0.69 and revenue of $15.68 billion, about $1.25 billion ahead of consensus.[4] That print reinforced a narrative that HP’s pivot toward AI PCs is gaining traction, with earlier commentary in May noting that AI-enabled machines already made up 44% of shipments and could reach 60–70% of the mix next year.[5]
Despite the upbeat earnings and AI PC story, derivatives positioning has turned cautious. On Aug 14, MarketBeat reported that traders bought 47,622 HP put options, about 55% above the typical daily volume of 30,733 contracts, flagging unusually heavy downside hedging or speculative bearish bets.[8] Short interest data updated in late August also show a sizable base of shares sold short, suggesting that a meaningful cohort is still betting against the stock even as fundamentals improve.[10] That split between cash-market strength and defensive positioning in options and shorts is a key backdrop as HPQ approaches its historically strong seasonal window.
On the fundamental side, HP still faces balance-sheet questions. In Dec 2025, filings and analysis highlighted that current liabilities of about $27.9 billion exceeded current assets of $20.6 billion, with an inventory build near $8 billion that could pressure liquidity and force refinancing or additional debt if not worked down efficiently.[2][7] At the same time, HP’s Personal Systems segment, which includes PCs, remains more than 70% of revenue, tying the stock closely to the broader PC market and the pace of AI PC adoption.[2] Analysts tracked by MarketWatch and Yahoo Finance generally sit at a Hold rating with a consensus price target around the mid-$20s, a level that now lags the stock’s latest move and reflects a more cautious stance than the tape suggests.[1][3][6]
The chart below situates the latest move in its recent multi-month context alongside the median 60-day seasonal path.
What should traders watch as this HPQ seasonal window opens?
First, the calendar: the window starts on Sep 27 and runs through Feb 11, covering the final stretch of the midterm election year and the opening months of the year before the presidential election. Historically, that transition has been friendly to HPQ longs, with 14 winners out of 15 and average gains near 30%, but the 2018 drawdown is a reminder that macro shocks or company-specific missteps can still overwhelm the pattern.
Second, price levels. With HPQ about 5.2% below its 52-week high, traders will be watching whether the stock can break above the 32 area and hold it as the window begins, or whether heavy options hedging caps the move. A sustained push above the prior high early in the window would rhyme with the historical tendency for strength in the first two-thirds of the period, while a failure and quick slide back toward the mid-$20s would look more like the rare losing year.
Third, the options tape and short interest. If put buying remains elevated or builds further from the Aug 14 spike, it would signal that institutional players are leaning harder into protection or outright bearish bets even as the seasonal backdrop turns supportive.[8] Conversely, a fade in put volumes and a gradual reduction in short interest through October and November would suggest that skeptics are backing off, which in prior cycles has often coincided with smoother upside paths for stocks in strong seasonal regimes.[10]
Finally, the policy and macro calendar. As the United States wraps up the midterm election year and moves toward the year before the presidential election, investors will parse any shifts in fiscal stance, regulation and rate expectations that could affect corporate IT spending and consumer PC demand. For HP Inc., behavior inside this Sep 27–Feb 11 window will be a real-time test of whether the historical seasonality tied to the election cycle and holiday demand still holds in an AI PC era, or whether today’s balance-sheet and competitive dynamics are rewriting the script.
Sources
- MarketWatch - HPQ | HP Inc. Analyst Estimates | MarketWatch
- Yahoo Finance - HPQ Stock Price Prediction: Where HP Could Be by 2025, 2026, and 2030
- Yahoo Finance - What Are Wall Street Analysts' Target Price for HP Inc. Stock?
- Seeking Alpha - HP Inc. (HPQ) Earnings Dates & Report | Seeking Alpha
- Yahoo Finance - Why Is HP (HPQ) Stock Rocketing Higher Today
- ChartMill - HPQ Stock Price, Quote & Chart | ChartMill.com
- SEC Edgar (HPQ filing) - hpq-20251031
- MarketBeat - HP Target of Unusually Large Options Trading (NYSE:HPQ)
- ChartMill - HPQ Technical Analysis | Trend, Signals & Chart Patterns
- MarketBeat - HP (HPQ) Short Interest & Short Float | Updated Aug 2026
- Seeking Alpha - HP Stock Is A High Yielding Undervalued Tech Stock (Technical Analysis) (NYSE:HPQ)
- MarketBeat - HP (HPQ) Stock Price, News & Analysis
About this seasonal analysis
Seasonal pattern data is sourced from TradeWave.ai, which analyzes historical price behavior across annual calendar windows going back up to 30 years. Read the full data methodology or the book The 100-Year Pattern by Afshin Moshrefi (2026 edition). Past performance of seasonal patterns does not guarantee future results. This article is for informational purposes only and does not constitute investment advice.