Johnson & Johnson (JNJ) Has Rallied in 10 Straight Midterm Fall Windows, Averaging 5.46% Gains
Johnson & Johnson is entering a historically strong 56-day fall window in midterm election years, even as shares trade below their 52-week high and investors weigh earnings strength against ongoing legal risk.
Price as of Sep 9, 2026: $267.08 (last close).

What is the seasonal pattern for Johnson & Johnson (JNJ)?
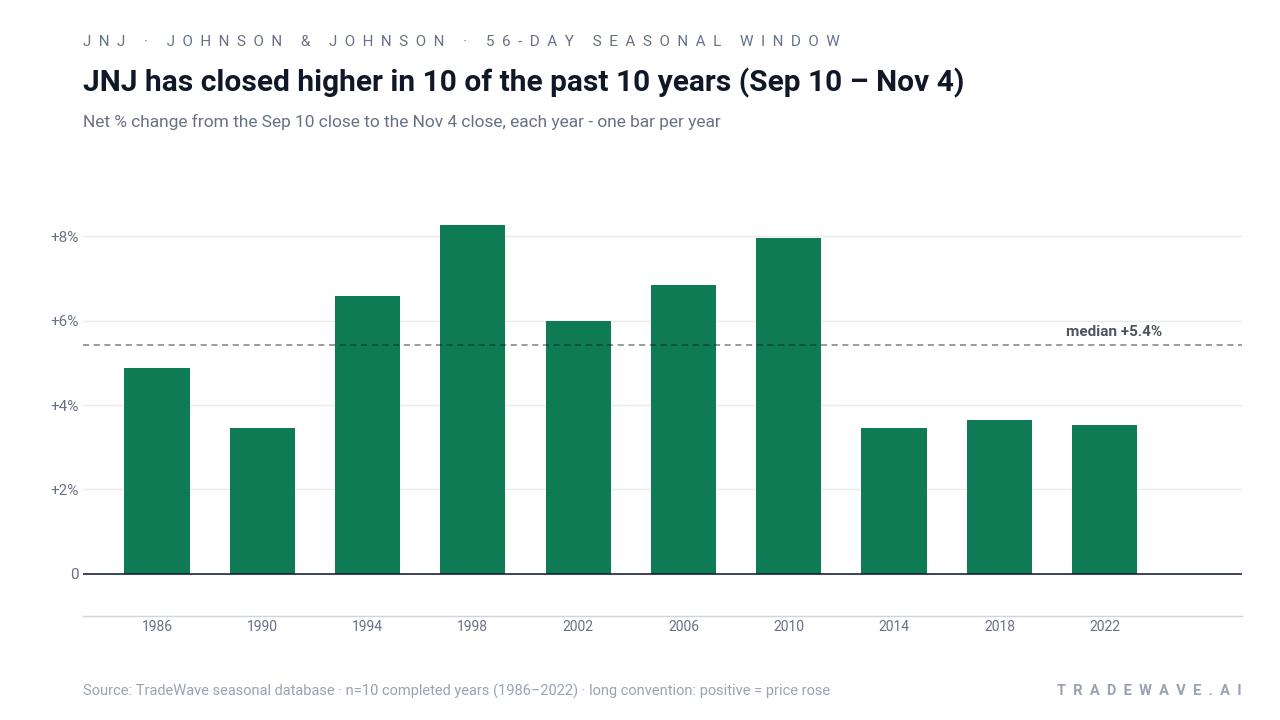
Johnson & Johnson has risen in 10 of 10 midterm-year fall windows starting Sep 10, with an average gain of 5.46% in winning years.
- 10 for 10 in this window, averaging 5.46% gains in winning years across the last 10 midterm election cycles.
- Seasonal window runs 56 days from Sep 10 to Nov 4, with a long trade direction bias.
- Percent Profitable is 100%, with 10 winners and 0 losers in the historical sample.
- Annualized return for the window clocks in at 5.44%, with a Sharpe ratio of 2.54 based on end-of-window outcomes.
- TradeWave Ratio of 2.08 signals that price has typically traveled meaningfully in the trade direction within the window.
- Worst intraperiod drawdowns have still been sizable in some years, underscoring that even a strong JNJ seasonal trend can be bumpy.
According to historical data from TradeWave.ai, this specific midterm-year fall stretch has behaved very differently from an average month on the calendar for Johnson & Johnson. The next section walks through how that pattern has played out and where the current cycle fits.
How has Johnson & Johnson (JNJ) traded in this midterm-year fall window?
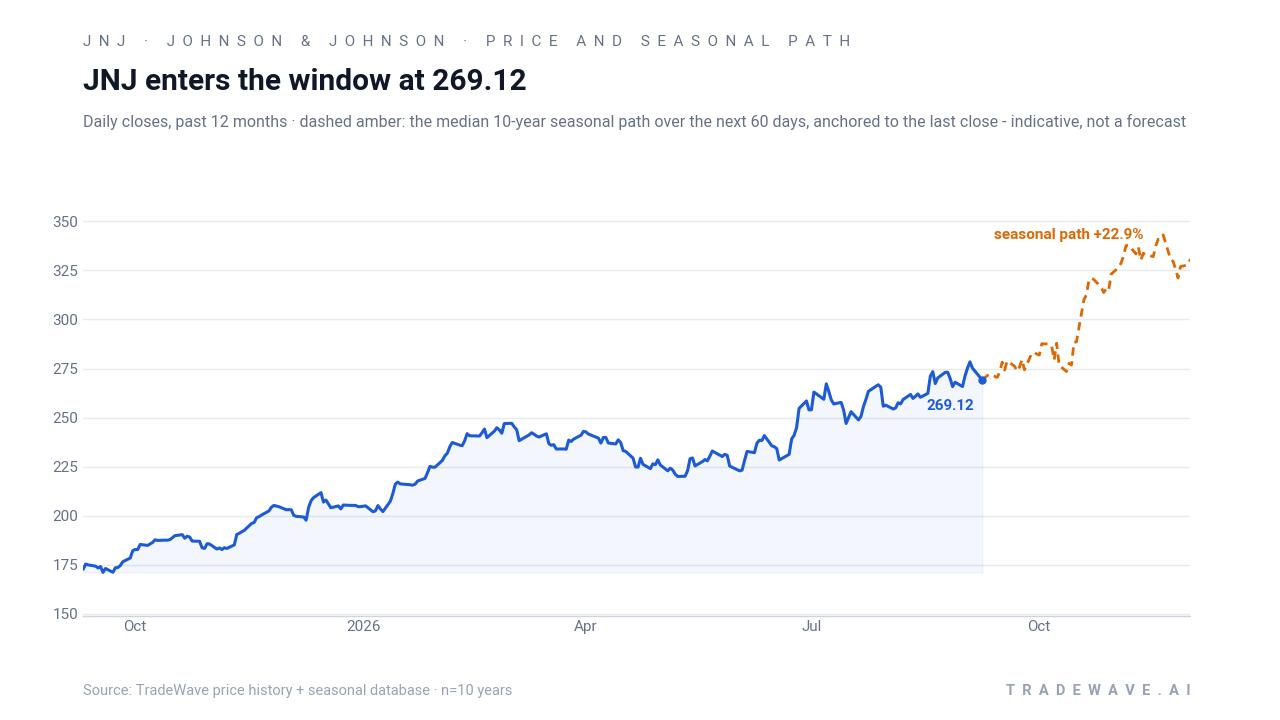
Johnson & Johnson has posted gains in every one of the last 10 midterm election years during the 56-day window that runs from Sep 10 to Nov 4, with an average profit of 5.46% for long positions. Shares finished the prior session at 269.12 and last traded at 267.08 on Sep 10, leaving the stock about 5.0% below its 52-week high of 281.07. This combination of a strong JNJ seasonal trend and a pullback from the highs gives traders a clean reference point as the new window opens.
Because this pattern is grouped by the presidential election cycle, it only looks at midterm election years, which tend to feature policy uncertainty early in the year and a clearer fiscal and regulatory path as markets pivot toward the year before the presidential election. For a defensive healthcare bellwether like Johnson & Johnson, that backdrop has often coincided with investors rotating back into stable earnings compounders as the macro narrative shifts from midterm noise to pre-election positioning.
Across the 10 completed midterm-year samples from 1986 through 2022, the trade direction is firmly long. Percent Profitable is 100%, with 10 winners and 0 losers, and the annualized return for the window is 5.44%. Average profit for these winning years is 5.46%, while the median profit is 5.44%, which tells you the distribution is tight rather than driven by one outlier year.
The per-year table shows that the strongest net return came in 1998, when the stock gained 8.26% between Sep 10 and Nov 4, while the softest outcome was 3.45% in 1990. Even that weakest year still finished positive for a long position. Add it up: stacking this same 56-day window across the 10 midterm election years compounds to a 69% cumulative gain.
Intraperiod swings have been meaningful. Maximum favorable moves inside the window have ranged from mid-single digits to the mid-teens, with 1994 showing a best point-to-peak gain of 14.43% before settling back to a 6.58% net return. On the downside, maximum adverse excursions have occasionally been deep, including drawdowns of around 9% in 1986 and 2014 before the stock recovered to finish the window in the green.
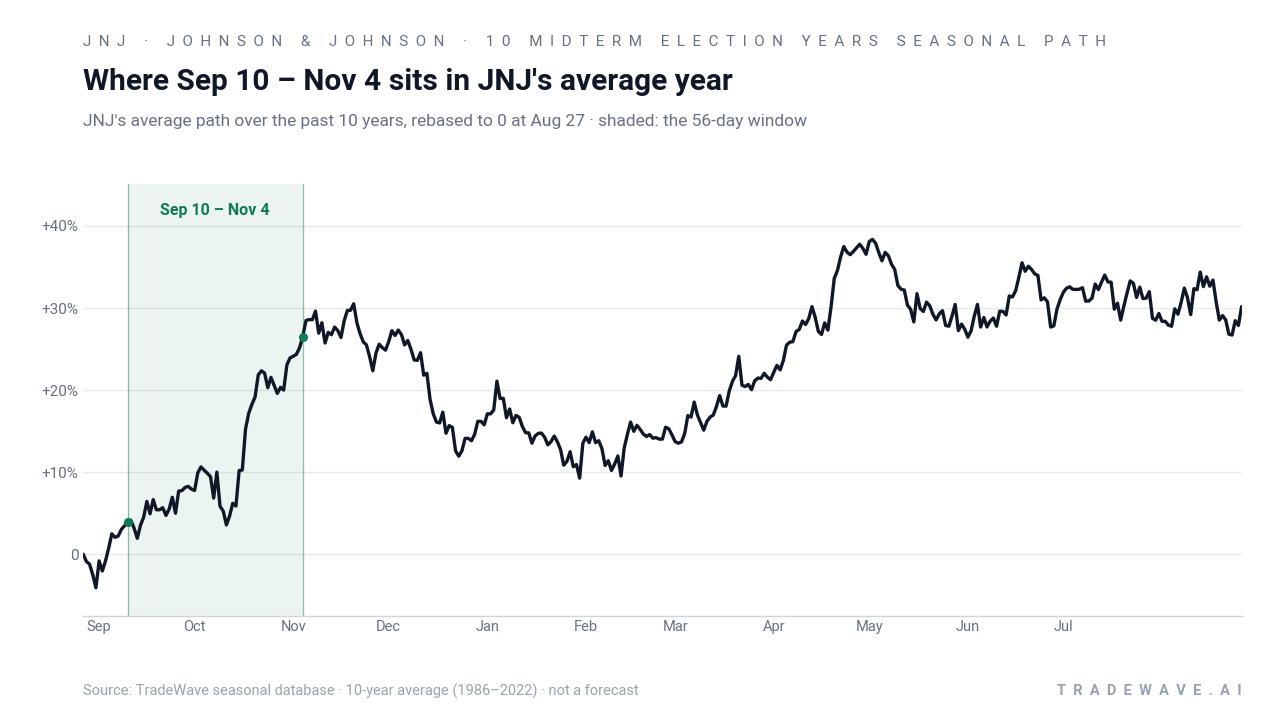
The typical path of the JNJ seasonal trend in this stretch is a steady grind higher rather than a straight line. The trend statistics show more long than short days within the window, and the “Trend Long” and “Trend Long1” counts both outnumber their short counterparts, which lines up with the smooth cumulative profile. Historically, the stock has tended to firm up early in the window and then add to gains into late October and early November.
Year-by-year ranges show how much JNJ has typically moved inside the window before settling at its final gain.
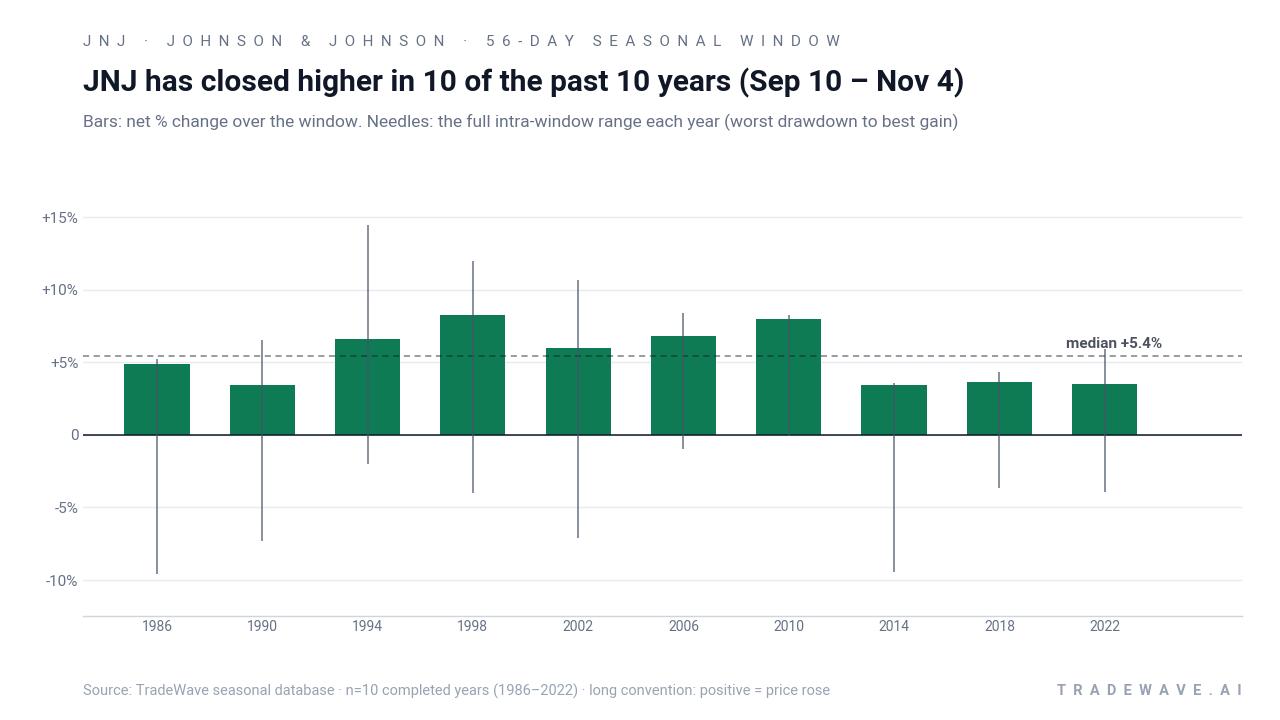
The bars-and-needles view makes the volatility profile clear. In several years, such as 2002 and 2018, Johnson & Johnson experienced mid-single-digit drawdowns before finishing with gains of roughly 3% to 6%. In others, like 1994 and 1998, the stock pushed to double-digit peak gains inside the window, even though the final close-to-close return was more modest. That mix of sizable maximum favorable and maximum adverse excursions is exactly what the TradeWave Ratio of 2.08 is flagging: when this Johnson & Johnson trading window moves, it tends to move decisively in both directions before resolving higher.
History does not guarantee future results; adverse excursions can be large even in winning windows, and traders should respect the potential for sharp drawdowns inside this historically strong stretch.
Why does Johnson & Johnson (JNJ) follow this seasonal pattern?
One likely driver is the way the healthcare sector fits into the presidential election cycle. In midterm election years, policy and reimbursement headlines often dominate the first half of the year, then fade as investors pivot toward the year before the presidential election and refocus on earnings durability and dividend growth. Analysts have also pointed to portfolio rebalancing and sector rotation into defensive names like Johnson & Johnson in the fall, as large institutions position for year-end and the historically stronger pre-election year that follows.
What is driving Johnson & Johnson (JNJ) today?
Johnson & Johnson last changed hands at 267.08, down 0.8% on the day, after opening at 268.51 and trading between 266.73 and 270.10 on volume roughly in line with its 20-day average of about 5.7 million shares. The stock sits about 5.0% below its 52-week high of 281.07 and above its 50-day moving average of 262.06, leaving it in a gentle uptrend rather than a stretched breakout.
Fundamentally, the story is still anchored in earnings power and product mix. In January 2026, Johnson & Johnson forecast 2026 operational sales of $99.5 billion to $100.5 billion and full-year EPS of $11.43 to $11.63 per share, a revenue outlook that topped Wall Street expectations at the time while roughly matching profit consensus.[1] The company also reported Q4 2025 adjusted earnings of $2.46 per share on $24.56 billion in revenue, beating analyst estimates on both lines.[1][4]
Product-wise, oncology and newer drugs have been doing the heavy lifting. In Feb 2026, analysis highlighted that Innovative Medicine operational sales grew 7.9% in Q4 2025, with Carvykti nearly doubling and Darzalex growing around 20% year over year, more than offsetting a more than 1,000 basis point drag from Stelara erosion.[2][3] That mix shift has helped support the broader healthcare seasonal outlook for Johnson & Johnson even as legacy products fade.
There is still legal overhang. In January 2026, a court-appointed special master recommended allowing expert testimony linking some talc products to ovarian cancer, keeping litigation risk firmly on the radar for investors and analysts.[1] At the same time, tariff pressures and a deal with the Trump administration to cut some drug prices have been cited as headwinds, though they did not prevent management from issuing guidance that exceeded revenue expectations.[1]
More recently, Johnson & Johnson’s July 2026 quarter showed the familiar split: the company beat Wall Street estimates on the back of strong medicines like Tremfya and Darzalex, while the medical device unit underperformed, prompting a modestly more cautious read-through on MedTech demand.[1] Even so, management raised its full-year sales and profit outlook, reinforcing the narrative of a diversified healthcare giant that can lean on its pharma engine when devices lag.
The chart below situates the latest move in its recent multi-month context and overlays the median seasonal path for the coming weeks.
What should traders watch in this Johnson & Johnson (JNJ) window?
First, the calendar. This 56-day stretch sits at the end of the midterm election year and runs into early November, just before markets fully pivot to the year before the presidential election. Historically, that transition has been friendly to Johnson & Johnson, with the stock going 10 for 10 in this window and compounding to a 69% cumulative gain across those cycles.
Second, price behavior relative to the seasonal template. If JNJ holds above its 50-day moving average and begins to grind higher in line with the historical pattern, it would confirm that the familiar midterm-year fall bias is still in play. A sharp break below recent lows or a failure to participate in any broader healthcare strength would be an early sign that this cycle may diverge from the usual JNJ seasonal trend.
Third, the policy and litigation tape. Any new developments on drug pricing, tariffs, or talc litigation could inject volatility into this Johnson & Johnson trading window, especially if they land near earnings or guidance updates.[1] Historically, the window has tolerated sizable intraperiod drawdowns before finishing higher, so traders will want to distinguish between noise that fits the usual pattern and headlines that fundamentally change the earnings or legal outlook.
Finally, watch how sector rotation behaves as the market edges toward the year before the presidential election. If investors continue to favor defensive healthcare and cash-generative pharma names into year-end, that would align with the historical seasonality that has favored long exposure to Johnson & Johnson in this specific fall stretch. A decisive rotation out of defensives and into higher-beta cyclicals, by contrast, would be one of the cleaner ways this otherwise consistent pattern could break.
Sources
About this seasonal analysis
Seasonal pattern data is sourced from TradeWave.ai, which analyzes historical price behavior across annual calendar windows going back up to 30 years. Read the full data methodology or the book The 100-Year Pattern by Afshin Moshrefi (2026 edition). Past performance of seasonal patterns does not guarantee future results. This article is for informational purposes only and does not constitute investment advice.