Hormel Foods (HRL) Has Rallied in 10 of 10 Midterm Fall Windows, Averaging 9.97% Gains
Hormel Foods is heading into a historically strong 60-day fall window just as the stock trades near its 52-week low and investors digest weaker profit guidance and portfolio reshaping plans.
Price as of Sep 9, 2026: $20.97 (last close).
What is the seasonal pattern for Hormel Foods (HRL)?
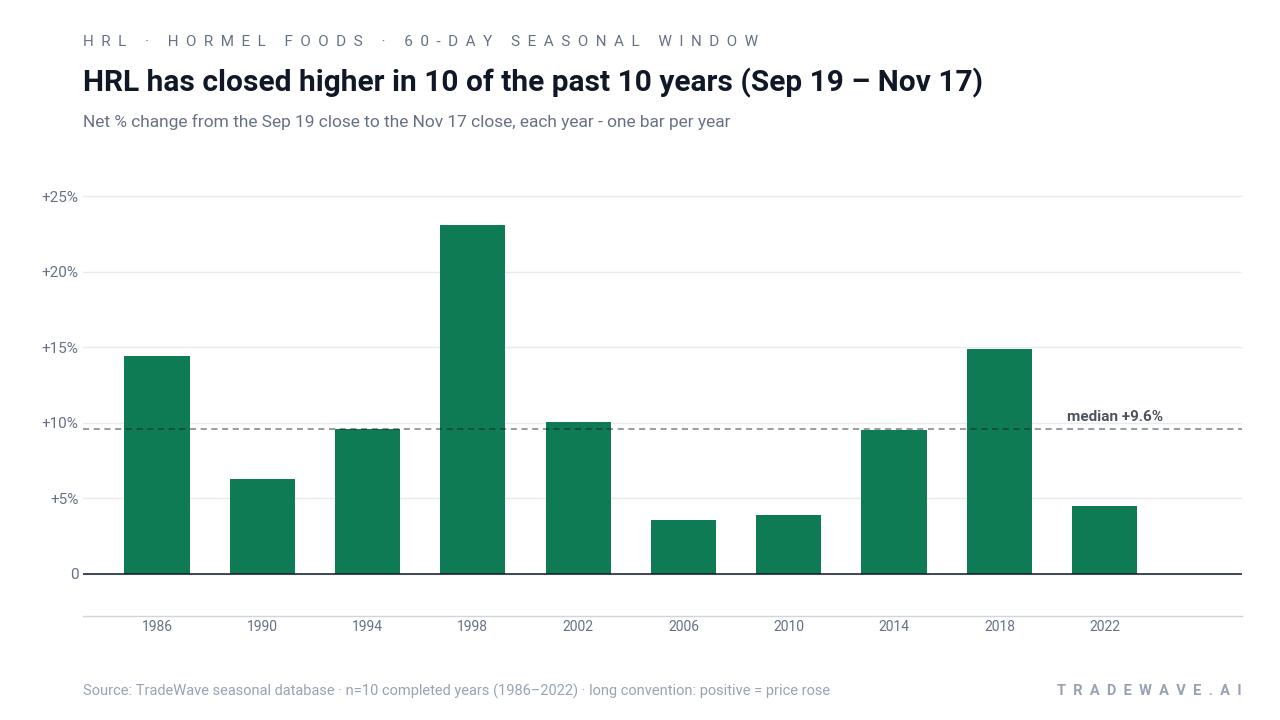
Hormel Foods has risen in 10 of 10 midterm-year fall windows starting around Sep 19, with an average gain of 9.97% in winning years.
- 10 for 10 in this window, averaging 9.97% gains in winning years across the last 10 midterm election cycles.
- Seasonal window runs from Sep 19 to Nov 17, a 60-day stretch that has historically favored long positions in HRL.
- Percent Profitable is 100%, with 10 winners and 0 losers across the historical sample.
- TradeWave Ratio of 1.64 suggests price has typically traveled meaningfully in the trade direction within the window.
- Sharpe ratio of 1.52 points to a strong risk-adjusted profile for this specific seasonal window.
- Intraperiod swings have included both rallies and drawdowns, so timing and risk controls still matter even in a strong pattern.
According to historical data from TradeWave.ai, this midterm-year fall stretch has behaved very differently from an average month on the calendar for Hormel Foods, and the next iteration is about to open again.
How has Hormel Foods (HRL) traded in past midterm fall windows?
Hormel Foods has closed higher in every single midterm-year fall window since 1986, with gains in 10 of 10 cycles and an average move of 9.97% over 60 days. The next window begins on Sep 19 and arrives with HRL changing hands at 20.97, about 20.7% below its 52-week high of 26.43 and only about 7.6% above its 52-week low.
Grouping the data by presidential election cycle matters here because this window sits in the concluding midterm election year, just before the pre-election year that has often been friendlier to risk assets. For a defensive consumer name like Hormel Foods, that means the Sep 19 to Nov 17 stretch has historically lined up with a period when policy uncertainty starts to fade and investors reposition toward steadier earnings streams.
Across the last 10 midterm election years, the long-only strategy in this 60-day window has produced a cumulative return of 155%, with an annualized return of 9.82%. The median outcome is a 9.57% gain, which is close to the average, suggesting the pattern is not being skewed by a single outlier year.
The strongest year in the sample was 1998, when HRL gained 23.08% between the Sep 19 entry and the Nov 17 exit, after reaching a maximum favorable move of 28.54% at the intra-window peak. The softest outcome still counted as a win: in 2006 the stock added 3.54% over the window, with a best run-up of 5.82% and a modest worst drawdown of 1.97% from the starting level.
Intraperiod swings have been manageable but not trivial. In 1990, for example, HRL finished the window up 6.27% but at one point was down 7.45% from the entry before recovering. In 2022 the stock closed the window with a 4.5% gain after a maximum favorable move of 4.96% and a worst drawdown of 4.09%, a reminder that even “all green” windows can involve uncomfortable dips along the way.
Yearly net and intraperiod ranges show how upside and downside have coexisted inside this otherwise consistent window.
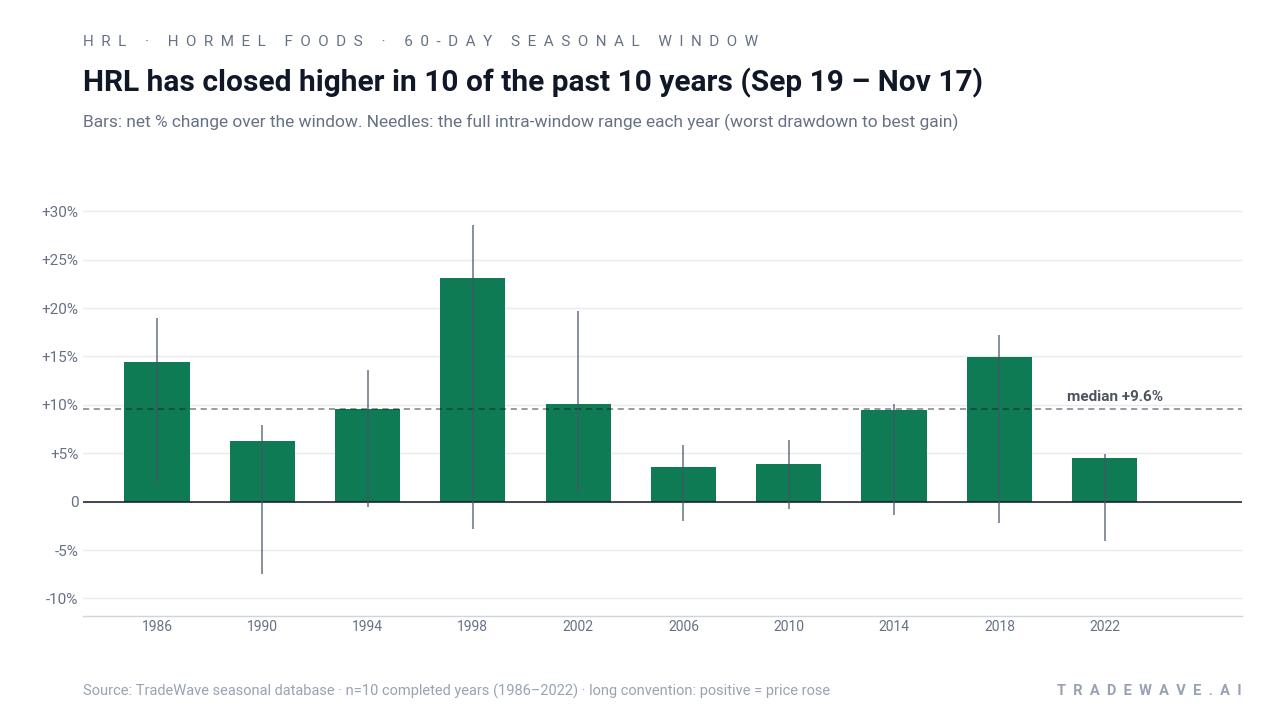
The combined net-return and range chart shows a tight cluster of positive closes, with maximum favorable moves often stretching into the low double digits and maximum adverse moves generally contained in the mid-single digits. That profile lines up with the long trade direction and the 1.64 TradeWave Ratio, which together describe a window where upside has historically outweighed downside without eliminating volatility.
History does not guarantee future results; adverse excursions can still be meaningful even in windows where every historical instance has finished higher.
Why does Hormel Foods (HRL) follow this seasonal pattern?
One likely driver is the way the company’s fiscal calendar and earnings cadence intersect with the broader presidential election cycle. Portfolio managers often rebalance defensive consumer holdings late in midterm years as policy risk starts to clear and they position for the typically stronger pre-election year. For a staples name tied to holiday-season demand and protein pricing, that combination of earnings visibility, consumer spending patterns and sector rotation may help explain why this specific Sep 19 to Nov 17 window has repeatedly favored the long side.
What is driving Hormel Foods (HRL) today?
Hormel Foods shares closed Thursday at 20.97, down 1.13% on the day, leaving the stock about 20.7% below its 52-week high and roughly 7.6% above its 52-week low after a tough month that has seen a 14.13% slide. Trading volume of about 4.16 million shares came in below the recent 20-day average of roughly 5.13 million, suggesting the latest leg lower has not yet triggered capitulation-style activity.
The fundamental backdrop has been challenging. On May 28, 2026, Hormel reported lower profit for the second quarter on revenue of $2.97 billion and cut its full-year earnings outlook to a range of $1.28 to $1.37 per share, down from a prior $1.37 to $1.46, as margin pressure persisted.[5] Management has been wrestling with higher input costs across beef, pork, poultry and turkey, as well as disease-related disruptions that have complicated supply chains and weighed on profitability.[6]
In Dec 2025, the company had sounded more upbeat, forecasting annual profit above Wall Street estimates on the back of price increases and cost-cutting plans, including its Transform and Modernize initiatives.[6] Subsequent coverage in late 2025 highlighted how Hormel was reshaping its portfolio toward higher-growth categories such as snacks and value-added protein, while trimming exposure to more volatile commodity-linked lines.[8] The downgrade to guidance in 2026 suggests that execution on those plans is running into a tougher macro and commodity backdrop than initially hoped.
Sector-wise, Hormel sits squarely in the consumer defensive and packaged foods group, which has been contending with shifting demand patterns as shoppers trade down, experiment with private labels and adjust to higher shelf prices.[4] For a company that spans pork, poultry, ready-to-eat meals and branded snacks, that means juggling volume, pricing power and promotional intensity at the same time that feed and livestock costs remain elevated.[4][6]
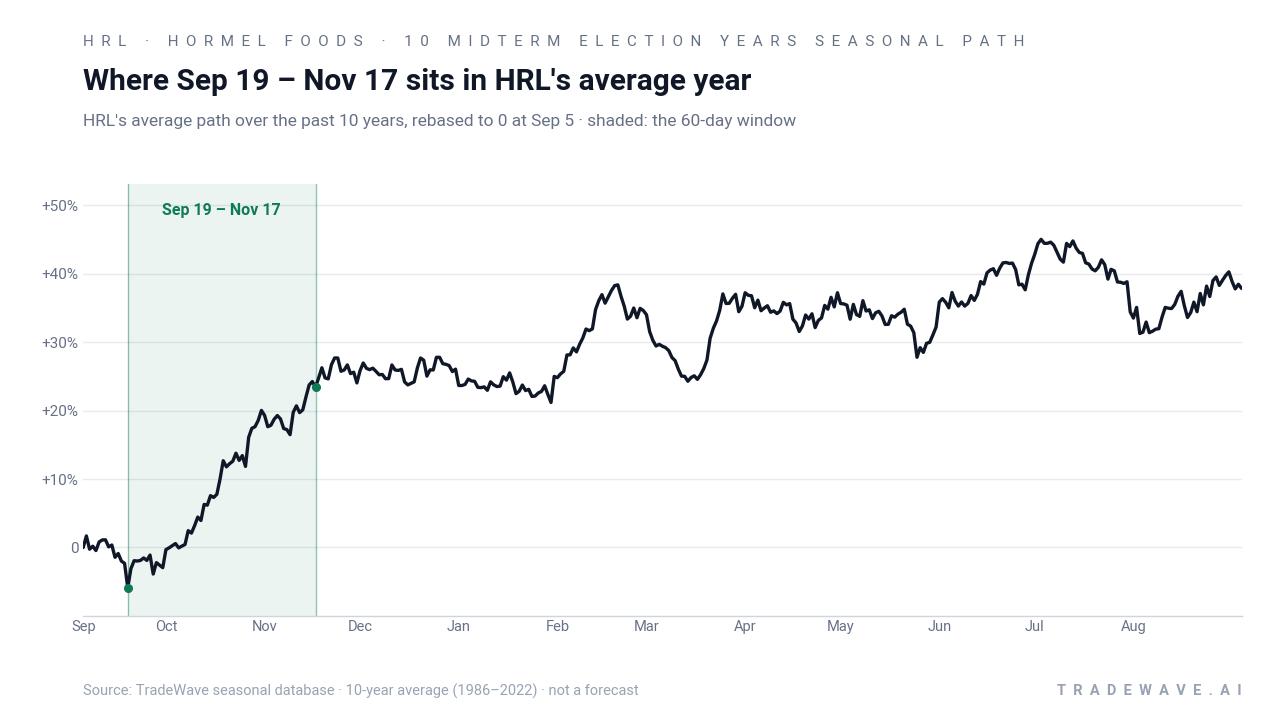
The chart below puts the latest pullback in context and overlays the historical seasonal path for the upcoming 60-day window.
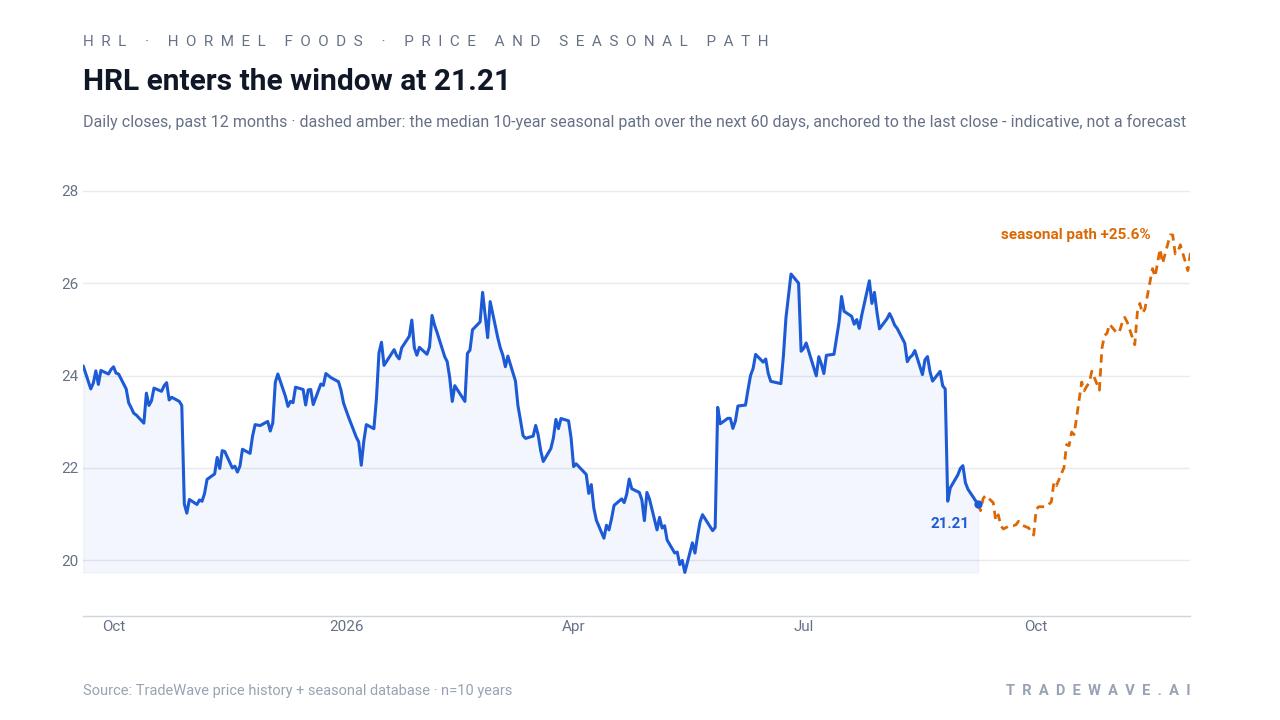
From a positioning standpoint, the setup is unusual: a stock under pressure on earnings and margin concerns, sitting near the bottom of its one-year range, about to enter what has historically been its strongest 60-day slice of the midterm election year. For traders who track historical seasonality, the key question is whether the current fundamental headwinds will blunt a pattern that has been 10 for 10, or whether the combination of defensive sector flows and portfolio rebalancing into year-end will once again line up with the established HRL seasonal trend.
What should traders watch in this Hormel Foods (HRL) window?
First, watch how HRL behaves as the Sep 19 window opens relative to the 52-week low near 19.49. A decisive break below that level early in the window would mark a clear departure from prior cycles, which have historically seen the stock grind higher rather than make fresh lows.
Second, monitor upcoming commentary on input costs and pricing, especially any updates that build on the May 28 guidance cut.[5][6] Signs that commodity inflation is easing or that price increases are sticking with consumers would support the kind of margin stabilization that has often underpinned past midterm-year rallies in the name.
Third, pay attention to volume and volatility as the seasonal window progresses. In prior years, the best-performing instances have often featured steady accumulation rather than violent spikes, with maximum favorable moves building over the 60 days while drawdowns stayed contained. If this cycle instead delivers heavy-volume selling and deeper-than-usual intraperiod drops, that would be an early signal that the historical pattern is being challenged.
Finally, keep an eye on how Hormel trades relative to the broader consumer defensive and packaged foods group.[4] Outperformance into late October and mid-November would be consistent with the historical HRL seasonal trend and with the typical transition from midterm election year uncertainty into the more constructive pre-election year. Underperformance, especially if paired with fresh negative news on margins or portfolio strategy, would suggest that company-specific issues are overpowering what has been a remarkably consistent calendar tailwind.
Sources
- Barchart.com - Rosen Law Firm Encourages Hormel Foods Corporation Investors to Inquire About Securities Class Action Investigation - HRL - Barchart.com
- Finviz - Hormel (HRL) Featured in Barclays' Forward Look at Agriculture and Protein Demand
- Yahoo Finance - Hormel (HRL) Featured in Barclays’ Forward Look at Agriculture and Protein Demand - Yahoo Finance
- Yahoo Finance - Barclays Trims Hormel (HRL) Target as Agriculture Outlook Turns Uneven - Yahoo Finance
- The Wall Street Journal - Hormel Reports Lower Profit - WSJ
- Reuters - Hormel Foods forecasts annual profit above estimates on higher prices - Reuters
- Barchart.com - Hormel Foods (NYSE:HRL) Reports Sales Below Analyst Estimates ...
- Yahoo Finance - How HRL Is Reshaping Its Portfolio to Support Long-Term Growth
About this seasonal analysis
Seasonal pattern data is sourced from TradeWave.ai, which analyzes historical price behavior across annual calendar windows going back up to 30 years. Read the full data methodology or the book The 100-Year Pattern by Afshin Moshrefi (2026 edition). Past performance of seasonal patterns does not guarantee future results. This article is for informational purposes only and does not constitute investment advice.