Travelers Companies (The) (TRV) Has Risen in 10 of 10 Midterm Fall Windows, Averaging 8.22% Gains
Travelers Companies (The) heads into a historically strong 57-day midterm-year window with shares near record territory and another earnings test on deck.
Price as of Sep 9, 2026: $366.85 (last close).

What is the seasonal pattern for Travelers Companies (The) (TRV)?
Travelers Companies (The) has risen in 10 of 10 midterm-year Sep 12–Nov 7 windows, with an average gain of 8.22% in winning years.
- 10 for 10 in this window, with TRV posting gains every time across the last 10 midterm election years.
- Seasonal window runs from Sep 12 through Nov 7, spanning 57 calendar days late in the midterm election year.
- Percent Profitable is 100%, with 10 winners and 0 losers over the historical sample.
- Average profit in winning years is 8.22%, with a median gain of 8.4% and cumulative return of 118% when the window is stacked.
- Intraperiod swings have been meaningful, with some years seeing double-digit drawdowns before finishing higher.
- Trade Direction is long, with a TradeWave Ratio of 2.8 and a Sharpe ratio of 1.73 for this specific TRV seasonal trend.
According to historical data from TradeWave.ai, this late-midterm stretch for TRV has behaved very differently from an average autumn in the stock. The next section steps away from headlines and looks at how this Travelers Companies (The) trading window has played out across prior election cycles.
How has Travelers Companies (The) (TRV) traded in the upcoming Sep 12–Nov 7 window?
Travelers Companies (The) has finished higher in every single Sep 12–Nov 7 window across the last 10 midterm election years, averaging gains of 8.22% for long positions. Shares closed Thursday at 366.85, up 0.3% on the day and about 8.0% below the 52-week high of 398.70, after rallying 27.47% year to date.[1] Over the past three months, insiders have sold 52,667 shares worth $19.6 million, a reminder that even in a strong seasonal regime, corporate sellers have been taking profits into strength.[8]
Because this pattern is grouped by the presidential election cycle, it reflects how TRV behaves specifically in the late part of midterm election years, just before markets shift into the typically more risk-on pre-election year. For a property and casualty insurer tied to credit conditions, catastrophe seasons and corporate spending, that policy and liquidity backdrop can matter as much as company-specific news.
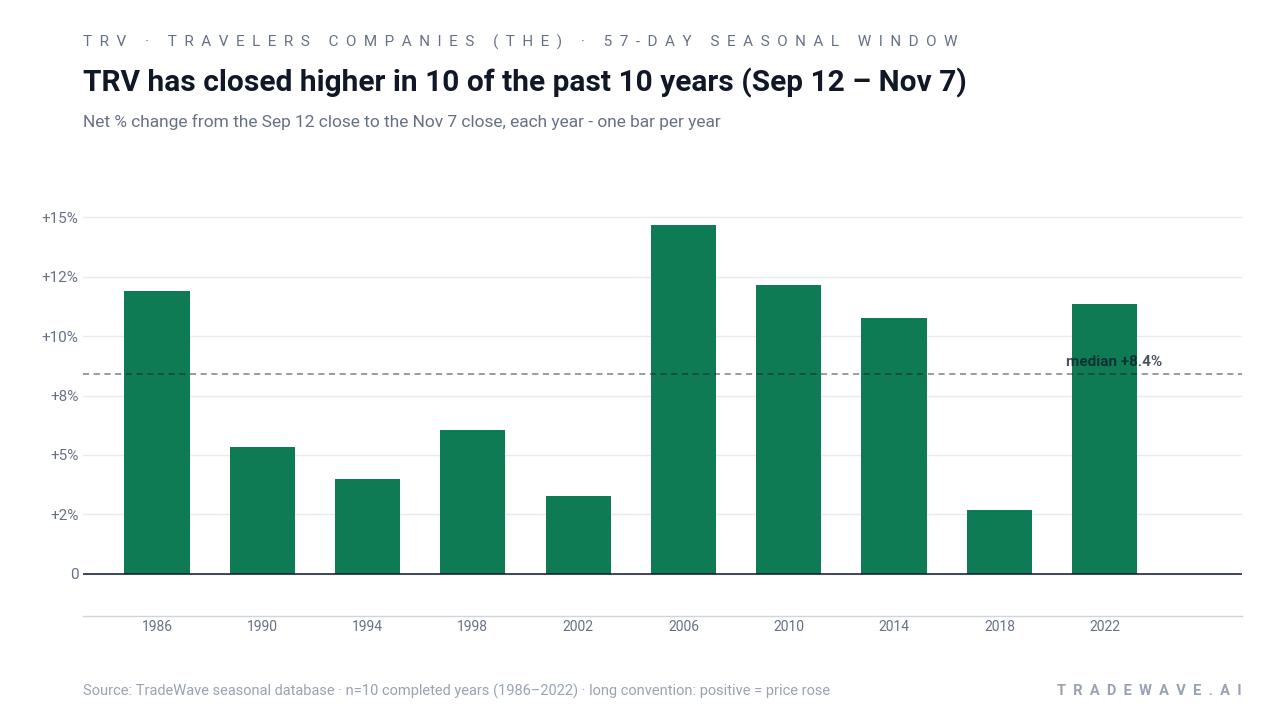
Across the 10 completed midterm-year samples since 1986, the TRV seasonal trend in this window has been consistently bullish for long exposure. Percent Profitable sits at 100%, with 10 winners and 0 losers, and the average gain of 8.22% lines up closely with the 8.4% median, suggesting the pattern is not being skewed by a single outlier year. The cumulative return from stacking this 57-day slice across cycles reaches 118%, which is a sizable contribution for a stock that investors often treat as a defensive financial name.
The per-year table shows that the strongest years in this Travelers Companies (The) trading window came in 2006, 2010 and 2022, with net returns of 14.66%, 12.17% and 11.37% respectively. Even the softest outcome, in 2018, still delivered a 2.67% gain from entry to exit. That mix points to a pattern where the downside has historically been limited to giving up some of the intraperiod rally rather than finishing the window in the red.
Intraday and intra-window volatility has still been real. In 2002, for example, TRV ultimately gained 3.27% over the window, but the worst drawdown from the entry price reached 14.64% before the stock recovered. In 1990 and 1998, the worst adverse moves were 12.36% and 10.28% respectively, even though both years finished higher. That is where the MFE/MAE profile matters: the maximum favorable move has often been in the low double digits, but the worst drawdowns have also occasionally pushed into double-digit territory.
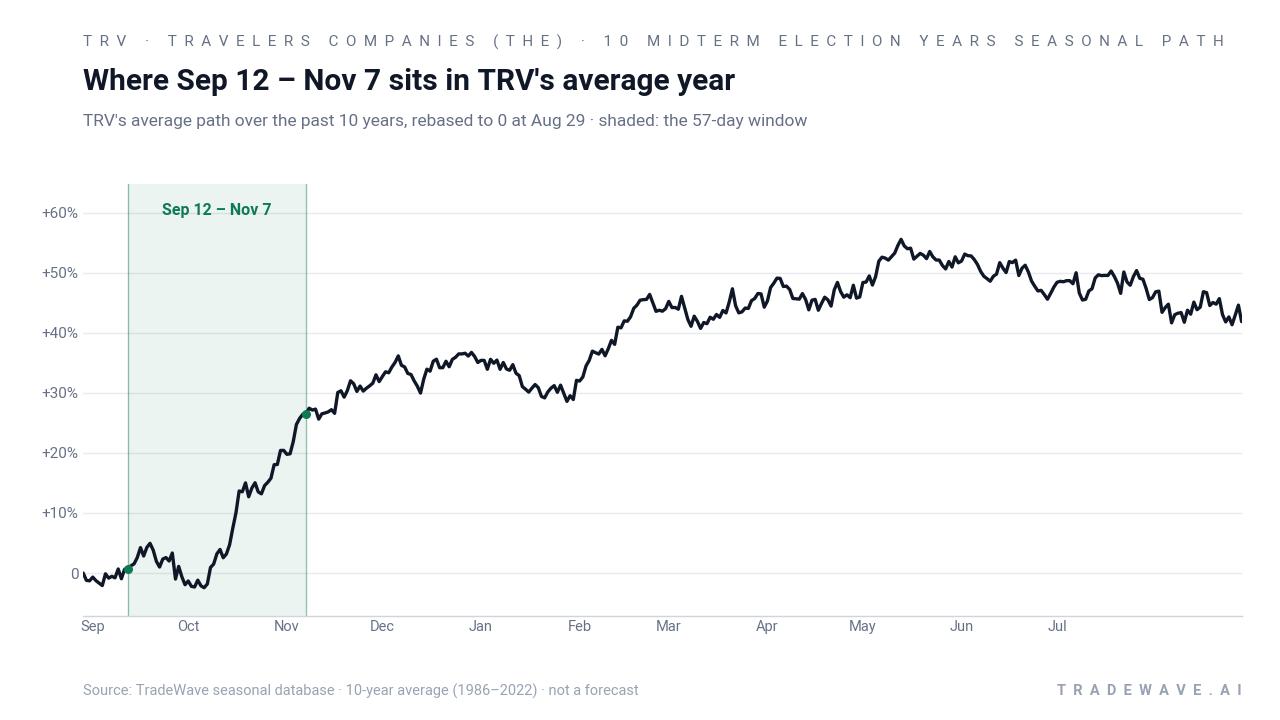
The historical seasonal average, captured in the trend chart, shows TRV typically grinding higher through this 57-day stretch rather than spiking in a single burst. Gains tend to build steadily from late September into early November, which lines up with the broader pattern of investors repositioning into financials and insurance as they look ahead to the pre-election year and the following earnings season.
A second view combines yearly net results with the full intraperiod range, from worst drawdown to best rally.
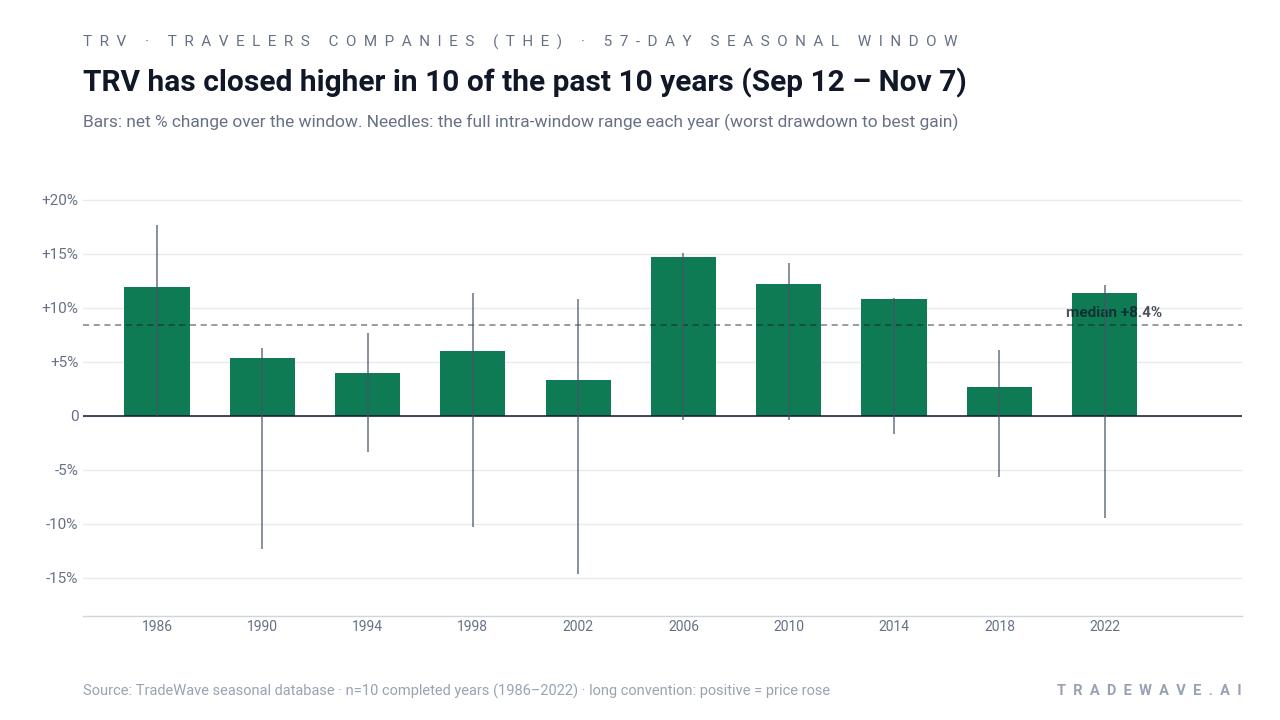
History does not guarantee future results, and even in a 10-for-10 winning window, adverse excursions can be large before the final outcome is known.
Why does Travelers Companies (The) (TRV) follow this seasonal pattern?
One likely driver is the clustering of insurance earnings and guidance updates around this part of the calendar, which can reset expectations for catastrophe losses and pricing power heading into year-end.[3][5] Analysts have also pointed to sector-wide underwriting trends and combined ratios below 90 in early 2026, which can support sentiment toward property and casualty names as investors look ahead to the pre-election year.[2] The pattern may also reflect institutional portfolio rebalancing, with financials and insurers seeing inflows as managers position for policy and rate dynamics that often stabilize late in the midterm election year.
What is driving Travelers Companies (The) (TRV) today?
TRV ended the prior session at 366.85, up 0.3% on the day, leaving the stock about 8.0% below its 52-week high of 398.70 and up 27.47% so far in 2026.[1] That move comes after a standout July quarter in which Travelers reported revenue of $10.75 billion and earnings of $2.21 billion, translating to a profit margin above 20% and quarterly EPS of $10.04 versus a $5.41 consensus estimate.[3] The next scheduled catalyst is the company’s Q2 FY26 earnings report on Oct 15, 2026, where Wall Street is looking for roughly $6.77 in EPS and full-year earnings around $28 per share.[5]
On the fundamental side, analysts tracking the property and casualty insurance sector have highlighted strong underwriting profitability, with combined ratios below 90 in early 2026, even as they flag pressure on personal lines margins and the risk of gradual underwriting margin compression.[2] That backdrop has helped support TRV’s role as a high-quality financial stock, but it also means investors are sensitive to any sign that pricing power is fading or catastrophe losses are rising into the heart of hurricane season.
From a positioning standpoint, short interest in TRV remains modest, with MarketBeat data showing a detailed but not elevated short-interest history through mid-August 2026.[7] The more notable signal has been insider behavior: MarketBeat’s Aug 29 instant alert reported that insiders sold 52,667 shares worth $19,611,829 over the prior three months, a meaningful amount of stock coming off the table into this year’s rally.[8] That selling does not automatically signal a bearish view, but it gives traders one more reason to watch how the stock behaves as it enters a historically strong seasonal window.
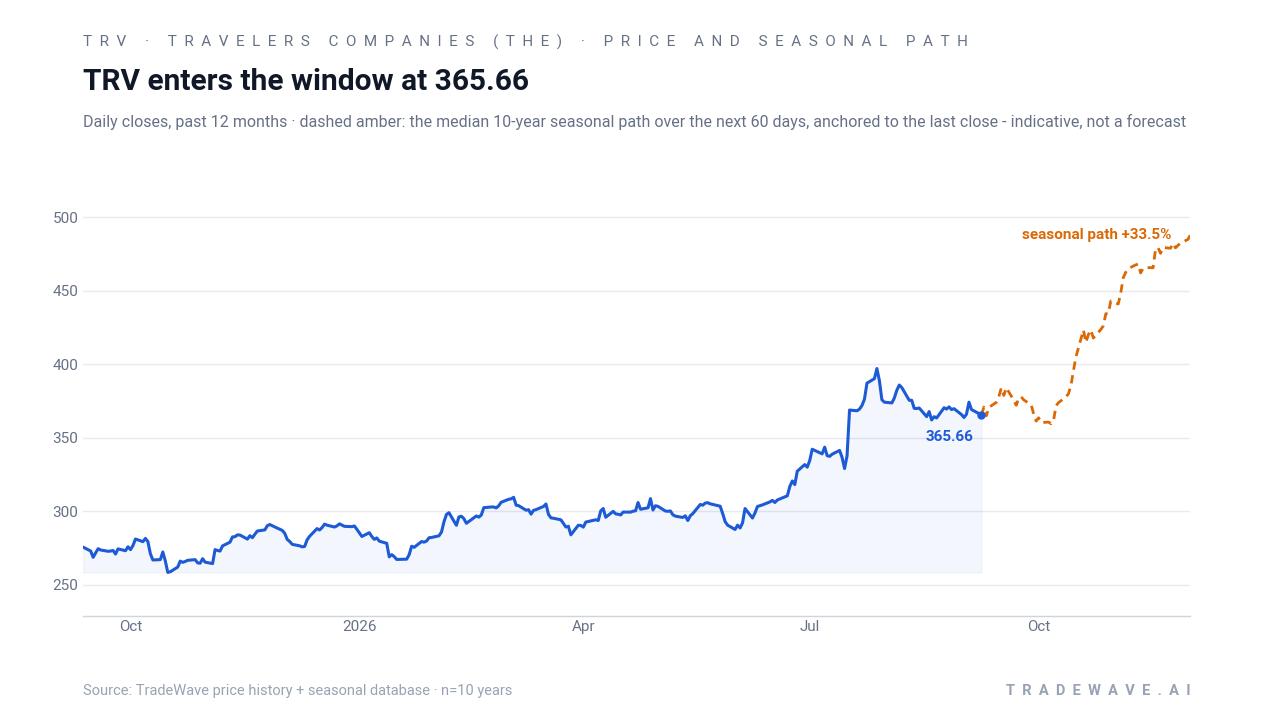
The chart below shows how TRV’s recent climb lines up with its typical seasonal path over the next two months.
What should traders watch as this TRV seasonal window opens?
First, the calendar: the 57-day window begins on Sep 12 and runs through Nov 7, overlapping both peak hurricane season and the Oct 15 earnings release. How TRV trades around that report, especially relative to the historical pattern of steady gains, will be an early tell on whether this midterm-year seasonal trend is holding or breaking.[3][5]
Second, price levels matter. With the stock roughly 8% below its 52-week high, traders will be watching whether TRV can push back toward the 390–400 area during the window or whether rallies stall well short of prior highs.[1] In past cycles, the strongest years in this pattern have seen the stock make new highs within the window, while weaker years have delivered more modest advances.
Third, sector and macro signals could either reinforce or undercut the historical seasonality. If underwriting profitability and combined ratios stay strong while rate expectations remain stable, the broader insurance sector seasonal outlook could stay supportive.[2] A surprise spike in catastrophe losses or a sharp shift in rate expectations, by contrast, would be the kind of macro shock that has historically produced the deeper intraperiod drawdowns seen in years like 1990 and 2002.
Finally, traders should keep an eye on insider and positioning trends as the window progresses. If insider selling slows or reverses while the stock tracks its typical seasonal path higher, that would align with the 10-for-10 historical record.[8] If, instead, insider sales persist and short interest begins to climb while TRV lags its usual seasonal trajectory, that divergence would be an early sign that this midterm-year playbook may not repeat as cleanly as it has in the past.[7][8]
Sources
- Yahoo Finance - The Travelers Companies, Inc. (TRV) Stock Price, News, Quote & History - Yahoo Finance
- Yahoo Finance / Associated article - Travelers (TRV) Stock Gets Fair Value Bump After Mixed Analyst Target Revisions
- MarketBeat - Travelers Companies (TRV) Stock Price, News & Analysis
- Yahoo Finance (earnings preview) - Travelers Companies Earnings Preview: What to Expect
- Zacks - What date does The Travelers Companies's (TRV) report Earnings - Earnings Calendar & Announcement
- Zacks - What is the current Price Target and Forecast for The Travelers Companies (TRV)
- MarketBeat - Travelers Companies (TRV) Short Interest & Short Float | Updated Sep 2026
- MarketBeat (instant alert) - The Travelers Companies, Inc. (NYSE:TRV) Given Average Rating ... (insider sale notice)
About this seasonal analysis
Seasonal pattern data is sourced from TradeWave.ai, which analyzes historical price behavior across annual calendar windows going back up to 30 years. Read the full data methodology or the book The 100-Year Pattern by Afshin Moshrefi (2026 edition). Past performance of seasonal patterns does not guarantee future results. This article is for informational purposes only and does not constitute investment advice.