Higher Oil Costs and Viral China Claims Threaten Kimberly-Clark (KMB) Into Bearish Fall Stretch
Kimberly-Clark is under pressure ahead of a historically weak 41-day September–October trading window, just weeks after forecast cuts and fresh margin worries.
Price as of Sep 9, 2026: $98.70 (last close).

What is the seasonal pattern for Kimberly-Clark (KMB)?
Kimberly-Clark has fallen in 8 of 10 years during this Sep 11 to Oct 21 window, with an average gain of 5.53% in winning years.
- 8 for 10 in this window, with winning years averaging 5.53% moves in the trade direction.
- Seasonal bias is short from Sep 11 through Oct 21, a 41-day stretch that has often seen KMB weaken.
- Percent Profitable is 80%, with 8 winners and 2 losers across the past decade of this window.
- Including all years, Avg Profit - All is 4%, reflecting that losing years have been smaller than the stronger winning ones.
- The TradeWave Ratio of 1.74 suggests price has typically traveled meaningfully in the short direction within the window.
- Sharpe ratio of 0.72 points to a historically favorable risk-adjusted profile for this specific short-side seasonal trend.
According to historical data from TradeWave.ai, this early fall stretch has behaved very differently from an average month for Kimberly-Clark, and the next iteration begins tomorrow.
How has Kimberly-Clark (KMB) traded in the Sep 11 to Oct 21 window?
Kimberly-Clark has closed lower in 8 of the past 10 years between Sep 11 and Oct 21, a short-biased seasonal window that has quietly added up to a 43% cumulative return for the pattern. Shares finished Thursday at $98.70, down 4.1% on the day and well below the $102.93 level where this year’s window will formally start on Sep 11. That combination of a weak tape and a historically bearish KMB seasonal trend turns a routine autumn for a consumer-staples stock into a period traders will be watching more closely.
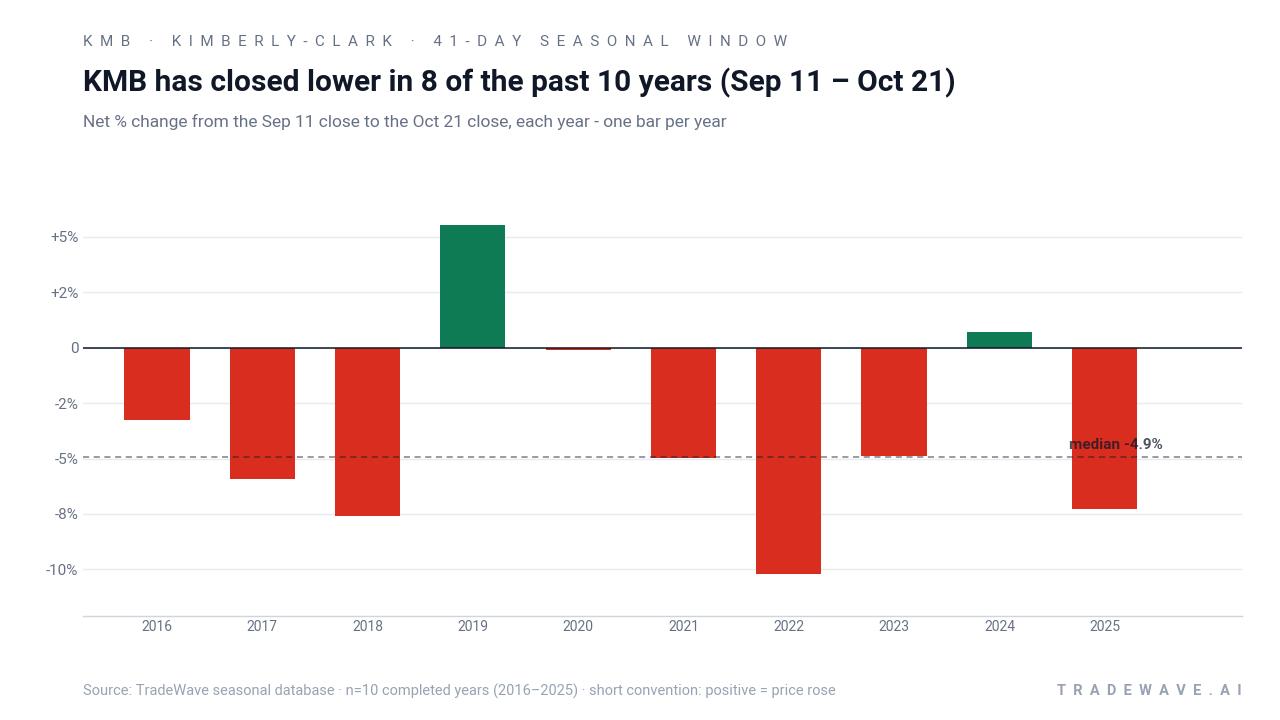
For this 41-day stretch, the trade direction is explicitly short, meaning the pattern is defined around years when KMB drifted lower rather than higher. Across the past decade, the window has been profitable for that short bias 80% of the time, with 8 winners and 2 losers. In the winning years, the average move in the trade direction was 5.53%, while including every year, winners and losers together, the Avg Profit - All comes in at 4%, which signals that the down years have tended to be larger than the occasional countertrend rallies.
The per-year breakdown shows how that plays out in practice. In 2022, for example, KMB fell 10.2% from entry to exit during this window, with the worst intraperiod drawdown from the entry level reaching 14.32% before the period ended. By contrast, 2019 was one of the rare losing years for the short pattern, with the stock rising 5.52% over the window and posting a maximum favorable move for longs of 8.79% before easing back. That mix of deep down years and a few sharp squeezes is what gives the pattern both its edge and its risk.
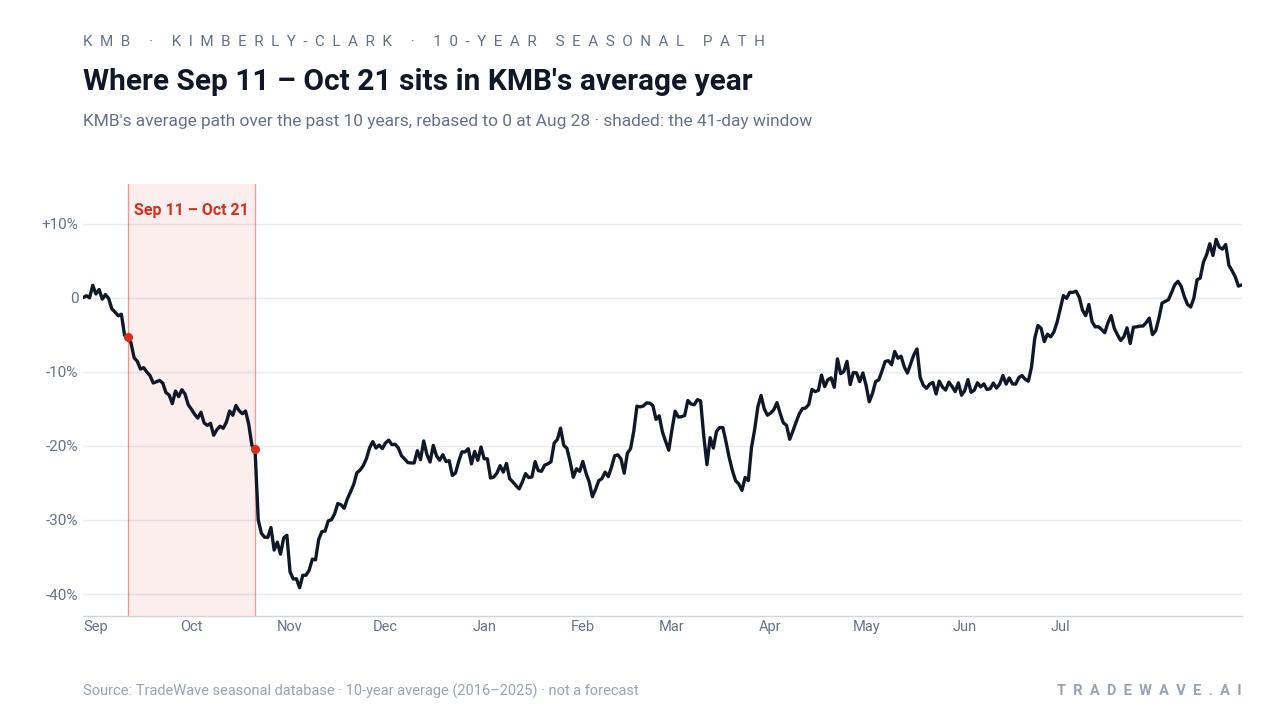
The combined net, best-case and worst-case moves by year show how far KMB has tended to swing inside this window.
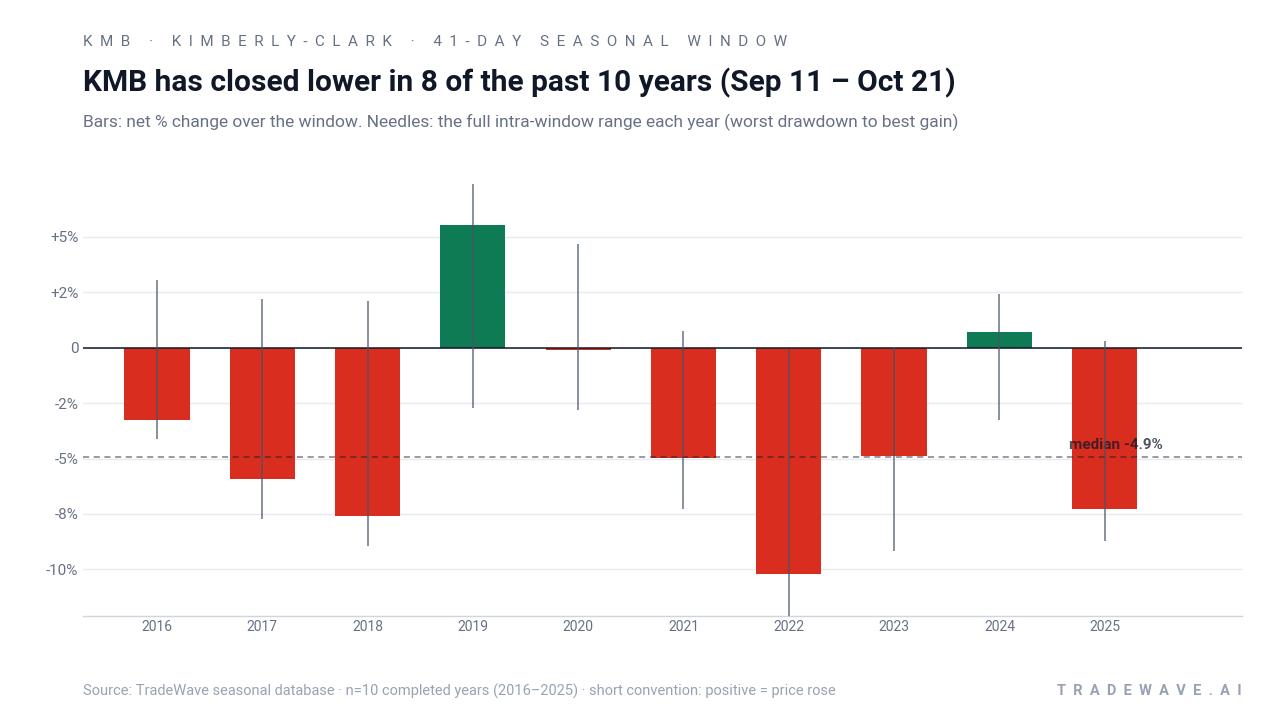
Looking across all years, the maximum favorable move in the trade direction within the window has often been larger than the final net result, which is what the TradeWave Ratio of 1.74 is flagging. In plain English, KMB has tended to travel a fair distance lower at some point during this stretch, even in years when it later bounced into the close. At the same time, the worst intraperiod drawdowns against the short side have been meaningful in a few years, especially 2019 and 2024, when the stock pushed higher before fading, so the pattern has not been a one-way street.
The cumulative chart of this seasonal trade, which compounds each year’s result, climbs to a 43% gain over the past decade. That is a strong record for a single 41-day slice of the calendar in a defensive consumer-staples name. Add it up: eight down years for KMB in this window, two up years, and a track record that has rewarded traders who respected the historical tendency toward early fall weakness.
History does not guarantee future results; adverse excursions can be large even in winning windows, and KMB has occasionally staged sharp rallies inside this pattern.
Why does Kimberly-Clark (KMB) follow this seasonal pattern?
One likely driver is the way consumer-staples portfolios are repositioned heading into year-end, as managers rotate between defensive names after the summer and before the holiday quarter. This window also sits between back-to-school demand and the build into holiday promotions, a softer stretch for categories like diapers and tissues that can leave earnings revisions and cost headlines in the driver’s seat. The pattern may also reflect how investors react to input-cost updates and guidance tweaks that often cluster in early fall for packaged-goods companies.
What is driving Kimberly-Clark (KMB) today?
Kimberly-Clark dropped 4.1% Thursday to $98.70, extending a late-summer slide that has pulled the stock well off its 52-week high of about $119.03 and left it only modestly above the 52-week low near $87.81. The move comes in the shadow of an August forecast cut, when the company lowered its annual sales and profit outlook after false social-media claims in China hit Huggies diaper demand and forced management to trim expected organic growth and EPS expansion to the high-single-digit range.[2]
In that Aug 4 update, executives said the China disruption had meaningfully reduced second-quarter sales and would temper international personal-care growth and operating profit, even as the broader household-staples backdrop remained resilient.[2] Earlier in the year, Kimberly-Clark had warned that persistently higher oil prices could add up to $170 million in extra costs in the second half of 2026, a reminder that pulp- and petrochemical-heavy product lines are exposed when energy markets stay firm.[1] Together, those pressures help explain why a stock that usually trades as a low-volatility defensive play is suddenly moving more like a cyclical name.
Sector context still matters. Demand for personal care and household staples has held up, with prior coverage highlighting steady volumes and pricing power that supported higher profit and revenue in earlier quarters, even before the latest China shock.[3] In Oct 2025, for example, Kimberly-Clark beat quarterly sales estimates as consumers kept buying household staples, underscoring that the core franchise remains intact even when one region stumbles.[4] The tension for investors is between that resilient baseline and the near-term hit from China plus higher input costs.
Positioning and insider behavior add another layer. Recent filings compiled on an insider-transactions dashboard show a mix of purchases and sales by executives and directors in 2026 and earlier, including buying by Samuel Todd Maclin and sales by Andrew Scribner and others, a pattern that suggests no single, one-way insider view but active portfolio management at the top of the company.[5] Separate commentary has pointed to elevated short interest of roughly 15% of float as of late July, framing Kimberly-Clark as a battleground stock rather than a sleepy staple, even if the exact short-interest path is harder to pin down from public snippets alone.[6]
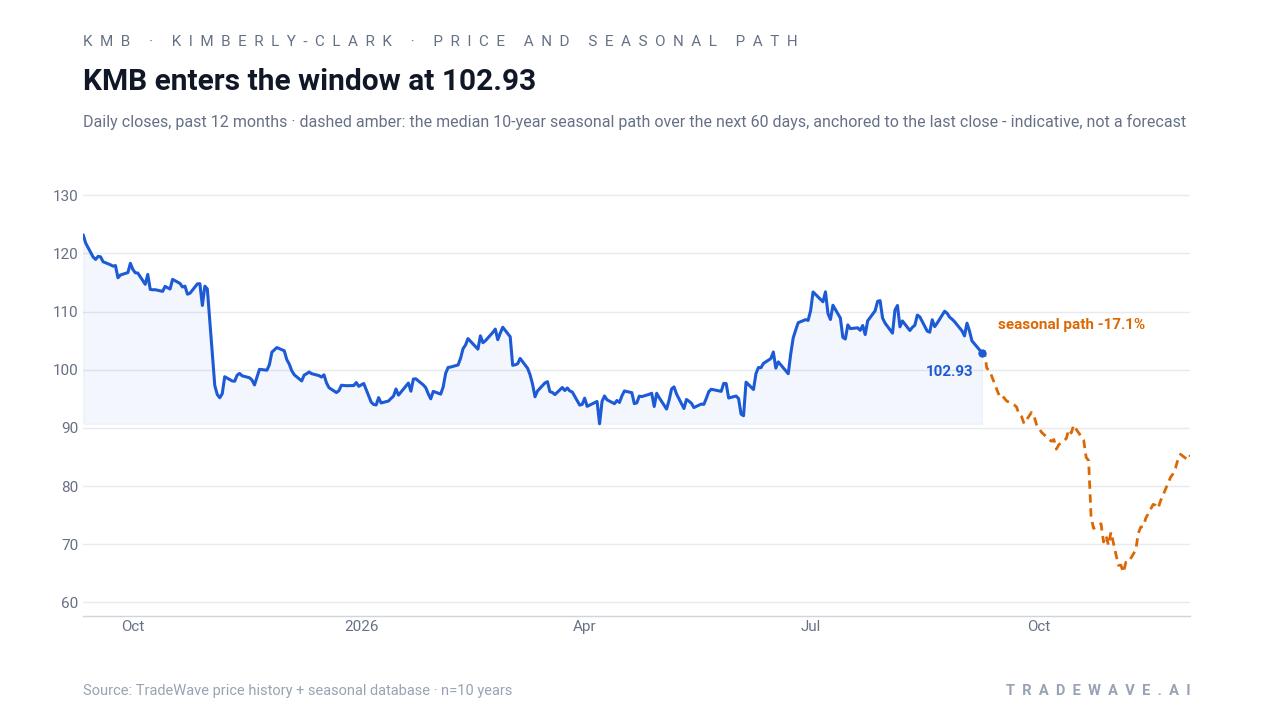
The chart below situates the latest drop against KMB’s past year of trading and the median seasonal path for the next two months.
What should traders watch in this Kimberly-Clark (KMB) window?
For the Sep 11 to Oct 21 stretch, the first thing to watch is whether KMB respects the historical pattern by drifting lower from the $102.93 entry reference or instead snaps back toward its 50-day moving average near $107.11. A sustained move back above that moving average would look more like one of the rare losing years for the short-side seasonal trade, while a grind lower toward the mid-$90s would fit the typical KMB seasonal trend.
Fundamentally, any fresh commentary on China diaper demand or signs that the viral claims are fading from consumer attention will matter, since the August forecast cut was tied directly to that disruption.[2] Updates on input costs, especially if oil prices stay elevated into the fourth quarter, could also shift how investors think about 2026 margins and whether the earlier warning about up to $170 million in extra costs proves conservative or not.[1] On the demand side, evidence that household-staples volumes remain firm would support the longer-term story even if the stock stays choppy in this window.[3][4]
On the positioning front, traders will be watching whether insider activity tilts more clearly toward net buying or selling and whether reported short interest continues to run high or starts to ease.[5][6] A build in short interest into a historically weak seasonal window could amplify downside swings, while a squeeze against shorts would look more like the 2019-style countertrend year. The key tell will be how KMB behaves around any negative headlines: if the stock shrugs them off and pushes higher, the seasonal pattern is being challenged; if it sells off quickly on modest news, history is repeating on schedule.
Sources
- Reuters - Kimberly-Clark flags potential $170 million cost impact from higher oil prices - Reuters
- Reuters - Kimberly-Clark cuts annual forecasts as China quality claims hurt diaper sales - Reuters
- The Wall Street Journal - Kimberly-Clark Posts Higher Profit and Revenue - WSJ
- Reuters - Kimberly-Clark beats quarterly sales estimates as demand holds for household staples - Reuters
- Yahoo Finance (insider transactions page) - Kimberly-Clark Corporation (KMB) Recent Insider Transactions - Yahoo Finance
- Yahoo Finance / Contributor - Jim Cramer Said Kimberly-Clark Corporation (NYSE:KMB) + Kenvue Could Take On P&G – But Is He Right?
About this seasonal analysis
Seasonal pattern data is sourced from TradeWave.ai, which analyzes historical price behavior across annual calendar windows going back up to 30 years. Read the full data methodology or the book The 100-Year Pattern by Afshin Moshrefi (2026 edition). Past performance of seasonal patterns does not guarantee future results. This article is for informational purposes only and does not constitute investment advice.