AT&T (T) Has Risen in 10 of 10 Midterm Windows From Sep 26, Averaging 15.8% Gains
AT&T is trading around $26 as it heads toward a long midterm-election seasonal window that has never been negative in the last 10 cycles, a backdrop dividend investors will be watching against rising competition and policy risk.
Price as of Sep 3, 2026: $26.19 (last close).

What is the seasonal pattern for AT&T (T)?
AT&T has risen in 10 of 10 midterm-election-year windows starting Sep 26, with an average gain of 15.81% in winning years.
- 10 for 10 in this window, with AT&T averaging 15.81% gains across all winning years over the 276-day span.
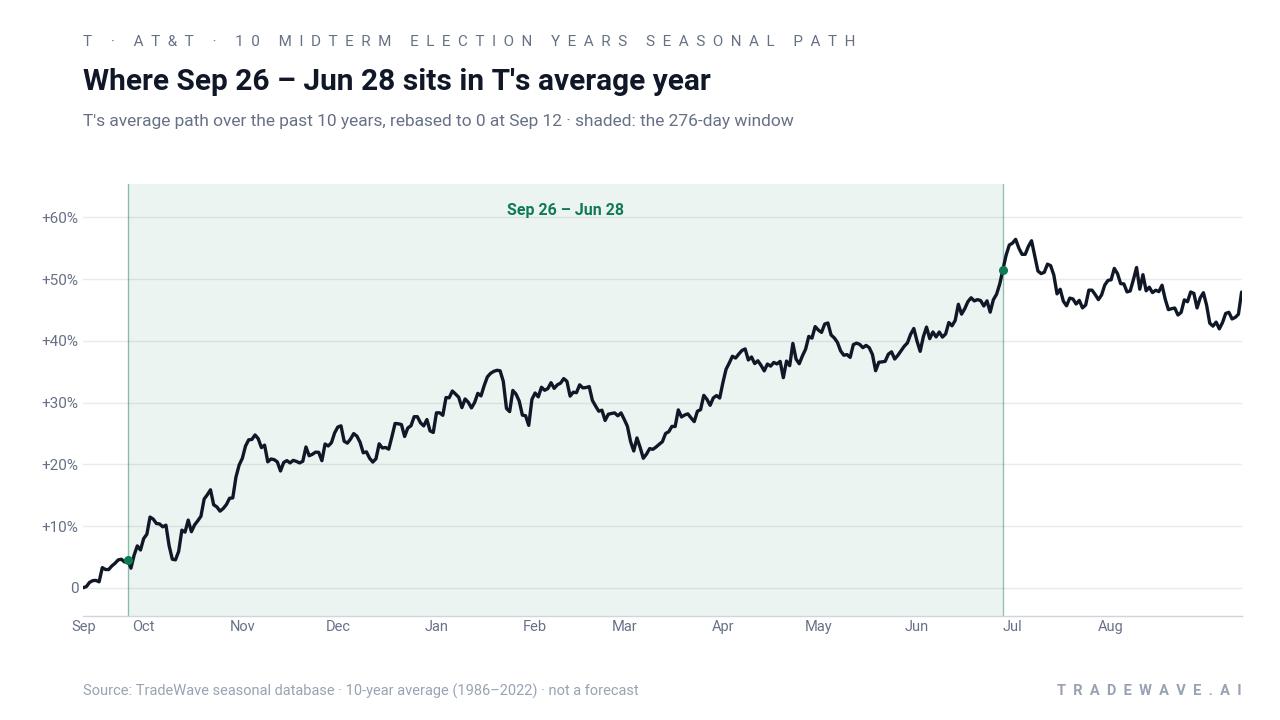
- Seasonal window runs from Sep 26 through Jun 28 in the last 10 midterm election years, aligning with the transition into the year before the presidential election.
- Percent Profitable is 100%, with 10 winners and 0 losers in the historical sample.
- Median profit of 16.06% and a Sharpe ratio of 1.56 point to a historically strong, relatively consistent long bias.
- Maximum favorable moves inside the window have reached as high as 47.02%, while the worst intraperiod drawdowns have been as deep as 18.04%.
- Stacking this AT&T trading window across the 10 midterm cycles compounds to a 324% cumulative return, highlighting how persistent the pattern has been.
According to historical data from TradeWave.ai, this midterm-election stretch has behaved very differently from an average year for AT&T, and the next iteration is less than a month away.
How has AT&T (T) traded in this midterm-year window?
AT&T has risen in 10 of the last 10 midterm-election-year windows that start on Sep 26 and run for 276 days, averaging 15.81% gains with no losing years. Shares finished the latest session at $26.19, up 0.9% on the day and about 11.0% below their 52-week high of $29.44, leaving room above if the historical pattern repeats. That combination of a clean win streak and a still-discounted price versus the past year’s peak is why this specific AT&T trading window is on seasoned telecom investors’ calendars.
Presidential election-cycle grouping matters here because this window captures the handoff from the midterm election year into the year before the presidential election, a phase when policy uncertainty often fades and risk appetite has historically improved for rate-sensitive, dividend-heavy stocks. For a balance-sheet-heavy telecom like AT&T, that backdrop can intersect with decisions on spectrum policy, broadband subsidies and capital spending, all of which tend to be shaped in the run-up to a presidential race rather than during it.
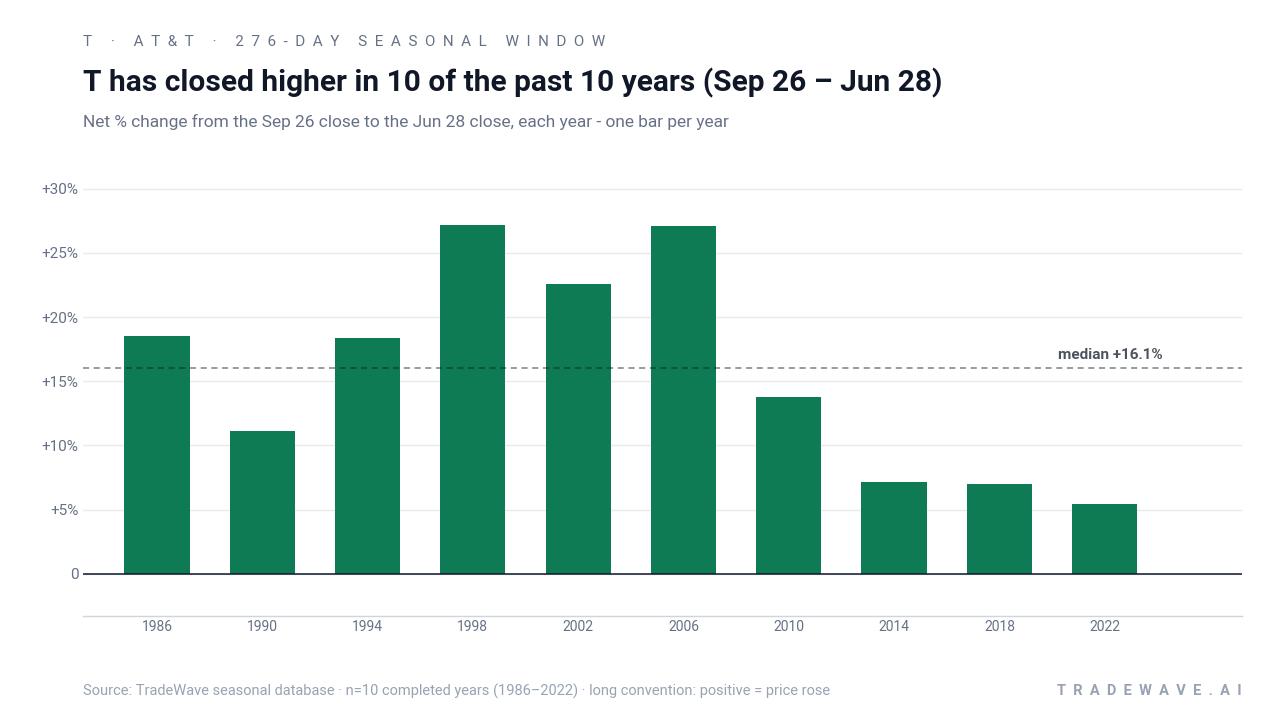
Across the 10 midterm-election-year samples from 1986 through 2022, AT&T’s strongest run in this window came in 1998, when the stock gained 27.14% between late September and late June and at one point was up 40.72% from the entry level before giving back some of that move. The weakest outcome on a closing basis was still positive, a 5.44% gain in 2022, although that year’s path was far from smooth, with the stock swinging to a 41.86% peak gain at one point and then retracing a large chunk of it before the window closed.
The intraperiod downside has been real even in winning years. In 2018, AT&T finished the window up 6.97%, but the worst drawdown from the entry price reached 18.04% before the stock recovered. In 2002, the stock ultimately gained 22.57%, yet the maximum adverse move during the window was an 11.39% drop from the starting level, a reminder that the path to those positive closes has often involved double-digit swings in both directions.
A closer look at yearly ranges shows how those gains have coexisted with sizable swings both up and down inside the window.
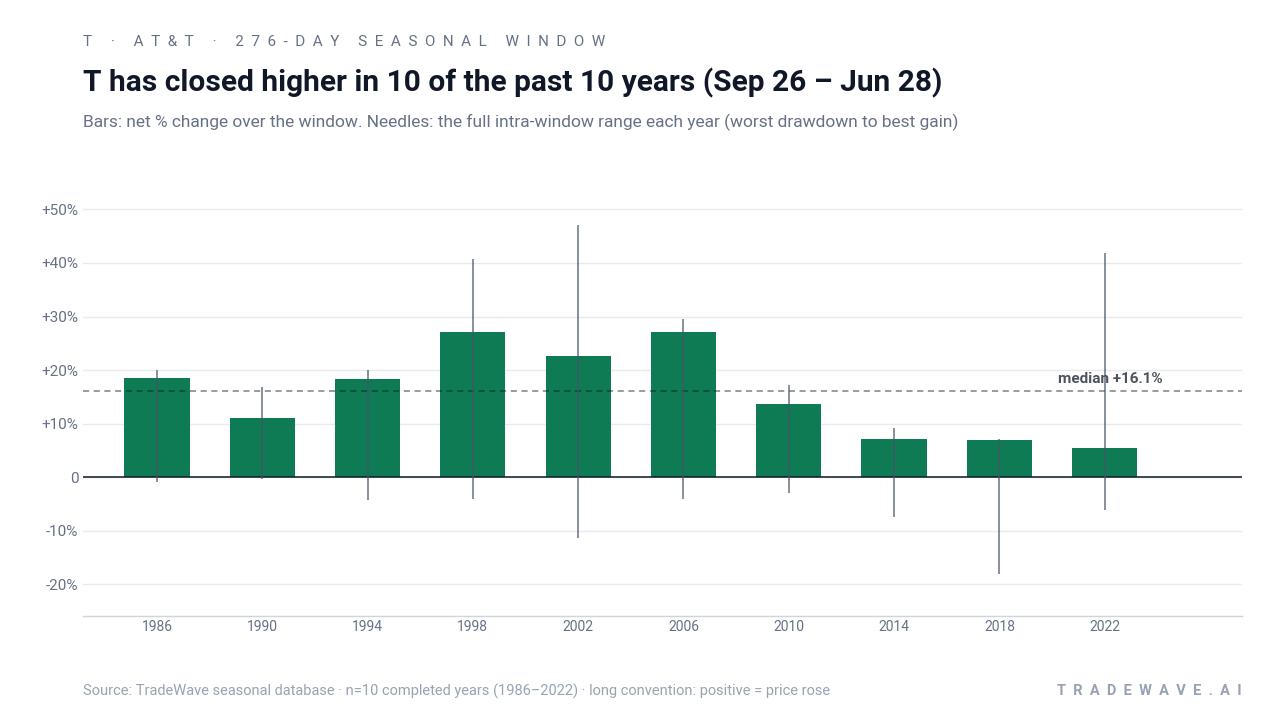
Put together, the pattern is striking: 10 for 10 positive closes, mid-teens average gains and a long bias that has persisted across very different macro backdrops.
Why does AT&T (T) follow this seasonal pattern?
One likely driver is the way telecom capital spending, spectrum auctions and broadband policy tend to cluster around the midterm-to-pre-election transition, when Congress and regulators often finalize funding and rules ahead of a presidential race. Analysts have also pointed to institutional portfolio rebalancing into high-yield, defensive names like AT&T as rate expectations and fiscal priorities become clearer in the year before the election.[7] The result is a window where policy clarity and income demand may have historically lined up in AT&T’s favor more often than not.
History does not guarantee future results; adverse excursions can be large even in winning windows, and investors should treat the pattern as context rather than a forecast.
What is driving AT&T (T) today?
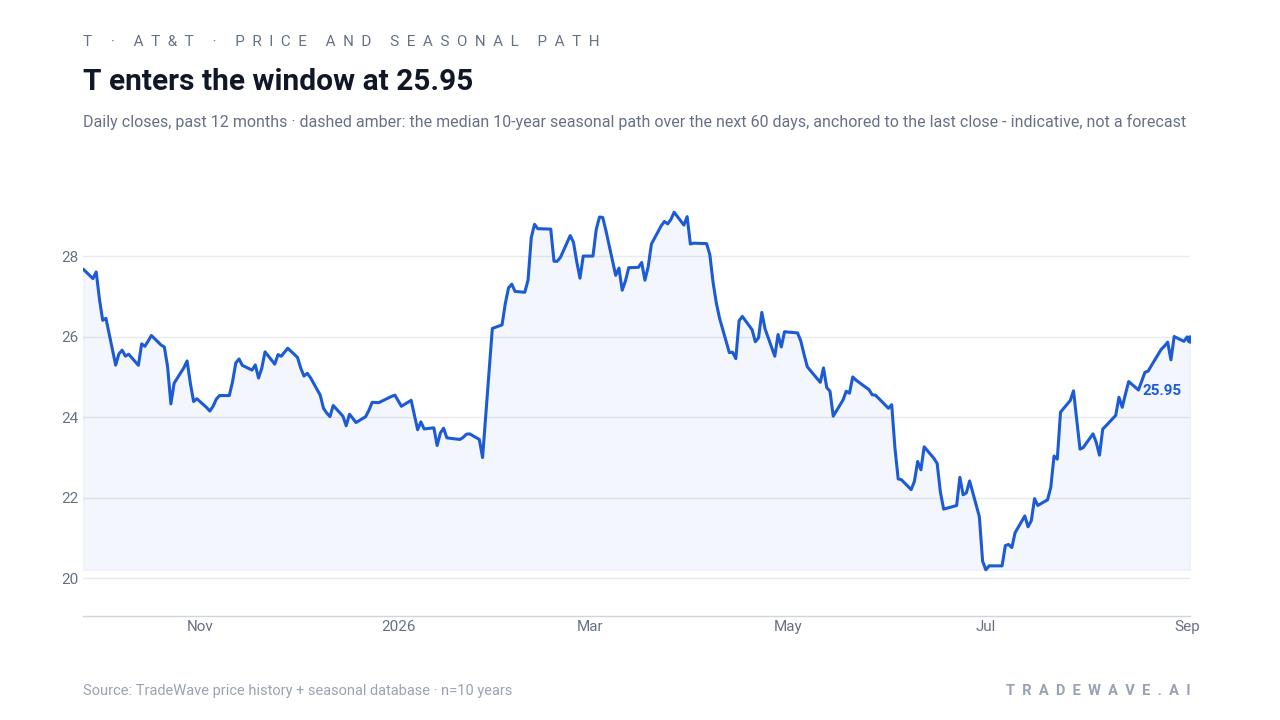
AT&T closed Friday at $26.19, up 0.24 on the day, after a strong late-summer run that has lifted the stock 12.53% over the past month and left it about 35.2% above its 52-week low near $19.37. The move builds on a July earnings beat that helped ease investor worries about competition from SpaceX’s Starlink and showed wireless and fiber trends holding up better than feared.[3] In the same mid-2026 period, commentary has highlighted AT&T’s role as a high-yield, cash-flow story rather than a pure growth play, with debate centering on how much upside remains after the rebound and how sustainable the dividend looks against capital spending needs.[7]
The chart below situates the latest move in its recent multi-month context alongside the median seasonal path.
Fundamentally, the story has been about execution in wireless and fiber against a noisy competitive backdrop. In July 2026, Barron’s reported that AT&T topped Q2 earnings estimates, with management pointing to steady subscriber trends even as investors fretted about Starlink’s potential to disrupt rural broadband and enterprise connectivity.[3] Earlier, in Oct 2025, Reuters noted that bundled plans and iPhone promotions helped AT&T add 405,000 postpaid wireless subscribers, reinforcing the idea that the company can still buy growth with the right offers even in a mature market.[4]
On the positioning side, institutional flows have been active. On Sep 3, 2026, MarketBeat highlighted filings showing Wellington Management Group LLP selling 1,790,203 AT&T shares while Quantitative Investment Management LLC added to its stake, a reminder that large holders are still reshuffling exposure even after the stock’s rebound.[6] That kind of cross-current in big money ownership can amplify volatility around key macro and policy dates, especially for a stock that many investors treat as a bond proxy.
What should traders watch as this AT&T window opens?
Three things stand out as the Sep 26 window approaches. First, watch how AT&T behaves if it retests the low-to-mid $20s; in prior midterm cycles, the stock has often seen meaningful drawdowns early in the window before the longer seasonal trend reasserted itself. Second, keep an eye on the policy calendar around broadband funding, spectrum decisions and any fresh signals on competition from low-earth-orbit satellite providers, since those headlines have repeatedly shaped sentiment in this sector.[3]
Third, monitor institutional positioning as disclosed in 13F filings and summarized by outlets like MarketBeat to see whether the recent mix of selling by some large managers and buying by others persists or flips.[6] If selling pressure from long-term holders accelerates into the window, that would run against the historical midterm-year pattern and could blunt its impact; if instead demand from yield-focused and quantitative funds builds on dips, it would rhyme more closely with the 10-for-10 record that has defined this AT&T seasonal stretch so far.
Sources
- Yahoo Finance - This Dividend Giant Yielding 4.5% Is Wall Street’s Top Telecom Pick for 2026 - Yahoo Finance
- CNBC - AT&T is a buy after a recent pullback, says KeyBanc - CNBC
- Barron's (Dow Jones) - AT&T Stock Rises as Earnings Beat Helps Ease SpaceX Fears - Barron's
- Reuters - AT&T tops subscriber estimates as bundled plans, iPhone promotions lift sales - Reuters
- Forbes (Dividend Channel) - Relative Strength Alert For AT&T - Forbes
- MarketBeat - Wellington Management Group LLP Sells 1,790,203 Shares of AT&T Inc. $T
- Seeking Alpha - AT&T And Its Real Value (NYSE:T) - Seeking Alpha
- Barchart - Are Wall Street Analysts Predicting AT&T Stock Will Climb or Sink?
About this seasonal analysis
Seasonal pattern data is sourced from TradeWave.ai, which analyzes historical price behavior across annual calendar windows going back up to 30 years. Read the full data methodology or the book The 100-Year Pattern by Afshin Moshrefi (2026 edition). Past performance of seasonal patterns does not guarantee future results. This article is for informational purposes only and does not constitute investment advice.