Near 52-Week Highs, Keurig Dr Pepper (KDP) Enters a 100% Bearish Late-September Window for Shorts
Keurig Dr Pepper is heading into a 23-day late-September seasonal window that has been consistently weak for the stock, just as shares trade near 52-week highs after a strong year for sodas and energy drinks.
Price as of Sep 9, 2026: $32.08 (last close).

What is the seasonal pattern for Keurig Dr Pepper (KDP)?
Keurig Dr Pepper has fallen in 10 of 10 years during the Sep 11 to Oct 3 window, with an average gain for short positions of 3.74% in winning years.
- 10 for 10 in this window, with short trades averaging 3.74% profit across winning years over the past decade.
- The upcoming seasonal window runs from Sep 11 to Oct 3 and has historically been a bearish stretch for KDP’s share price.
- Percent Profitable is 100%, with 10 winners and 0 losers for the short-side pattern in this late-September trading window.
- Average median move is a 4.15% gain for shorts, while the cumulative return from repeating the setup each year totals 44%.
- The TradeWave Ratio of 1.83 suggests price has typically traveled meaningfully in the trade direction within the window, even before final closes.
- Intraperiod swings have included sizable drawdowns and rallies, so the window has combined consistent direction with real volatility.
According to historical data from TradeWave.ai, this late-September stretch has behaved very differently from an average month for KDP. The next section walks through how that pattern has played out and where it sits against today’s backdrop.
How has Keurig Dr Pepper (KDP) traded in the Sep 11 to Oct 3 window?
Keurig Dr Pepper has closed lower in this Sep 11 to Oct 3 window in every one of the past 10 years, with short positions posting an average profit of 3.74%. The new 23-day window opens tomorrow with KDP at $32.08, about 5.1% below its 52-week high of $33.82 and still well above its 52-week low near $23.85.
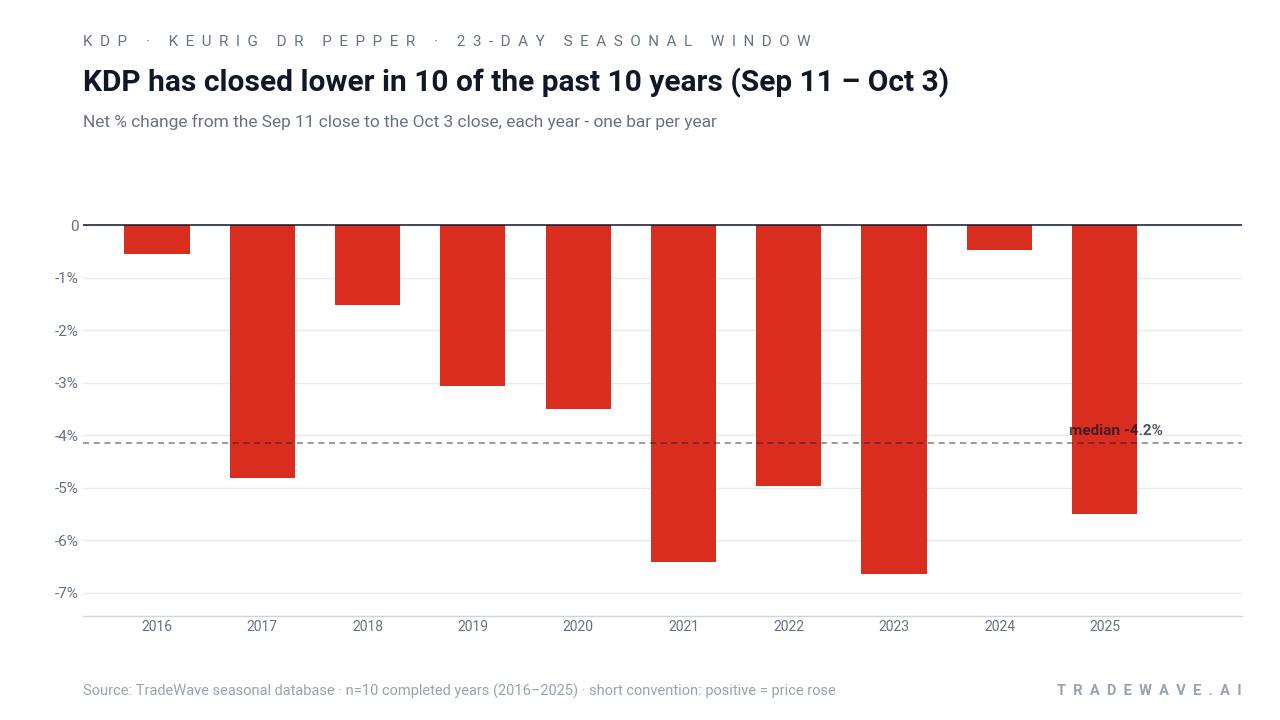
Because the trade direction is short, negative net returns in the per-year table represent profitable years for the pattern. Across 2016 to 2025, every iteration finished with KDP below its Sep 11 entry level, from a relatively mild 0.47% drop in 2024 to a 6.64% slide in 2023. The median outcome sits at a 4.15% gain for shorts, which lines up with the idea that this is not just a coin-flip stretch but a consistently weak late-September pocket for the stock.
The intraperiod path has not been one-way. In several years, such as 2018 and 2024, the stock saw maximum favorable moves for longs of more than 3% to 5% at some point inside the window before rolling over by the close. On the downside, the worst drawdowns from the short entry have reached roughly 7% to 8% in years like 2021, 2022 and 2025, showing that even in winning years for the pattern, shorts have had to sit through meaningful squeezes.
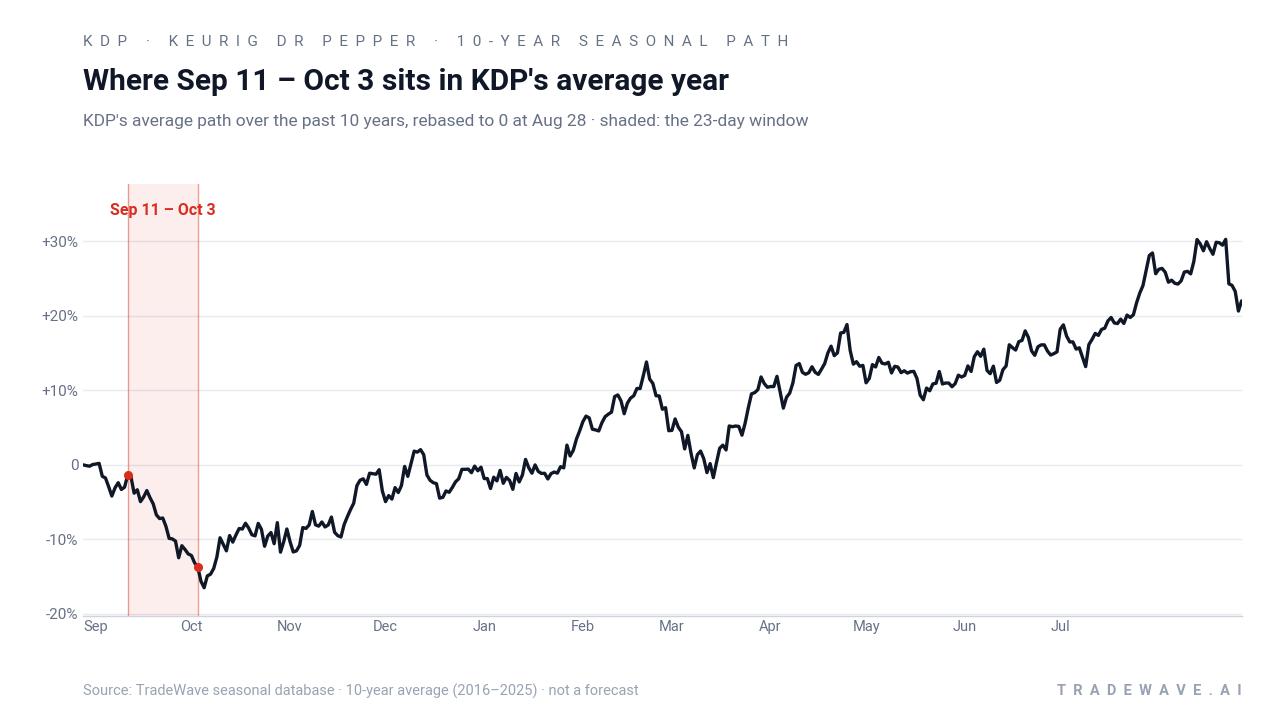
A second view that stacks net moves with intraperiod ranges shows how much KDP has typically swung inside this window.
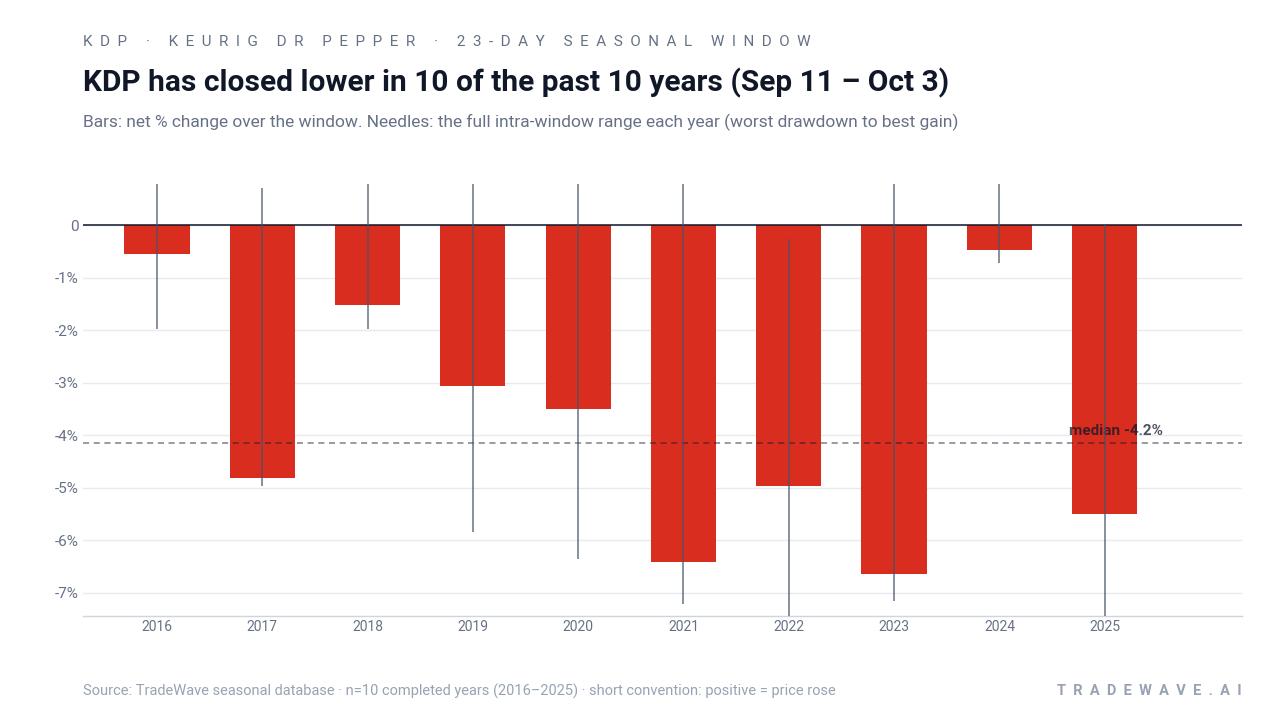
Viewed through that lens, the pattern looks like a grind lower with noise. Maximum favorable excursions for shorts have often extended beyond the final net move, while maximum adverse excursions have at times nearly erased the edge before the stock rolled back over. Add it up and repeating the setup each year would have compounded to a 44% gain for the short strategy across the decade, with a Sharpe ratio of 1.52 that reflects a relatively strong risk-adjusted profile for a 23-day trade.
History does not guarantee future results, and the worst intraperiod drawdowns have been large enough that even a window with a perfect record has carried real risk for anyone leaning into it.
Why does Keurig Dr Pepper (KDP) follow this seasonal pattern?
One likely driver is the way consumer-beverage names trade around late-summer and early-fall portfolio rebalancing, when managers often rotate out of defensives that have worked earlier in the year. This window also sits between major earnings updates for KDP, which can leave the stock more exposed to macro and sector flows than to company-specific news. The pattern may reflect a mix of profit-taking after summer strength and positioning ahead of holiday-season demand commentary.
What is driving Keurig Dr Pepper (KDP) today?
Keurig Dr Pepper slipped 1.4% to $32.08 on Thursday, pulling back from a recent 52-week high of $33.82 but still trading comfortably above its 50-day moving average of $31.27 and its 52-week low near $23.85. The stock has been supported by a run of strong results in its core U.S. refreshment beverages business, where demand for brands such as Dr Pepper and energy drinks has offset a softer coffee segment.[1]
On Aug 6, 2026, the company beat second-quarter sales and adjusted earnings estimates, posting net sales of $7.31 billion against expectations of $7.24 billion and adjusted EPS of $0.57 versus $0.54, and it reaffirmed its full-year 2026 outlook.[1] Earlier in the year on Feb 24, 2026, management guided for 2026 net sales of $25.9 billion to $26.4 billion and low double-digit adjusted EPS growth, citing resilient demand for sodas and energy drinks even as coffee lagged.[2] In Feb 2026, The Wall Street Journal also reported that KDP swung to a profit of $353 million from a loss a year earlier, helped by higher prices across its beverage portfolio.[3]
Those fundamentals sit on top of a bigger balance-sheet and strategy shift that began in Oct 2025, when KDP raised about $7 billion to finance its acquisition of JDE Peet’s and lifted its 2025 sales forecast to high-single-digit growth.[4] That deal increased the company’s exposure to global coffee at a time when high coffee prices, driven by droughts in Brazil and Vietnam and tariffs, were already a concern for investors, adding another macro lever to how the stock trades around seasonal windows.[4]
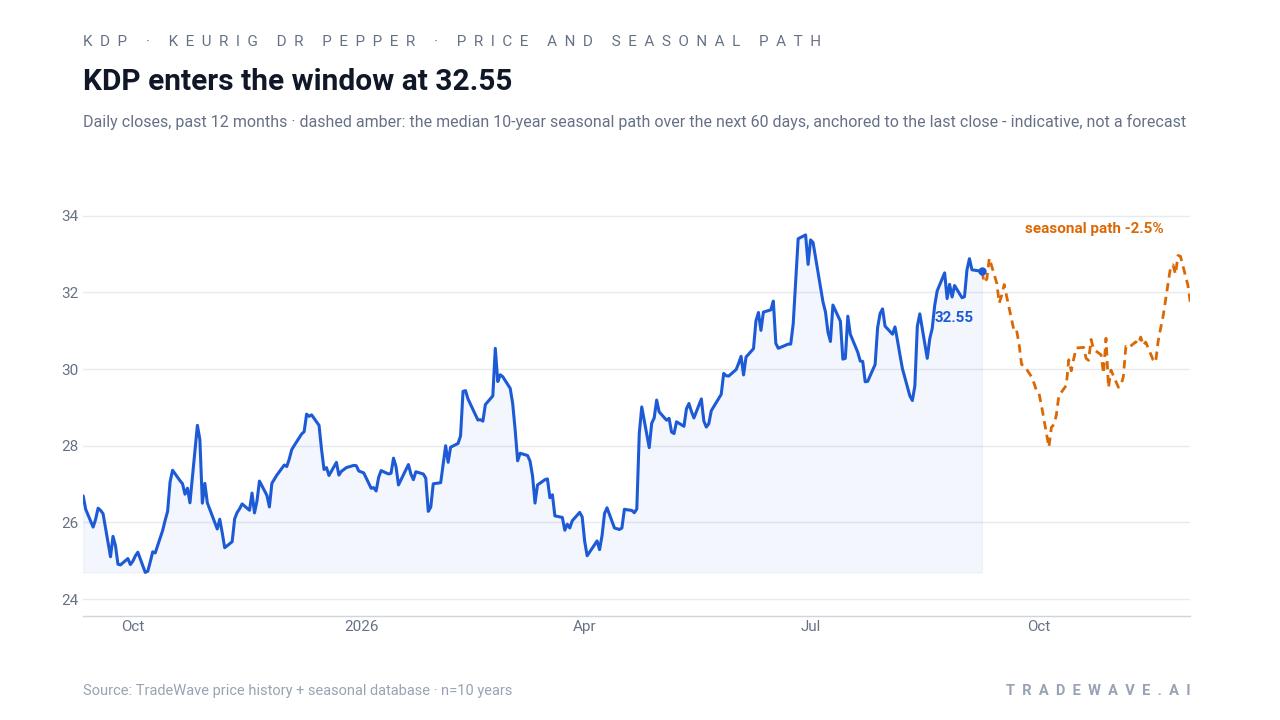
The chart below shows how KDP’s latest pullback fits into its 12-month trend, alongside the median 10-year seasonal path for the next two months.
Sources
- Reuters - Keurig Dr Pepper reaffirms forecast on strong soda, energy drink demand - Reuters
- Reuters - Keurig Dr Pepper forecasts strong annual results on resilient demand for sodas - Reuters
- The Wall Street Journal - Keurig Dr Pepper Sales Rise on Higher Prices - WSJ
- Reuters - Keurig Dr Pepper raises annual sales forecast on strong beverage demand - Reuters
About this seasonal analysis
Seasonal pattern data is sourced from TradeWave.ai, which analyzes historical price behavior across annual calendar windows going back up to 30 years. Read the full data methodology or the book The 100-Year Pattern by Afshin Moshrefi (2026 edition). Past performance of seasonal patterns does not guarantee future results. This article is for informational purposes only and does not constitute investment advice.