IBM Nears Historically Strong Oct-Apr Seasonal Rally Window
IBM is approaching a historically strong Oct 10–Apr 9 seasonal window just months after a 25% summer crash, with the stock already up sharply year to date and options volatility still elevated.
Price as of Sep 9, 2026: $239.94 (last close).

What is the seasonal pattern for IBM (IBM)?
IBM has risen in 14 of 15 years during this Oct 10–Apr 9 midterm-year window, with an average gain of 22.33% in winning years.
- 14 for 15 in this window, averaging 22.33% gains in winning years across the last 15 midterm election years.
- Percent Profitable is 93%, with 14 winners and just 1 loser in the sample.
- Avg Profit - All, which includes the lone losing year, still comes in at a strong 20%.
- The worst losing year saw an 11.47% drop, while several winning years posted gains above 30%.
- TradeWave Ratio (TWR) of 1.65 and a Sharpe ratio of 1.25 point to a historically favorable long setup in this IBM trading window.
- The 182-day stretch from Oct 10 to Apr 9 has been one of IBM’s most consistently bullish seasonal patterns in the election-cycle framework.
According to historical data from TradeWave.ai, this upcoming midterm-year fall–spring stretch has behaved very differently from an average half-year for IBM, with a distinct long-side bias that shows up repeatedly across cycles.
How has IBM (IBM) traded in past Oct–Apr midterm-year windows?
IBM has closed higher in 14 of the past 15 midterm election years during the Oct 10 to Apr 9 window, with average gains of 22.33% in the winning years and a 20% average when every year is included. The next iteration of this 182-day seasonal window begins on Oct 10, 2026, with the stock currently around $239.94 and up roughly 32% year to date. That combination of a strong IBM seasonal trend and a powerful price recovery after a historic summer crash gives this particular window more weight than a typical calendar pattern.
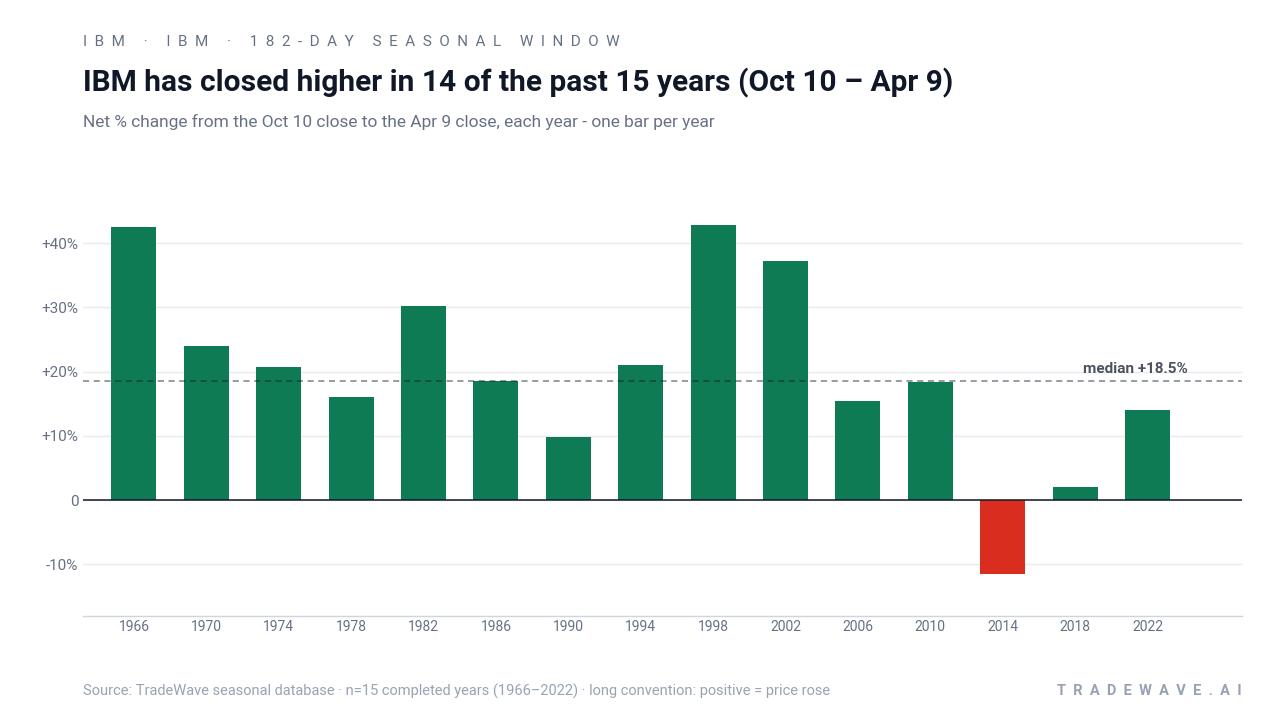
The election-cycle lens matters here because this IBM trading window is built only from midterm election years, then lined up with the transition into the year before the presidential election. That is typically when fiscal and regulatory visibility improves, corporate IT budgets reset, and risk appetite in large-cap tech often shifts from defense to offense.
Across the 15 midterm-year samples, the long trade direction has been clearly favored. Percent Profitable sits at 93%, with 14 winners and just 1 loser, and the median profit of 18.47% shows that gains have not been driven by a single outlier year. The lone down year, 2014, saw an 11.47% loss over the window, which is meaningful but still small relative to the strongest up years that cleared 30% returns.
Average profit in the winning years is 22.33%, while Avg Profit - All, which includes that 2014 loss, is still a robust 20%. That gap between winners-only and all-years averages is modest, which tells you the IBM seasonal trend has been both strong and relatively consistent rather than a lottery-ticket pattern. The cumulative return from stacking this Oct–Apr window across the 15 midterm election years reaches 1,298%, a reminder of how powerful a single recurring slice of the calendar can be when it lines up with the broader presidential cycle.
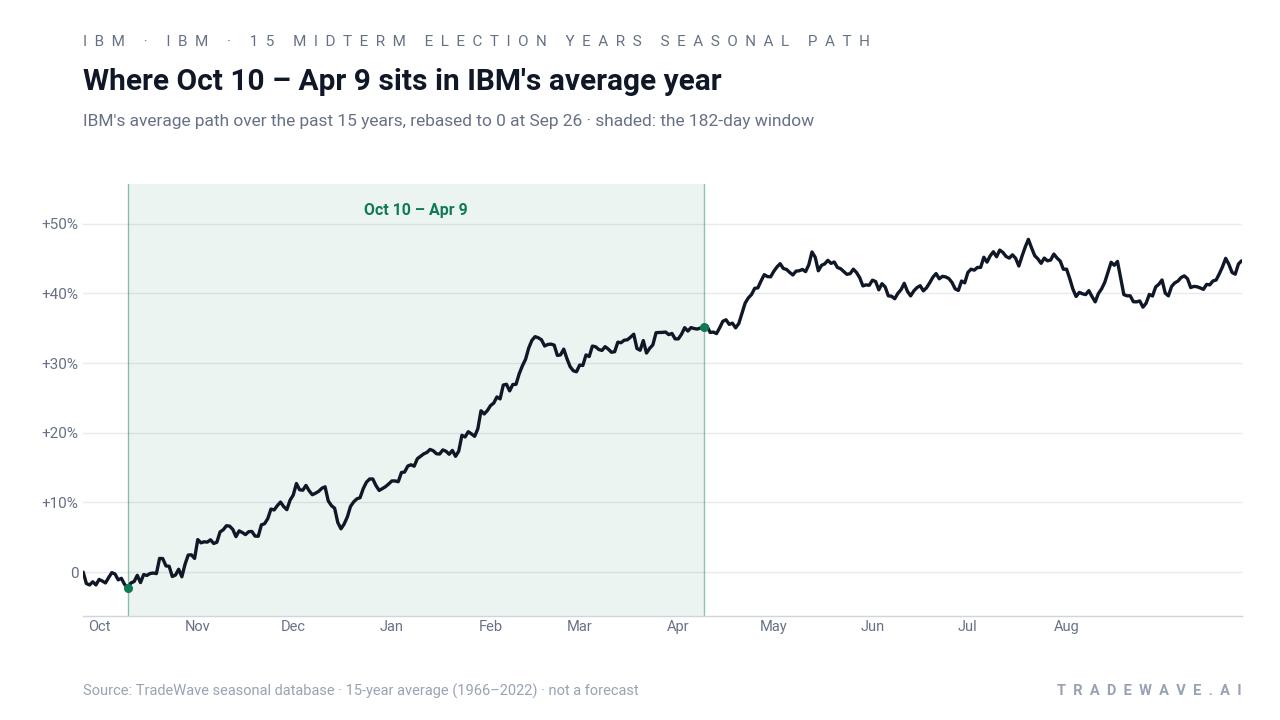
The historical seasonal average suggests that IBM’s typical year in this window starts with a firming phase in late October and November, then sees gains compound through the winter before flattening out closer to April. That shape fits a story of budget flush, year-end positioning, and early-year follow-through as CIOs lock in spending on software, services and infrastructure.
Yearly net and intra-window swings show how upside and downside have coexisted inside this bullish pattern.
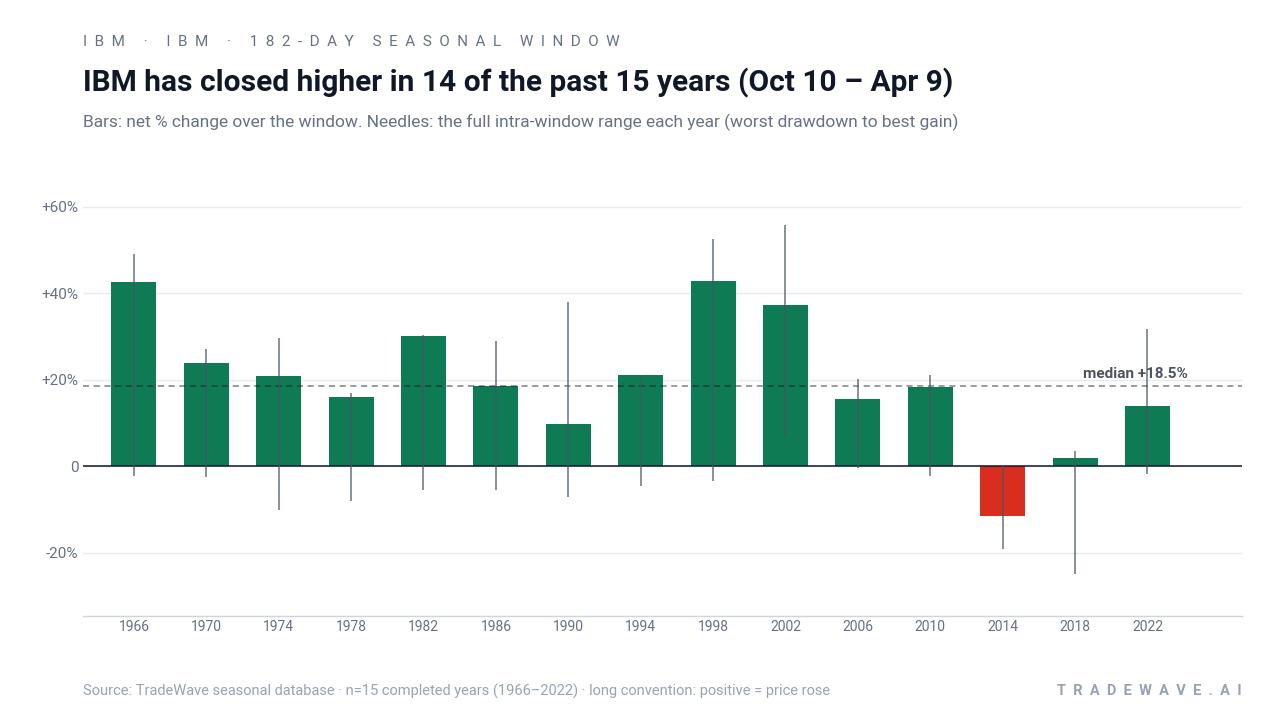
The combined net / maximum favorable move / maximum adverse move view shows that even in strong years, IBM has often experienced meaningful drawdowns inside the window before finishing higher. In 2018, for example, the net gain was just 2.04%, but the worst intra-window drawdown reached 24.81%, while 1998 and 2002 saw net gains above 37% with maximum favorable excursions above 50%. That mix of large positive swings and occasional deep pullbacks is exactly what the TradeWave Ratio of 1.65 and Sharpe ratio of 1.25 are capturing: a long-biased window with real volatility along the way.
History does not guarantee future results; adverse excursions can be large even in winning windows, and MAE in prior years shows that drawdowns inside the pattern have sometimes been sharp.
Why does IBM (IBM) follow this seasonal pattern?
One likely driver is the way IBM’s enterprise customers set and deploy IT budgets around the fiscal year-end, which tends to cluster large software and services deals in late Q4 and early Q1. Analysts have also pointed to institutional portfolio rebalancing and sector rotation into quality tech as the midterm election year wraps up and policy visibility improves, which can favor a defensive, cash-generative name like IBM.[5] The pattern may also reflect recurring timing of IBM’s own product cycles and mainframe refreshes, which often land in the back half of the year and feed into early-year revenue recognition.
What is driving IBM (IBM) today?
IBM shares closed around $239.94 on Sep 10, up 3.4% on the day and roughly 32% year to date, as the stock continues to stabilize after a brutal summer slide. In mid-July 2026, IBM shocked investors with a Q2 earnings warning that flagged weaker demand for legacy software and mainframes as customers shifted spending toward AI servers and memory, triggering an intraday collapse of about 25% in the stock price.[2] Follow-up coverage in late July and August detailed how management cut its revenue outlook and how Wall Street scrambled to reassess IBM’s AI transition story and margin profile.[5][7][8]
That crash also rewired IBM’s options market. On Jul 15, 2026, CNBC described a “historic IBM stock crash” that set up aggressive options strategies, with traders leaning into elevated implied volatility and wide strike ranges around the new, lower price base.[9] Options data providers have since highlighted heavy activity and rich premiums in IBM contracts, giving traders more tools to express views on whether the stock can rebuild its AI narrative or remains a value trap.[10] Add it up and IBM is heading into this historically strong seasonal window with a bruised chart, a still-uncertain demand mix, and an options market that is anything but sleepy.
The chart below shows IBM’s volatile year, along with a 60-day seasonal projection overlay for context.
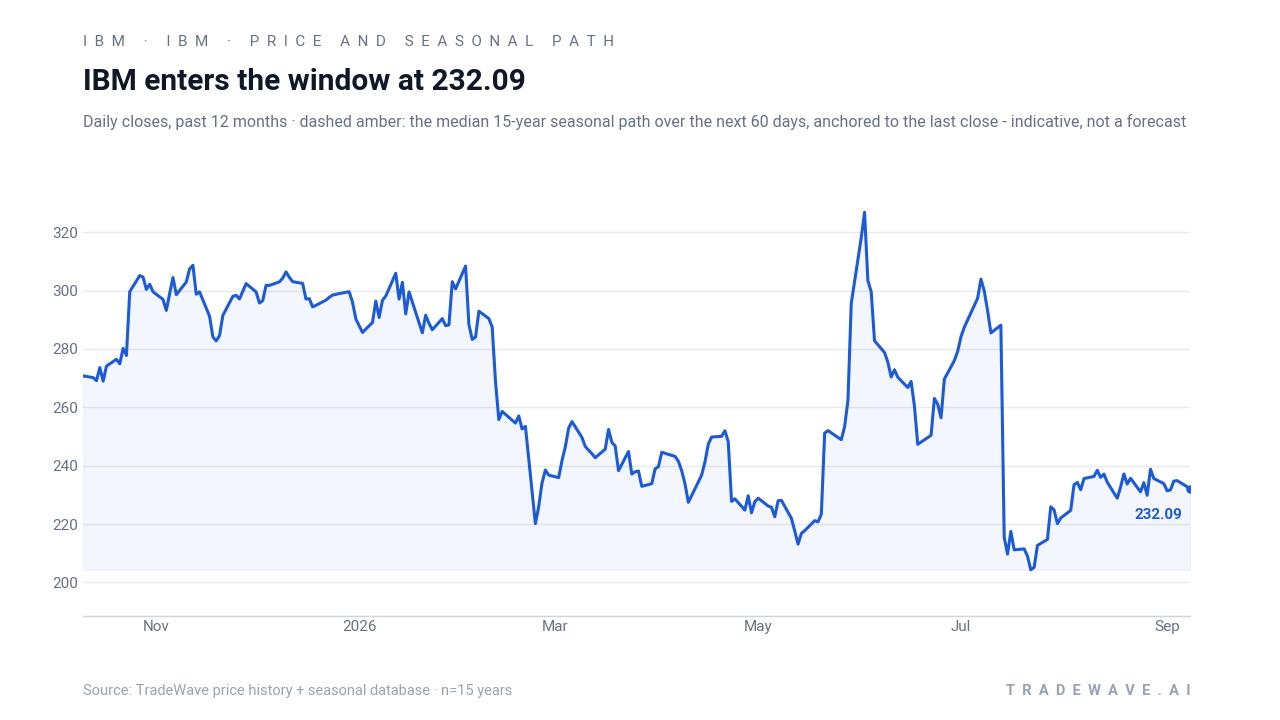
Fundamentally, IBM is still trying to prove that its AI push can offset pressure in older businesses. In July 2026, management blamed a global memory shortage and a rapid capex pivot toward servers, storage and memory for part of the revenue shortfall, underscoring how exposed IBM is to shifting infrastructure priorities.[2] Earlier coverage in 2025 had highlighted strong demand for enterprise AI platforms like WatsonX and partnerships such as the Anthropic integration, which helped drive revenue growth and optimism about IBM’s role in the AI stack.[4] The tension between those two narratives is the backdrop for this year’s Oct–Apr IBM seasonal pattern.
What should traders watch in this IBM seasonal window?
First, watch how IBM trades as the Oct 10 start date approaches relative to the historical IBM seasonal trend. A firm tone into late September and early October, especially if the stock can hold above its 50-day moving average near $238.54, would be more in line with the past midterm-year pattern than a renewed breakdown. Second, keep an eye on macro and policy catalysts that matter for enterprise tech budgets, including any updates on AI infrastructure spending, memory supply, and corporate capex plans, since those have been central to IBM’s recent earnings swings.[2][5]
Third, monitor whether the options market stays as active as it was in the weeks after the July crash. If elevated volume and rich implied volatility persist into the window, that would signal traders are still using options to bet on or hedge against large moves in IBM, which could amplify the kind of intra-window swings that past MAE and MFE readings have captured.[9][10][13] Finally, the cleanest confirmation of the historical pattern would be a steady grind higher through winter with pullbacks that stay contained versus prior midterm-year drawdowns; a flat or sharply negative Oct–Apr stretch would mark a clear break from the last 15 cycles and suggest that IBM’s AI transition and competitive landscape are rewriting the old playbook.
Sources
- CNBC - IBM is trying to rebound after results disappointed initially. What analysts and investors are saying - CNBC
- Yahoo Finance - IBM stock plummets more than 25% on Q2 earnings warning
- CNBC - IBM tops third-quarter estimates and lifts guidance, but stock drops - CNBC
- Forbes - What’s Happening With IBM Stock?
- Barron's - IBM Cuts Revenue Outlook Following Historic Stock Drop - Barron's
- Barron's - IBM Earnings Beat Estimates. The Stock Is Still Falling.
- Barron's - What’s Next for IBM Stock After 25% Collapse
- Yahoo Finance (Markets) - IBM stock crashes after major warning — here's what Wall Street is doing ...
- CNBC - Historic IBM stock crash sets up unique options strategy
- Barchart - IBM Options Data Summary for Intl Business Machines - Barchart.com
- Barchart - Are the Best Days Over for IBM Stock? What Price Volatility Tells Us and How You Can Trade IBM Now.
- Barchart - This IBM Stock Bull Spread Allows You to Take Advantage of the Market’s Fear
- Seeking Alpha - IBM options chain rewritten as at-the-money calls evaporate
About this seasonal analysis
Seasonal pattern data is sourced from TradeWave.ai, which analyzes historical price behavior across annual calendar windows going back up to 30 years. Read the full data methodology or the book The 100-Year Pattern by Afshin Moshrefi (2026 edition). Past performance of seasonal patterns does not guarantee future results. This article is for informational purposes only and does not constitute investment advice.