Cummins (CMI) Has Risen in 10 of 10 Midterm Fall-Winter Windows, Averaging 15.98% Gains
Cummins is heading toward a late-September seasonal window that has never been negative in the last 10 midterm election years, even as shares trade well below their 52-week high after a strong YTD run.
Price as of Sep 2, 2026: $550.90 (last close).

What is the seasonal pattern for Cummins (CMI)?
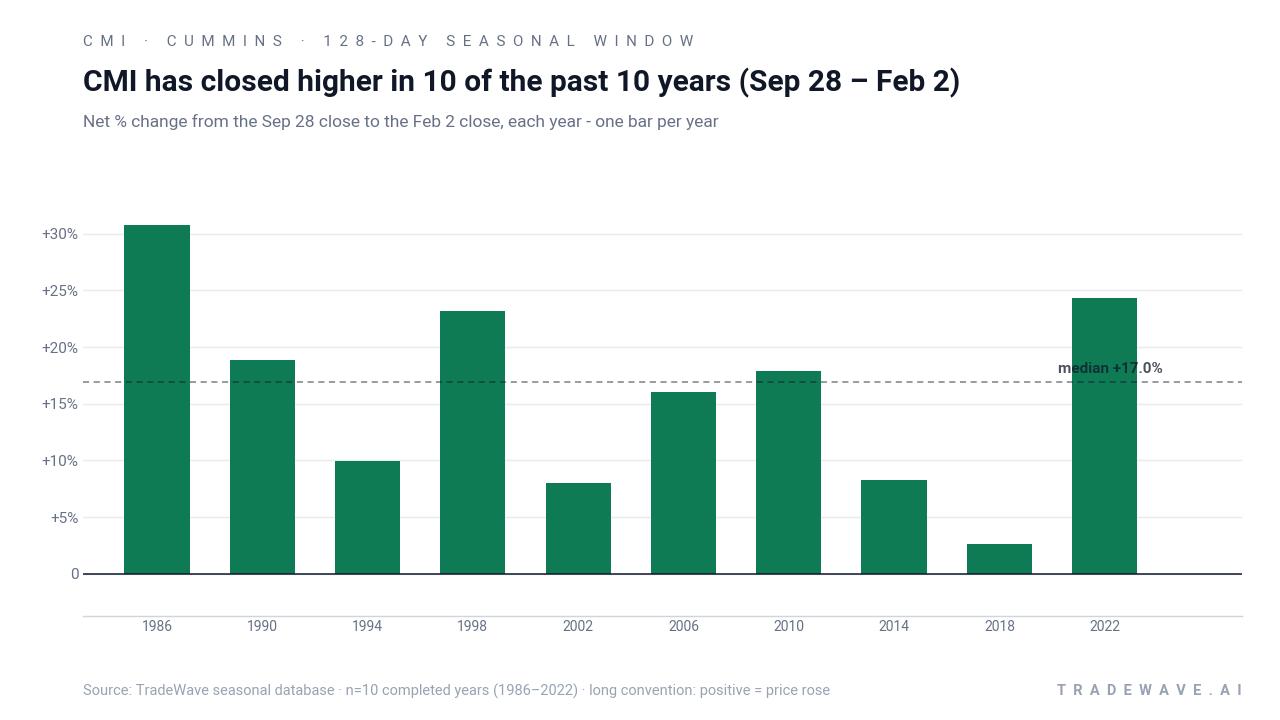
Cummins has risen in 10 of 10 midterm election years during the Sep 28 to Feb 2 window, with an average gain of 15.98% in winning years.
- 10 for 10 in this window, averaging 15.98% gains in winning years across the last 10 midterm election years.
- Seasonal window runs from Sep 28 through Feb 2, spanning 128 calendar days in the midterm election year.
- Percent Profitable is 100%, with 10 winners and 0 losers over the historical sample.
- Annualized return for the window clocks in at 15.69%, with a Sharpe ratio of 1.67 based on end-of-window outcomes.
- TradeWave Ratio of 2.44 signals that price has typically traveled meaningfully in the long direction within the window, even before final closes.
- Individual years have still seen notable drawdowns inside the window, with adverse moves as deep as about 17% before recovering.
According to historical data from TradeWave.ai, this upcoming stretch for Cummins behaves very differently from an average quarter, with a distinct election-cycle flavor that most investors never see in standard charts.
How has Cummins (CMI) traded in the late-September to early-February window?
Cummins has closed higher in every single Sep 28 to Feb 2 window across the last 10 midterm election years, averaging a 15.98% gain for long positions. Shares finished the prior session at $550.90, leaving the stock about 25.4% below its 52-week high of $737.76 even after a 28.7% advance year to date.[1][7] In the past month the stock has pulled back 13.34%, so the calendar is lining up a historically strong fall–winter stretch just as momentum cools off.
The grouping here matters. The pattern looks only at the last 10 midterm election years, which line up with the late part of the political cycle when policy uncertainty often starts to clear and industrial spending plans for the next administration begin to firm.
This seasonal window begins on Sep 28, 2026 and spans 128 days into early February. Historically, during this period, Cummins has shown a strong bullish tendency for long trades, with every midterm-year sample finishing in the green. The trade direction is explicitly long, so those positive returns line up with the intended side of the market.
Percent Profitable sits at 100%, with 10 winners and 0 losers across the sample. Average profit in those winning years is 15.98%, while the median outcome is 16.95%, which tells you the gains have not been driven by a single outlier year. Add it up and stacking the window across cycles compounds to a 329% cumulative return.
Intraperiod swings have still been meaningful. Maximum favorable moves inside the window have ranged from about 7.99% in 2018 to 38.3% in 2002, showing that some years delivered far more upside than the final close captured. On the downside, maximum adverse moves have stretched to about 17.02% in 2002 and 15.31% in 1990 before the stock recovered by the end of the window, so traders have had to sit through real drawdowns even in winning years.
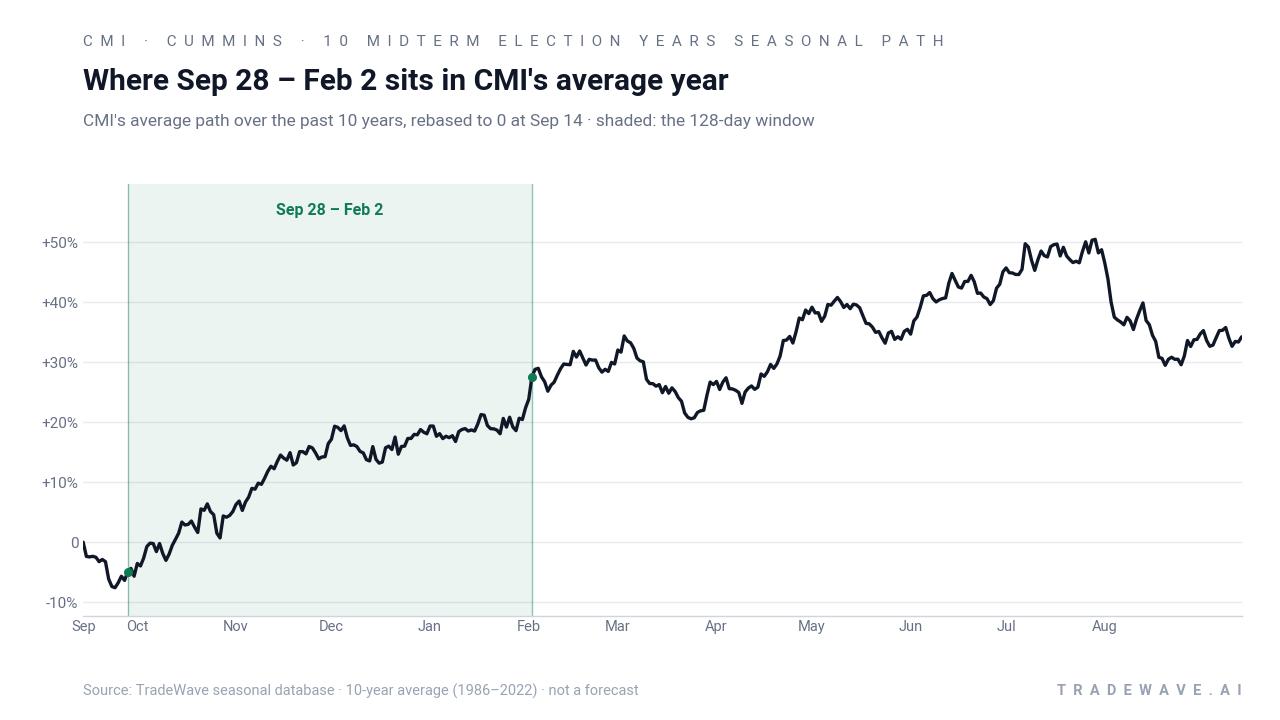
The historical path of returns tends to build over the life of the window rather than spike in a single week. Earlier midterm cycles like 1986 and 1998 saw strong double-digit gains, while more recent years such as 2018 still finished positive but with a modest 2.64% net move, suggesting the pattern has remained intact even as Cummins has grown into a much larger industrial name.
Yearly net and intraperiod ranges show how upside and drawdowns have coexisted inside this window.
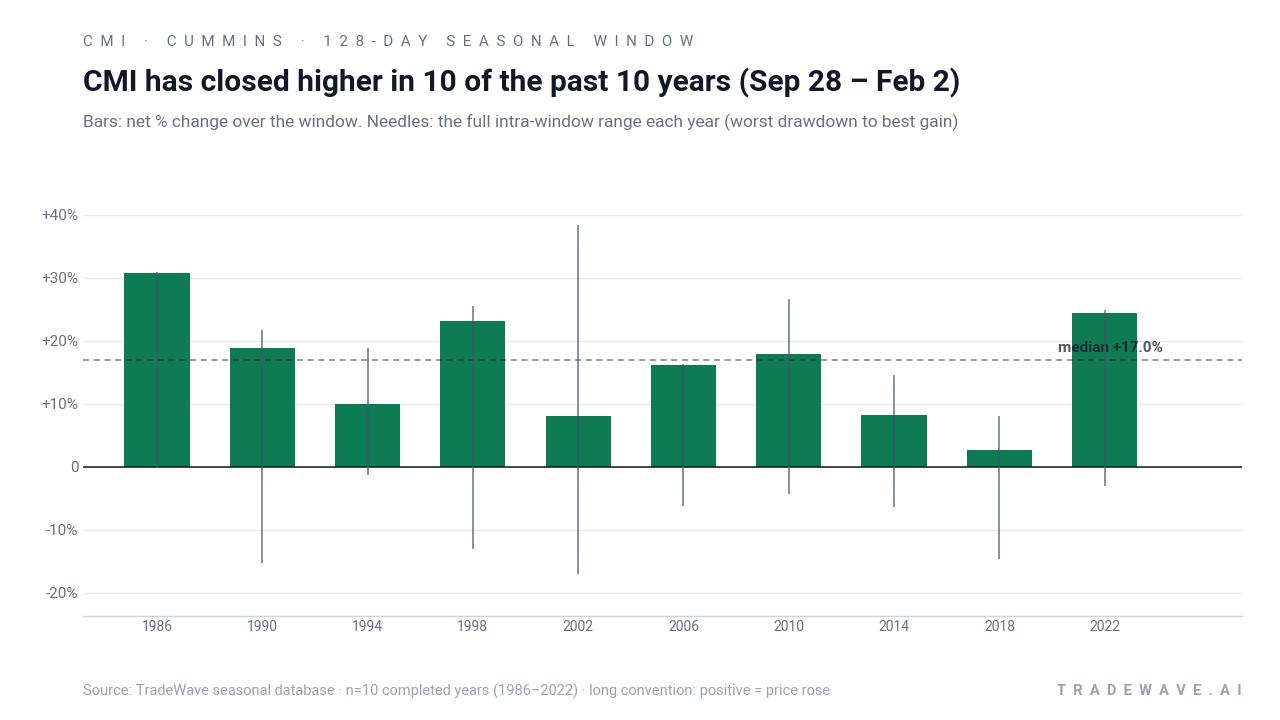
The combined picture is clear: in the last 10 midterm election years, this late-September to early-February window has been a perfect 10-for-10 for long exposure in Cummins, with sizable average gains but enough volatility inside the window that position sizing and risk controls still mattered.
Why does Cummins (CMI) follow this seasonal pattern?
One likely driver is the way Cummins’ order cycle and capital spending plans line up with the political calendar, as fleets and industrial customers firm up budgets heading into a new policy regime.[10] Analysts have also pointed to the company’s role in electrified powertrains and emissions technology, which can see renewed interest as midterm election noise fades and investors refocus on long-term infrastructure and decarbonization themes.[7][10] The pattern may also reflect institutional portfolio rebalancing into industrials during the late-year stretch of the midterm election year, when risk appetite has historically improved ahead of the stronger pre-election year.
History does not guarantee future results, and even in a 100% winning window, adverse excursions inside the period have at times been large enough to challenge unhedged positions.
What is driving Cummins (CMI) today?
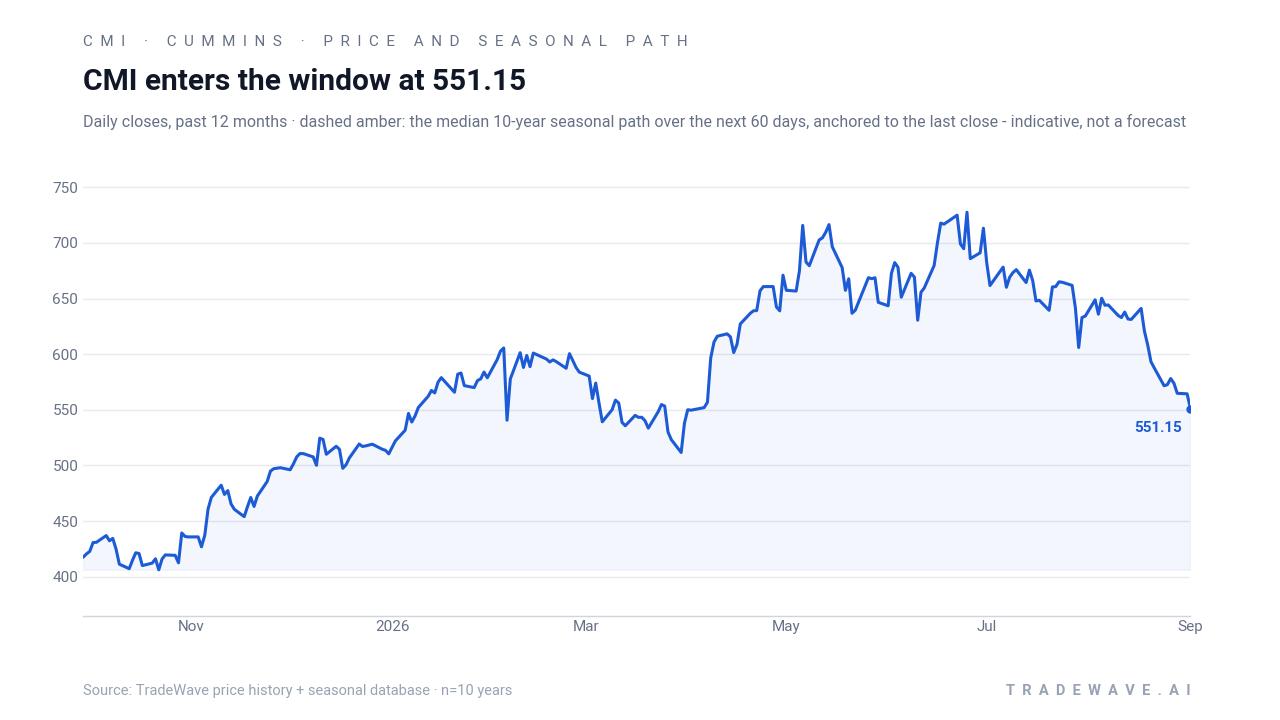
Cummins closed Thursday at $550.90, down 0.05% on the day, extending a roughly 13.34% slide over the past month even as the stock remains up 28.7% year to date and well below its 52-week high of $737.76.[1][7] The pullback follows a Q2 2026 earnings report on Aug 4 in which the company delivered revenue of $8.4 billion but missed EPS expectations, printing $6.73 versus a $7.33 consensus, which has weighed on sentiment after a powerful multi-quarter run.[5][6] At the same time, Cummins still carries a “Moderate Buy” consensus rating from Wall Street, with MarketBeat tracking a blended price target of $745.64 that sits comfortably above the current quote.[1][7][9]
On the corporate side, management has raised its 2030 financial targets, signaling confidence in long-term revenue growth and margin expansion even as near-term earnings wobble.[3] The company is leaning into electrified powertrains and related components, positioning itself as a key player in the transition away from pure internal combustion engines, a theme that has drawn institutional interest across the industrial and automotive complex.[7][10] In that context, the recent drawdown looks more like a reset inside a longer uptrend than a fundamental break in the story.
Positioning and insider activity add nuance. MarketBeat data show that institutional investors such as Cibc World Market Inc. and Man Group plc have been adding to Cummins positions in 2026, even as insider transactions tilt toward selling, including a disclosed sale of 698 shares by Vice President Earl Newsome on Aug 24, 2026 for roughly $399,410.[8][10] That mix of institutional accumulation and modest insider selling is not unusual after a strong run, but it does mean traders will be watching whether the recent weakness attracts more long-term buyers into the seasonal window.
The chart below situates the latest pullback against the past year’s rally and the median seasonal path over the next 60 days.
What should traders watch as this Cummins (CMI) window approaches?
First, the calendar. The 128-day window opens on Sep 28, placing Cummins in the concluding stretch of the midterm election year and then into early 2027, which will be the year before the presidential election. Historically, that transition has been a friend to industrial cyclicals, and Cummins’ 10-for-10 record in this specific slice of the calendar reflects that backdrop.
Second, price behavior into the start date. The stock is already well off its 52-week high and below its 50-day moving average of $642.03, with average 20-day volume around 799,473 shares, so traders will be watching whether selling pressure fades or accelerates as Sep 28 approaches.[1][7] A stabilization or base-building phase into late September would rhyme with prior cycles where the strongest gains often came after a period of consolidation.
Third, the earnings and policy calendar. Cummins’ next earnings call on Nov 5, 2026 lands squarely inside the seasonal window, and management’s commentary on demand for engines, power systems and electrified platforms will be a key test of whether the long-term 2030 targets still feel credible to investors.[3][6][10] Any shift in fiscal or regulatory tone around infrastructure, emissions or heavy-duty transport as the political cycle evolves could also influence how closely this iteration tracks the historical pattern.
Finally, watch the balance between institutional flows and insider activity. Recent filings show large asset managers adding to Cummins, while insiders have been modest net sellers over the past three months.[8][9][10] If institutional buying persists into and through the window, and insider selling does not accelerate, that would be more consistent with the historical pattern of strength; a reversal in those flows would be an early sign that this cycle might diverge from the 10-for-10 record.
Sources
- Yahoo Finance - Cummins Inc. (CMI) Stock Price, News, Quote & History - Yahoo Finance
- Yahoo Finance / Simply Wall St (article hosted on Yahoo) - Cummins (CMI) Stock Looks Reasonably Priced After Earnings Beat Hopes
- Yahoo Finance - Raymond James Raises its Price Target on Cummins (CMI)
- Yahoo Finance / Simply Wall St (article hosted on Yahoo) - A Look At Cummins (CMI) Valuation After A Powerful One Year Share Price Run
- Yahoo Finance / Zacks (article hosted on Yahoo) - Cummins (CMI) Q1 Earnings and Revenues Beat Estimates
- Public.com - Cummins (CMI) Earnings: Latest Report, Earnings Call & Financials
- MarketBeat - Cummins (CMI) Stock Price, News & Analysis - MarketBeat
- MarketBeat - Man Group plc Acquires Shares of 187,497 Cummins Inc. $CMI
- MarketBeat - Cummins Inc. (NYSE:CMI) Receives Consensus Rating of "Moderate Buy" from Brokerages
- MarketBeat - Cibc World Market Inc. Purchases Shares of 23,018 Cummins Inc. $CMI
About this seasonal analysis
Seasonal pattern data is sourced from TradeWave.ai, which analyzes historical price behavior across annual calendar windows going back up to 30 years. Read the full data methodology or the book The 100-Year Pattern by Afshin Moshrefi (2026 edition). Past performance of seasonal patterns does not guarantee future results. This article is for informational purposes only and does not constitute investment advice.