Copart (CPRT) Has Rallied in 7 of 7 Midterm Fall Windows, Averaging 9.03% Gains
Copart is heading toward an October 6 seasonal window that has delivered gains in every midterm election year in the sample, even as shares trade well below their 52-week high after a sharp pullback.
Price as of Sep 8, 2026: $32.60 (last close).

What is the seasonal pattern for Copart (CPRT)?
Copart has risen in 7 of 7 midterm-year fall windows starting October 6, with an average gain of 9.03% in winning years.
- 7 for 7 in this window, with Copart averaging 9.03% gains across the last 7 midterm election years.
- The upcoming 54-day Copart trading window runs from Oct 6 to Nov 28 and has historically favored long positions.
- Percent Profitable is 100%, with 7 winners and 0 losers across the lookback sample.
- Average profit in winning years is 9.03%, stacking to an 81% cumulative return when the window is repeated over all 7 years.
- Intraperiod swings have been meaningful, with individual years showing double-digit peak gains alongside notable drawdowns before finishing higher.
- The pattern sits in the concluding midterm election year and bridges into the historically stronger pre-election phase for U.S. equities.
According to historical data from TradeWave.ai, this specific October-to-November stretch has behaved very differently from an average month for Copart, and the next iteration is less than a month away.
How has Copart (CPRT) traded in the upcoming October 6 seasonal window?
Copart has risen in 7 of 7 midterm election years during the 54-day window that starts on Oct 6, averaging 9.03% gains and compounding to an 81% cumulative return across the sample. Today the stock closed at 32.60, down 3.3% on the day and about 33.7% below its 52-week high of 49.16, even after a 16.73% gain year to date.[1][2] That mix of a strong historical seasonal trend and a stock trading well off its highs gives this fall window unusual weight for traders watching the industrials seasonal outlook.
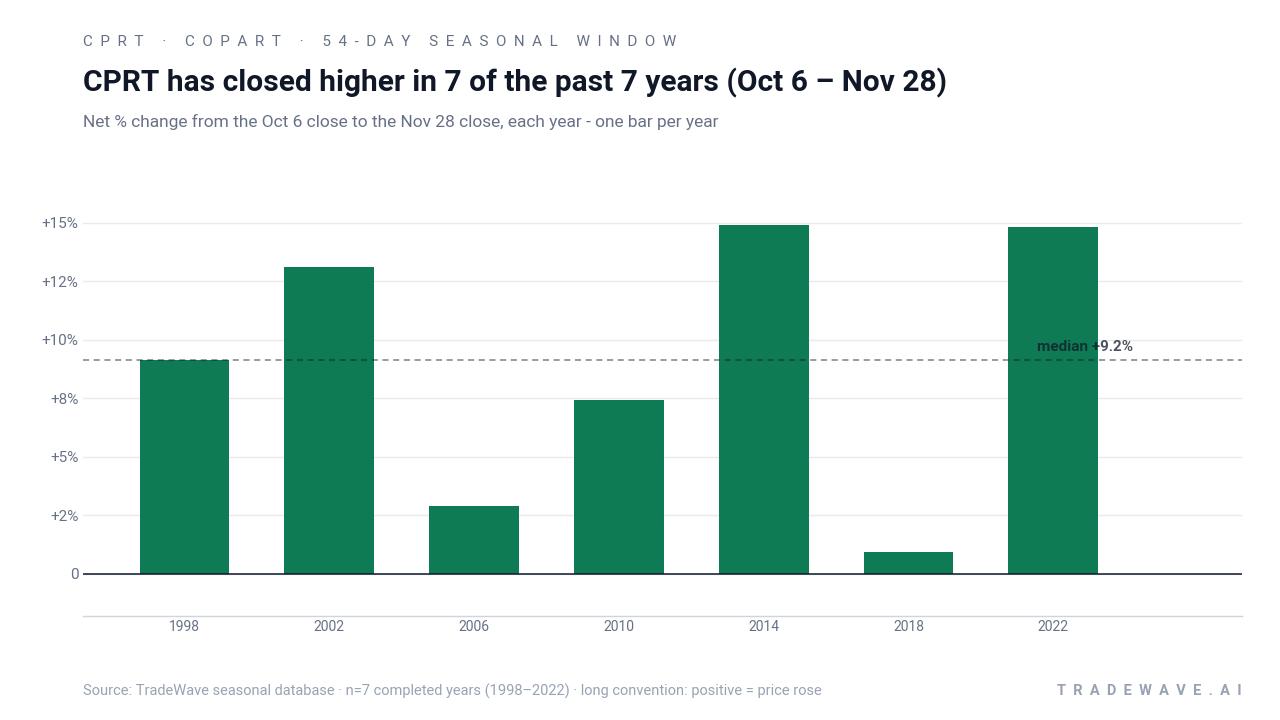
Grouping the data by the presidential election cycle matters here because this window only looks at the last 7 midterm election years, a phase that often features policy uncertainty, shifting fiscal priorities and sector rotation before the typically stronger pre-election year. For Copart, that filter isolates a stretch where the stock’s October-to-November behavior has been consistently positive despite very different macro backdrops across 1998, 2002, 2006, 2010, 2014, 2018 and 2022.
Across those seven midterm-year windows, Copart’s average gain of 9.03% comes with a median profit of 9.15%, which tells you the typical outcome has been close to the mean rather than skewed by a single outlier year. The strongest years in this Copart trading window were 2014 and 2022, with net returns of 14.89% and 14.83% respectively, while the softest still-positive outcome was 0.94% in 2018. Even the smallest win kept the 100% hit rate intact for this CPRT seasonal trend.
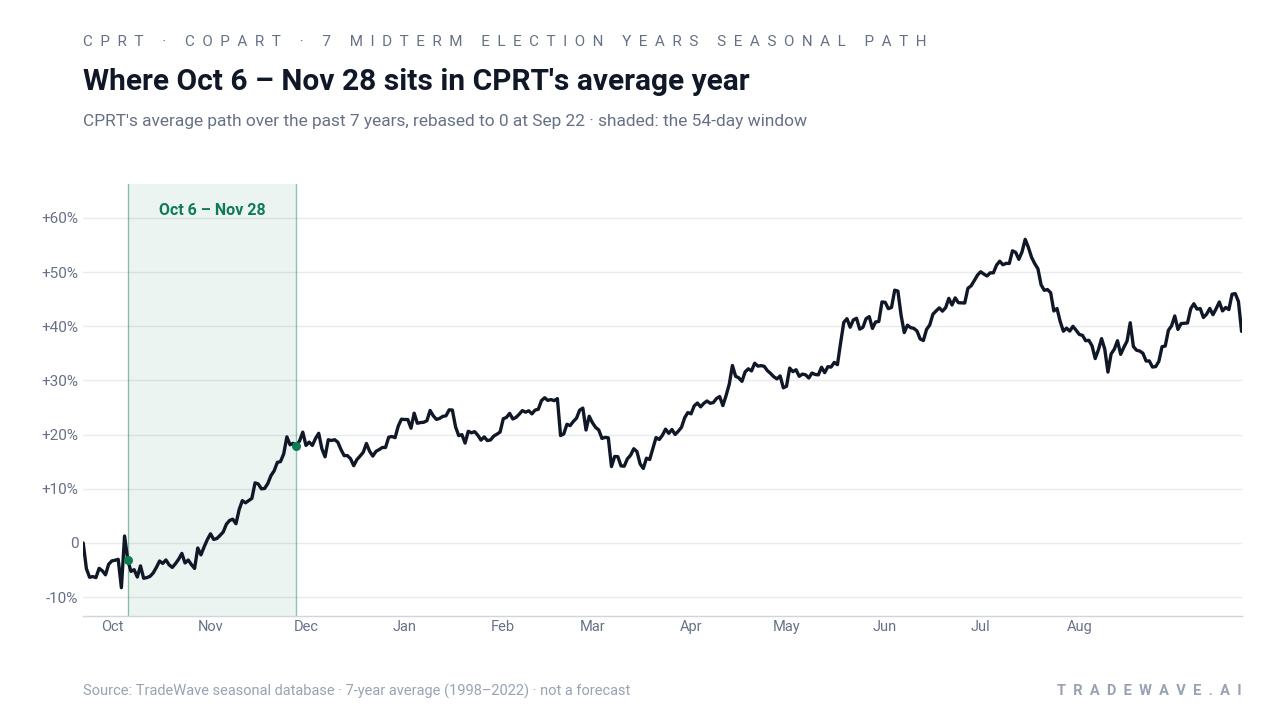
A second view shows how much Copart has typically swung inside the window before locking in those gains.
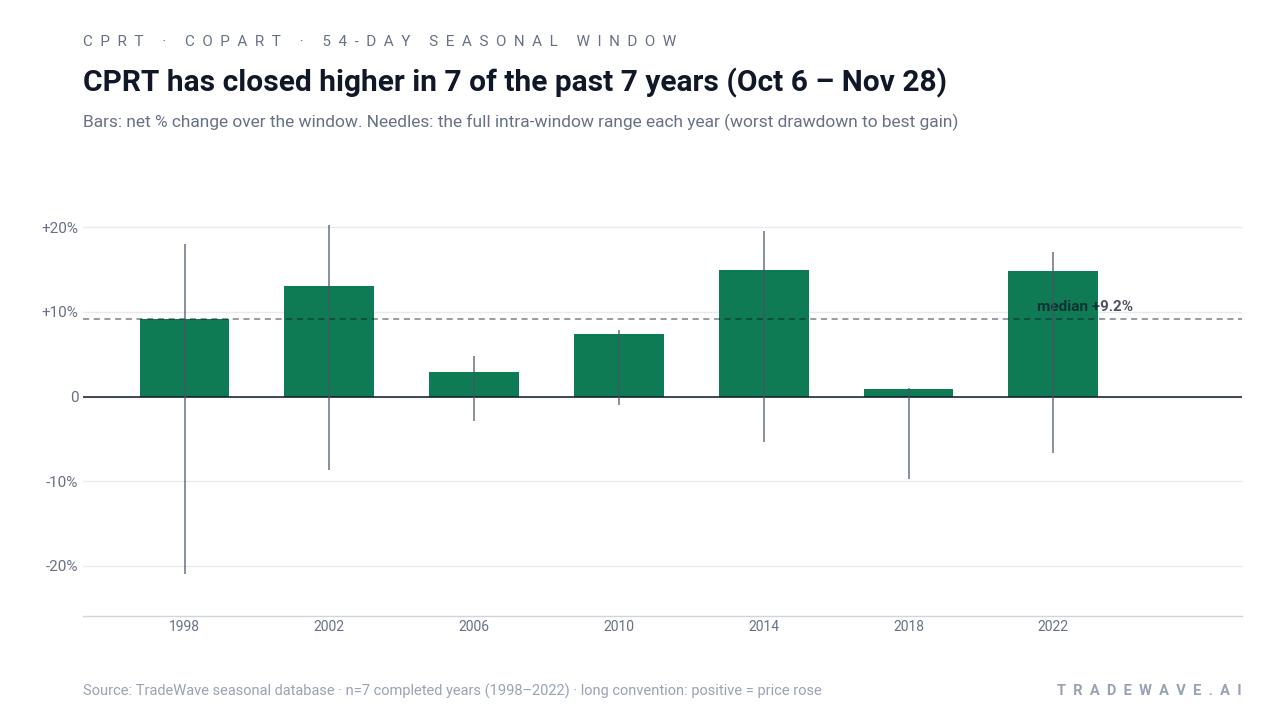
The maximum favorable move, or best point-to-peak gain within the window, has often run well ahead of the final close, with years like 1998 and 2014 seeing intra-window rallies near or above 18% before settling back. On the flip side, the maximum adverse move, or worst drawdown from entry, has at times been sharp, including a roughly 20.93% intraperiod drop in 1998 and a 9.72% slide in 2018 before the stock recovered to finish higher. That mix of strong MFE and sizable MAE means this Copart seasonal pattern has rewarded patience but has not been a smooth ride.
Looking across the cumulative chart, stacking this 54-day window year after year would have produced an 81% compounded gain over the seven midterm election years in the sample. Add it up and you get a pattern that has favored long exposure in this specific fall slice of the calendar, even when the broader market or industrials sector backdrop was choppy. The key takeaway is simple: seven for seven, with mid-teens upside in the best years and positive outcomes even in tougher tapes.
History does not guarantee future results; adverse excursions can be large even in winning windows, and traders still face the risk that this pattern breaks in the next cycle.
Why does Copart (CPRT) follow this seasonal pattern?
One likely driver is the clustering of Copart’s fiscal reporting and guidance updates around the fall, which can reset expectations for salvage volumes, pricing and margins heading into the new calendar year.[2][4] Analysts have also pointed to institutional portfolio repositioning in industrials during the late stages of midterm election years, as investors look ahead to the historically stronger pre-election year and rotate into quality compounders.[3][5] This Copart seasonal trend may reflect that combination of earnings visibility and election-cycle positioning rather than any single recurring catalyst.
What is driving Copart (CPRT) today?
Copart shares closed at 32.60 on Sep 9, down 3.3% on the day, leaving the stock about 33.7% below its 52-week high of 49.16 even after a 16.73% gain so far in 2026.[1][2] The pullback comes as investors digest a strong May quarter, when Copart reported Q3 fiscal 2026 earnings per share of $0.43 versus a $0.41 estimate and revenue of $1.24 billion, alongside profit margins near 32.5%.[1][4] With the next earnings report scheduled around Sep 8 for the same fiscal year, traders are weighing whether that growth cadence can continue against a backdrop of mixed broader market sentiment and a consensus “Buy” rating with an average price target of 44.1 from Zacks and Yahoo Finance, which still sits well above the current share price.[1][2][5]
The chart below situates the latest move against the past year of trading and the historical seasonal projection.
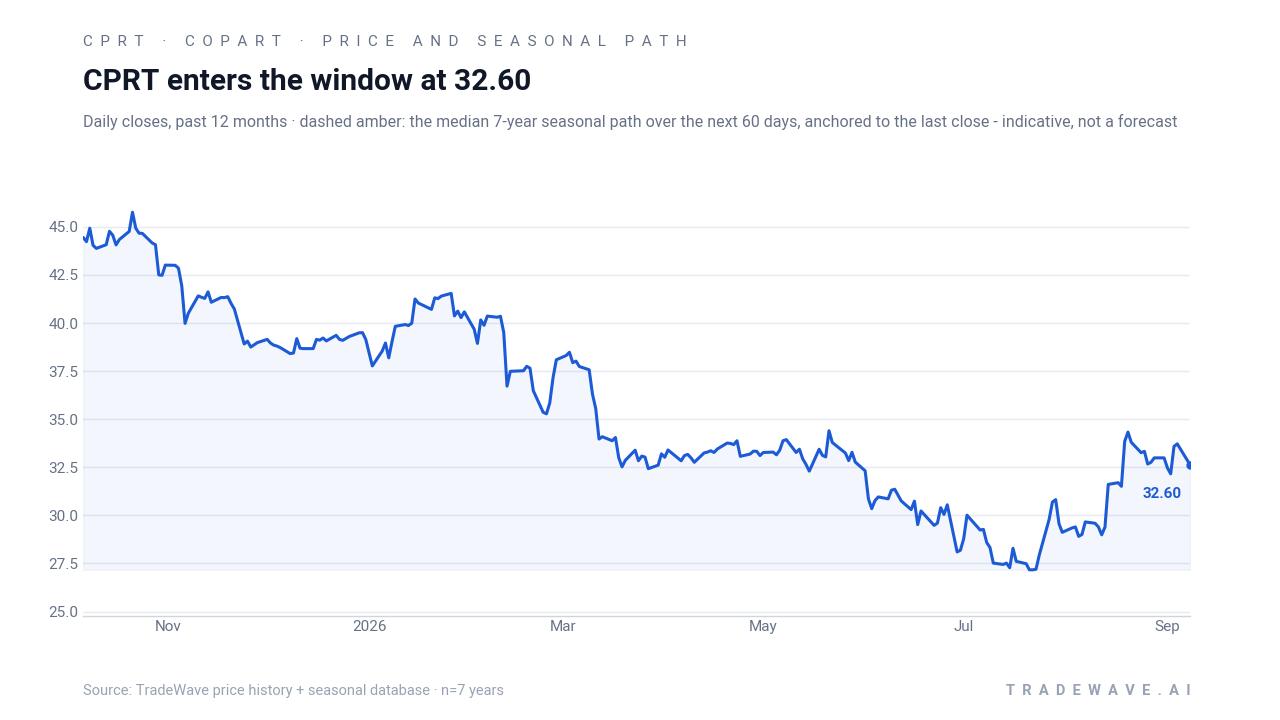
From a sector standpoint, Copart sits in the industrials bucket under “Specialty Business Services,” a niche that has held up relatively well as investors look for durable cash flows and less rate-sensitive growth.[1][2] That positioning has helped the stock outperform many cyclicals year to date, but the recent slide shows that even steady compounders can see sharp repricing when expectations get crowded or macro worries flare. With the stock now trading below its 50-day moving average of 30.12 on healthy volume and still well off its 52-week peak, the upcoming October 6 Copart trading window will arrive with sentiment reset and room on the chart for either a seasonal bounce or a break from the pattern.[1][2]
What should traders watch as the October 6 Copart window approaches?
First, the earnings update around Sep 8 will set the tone for how investors treat any seasonal tailwind, especially if revenue growth or margins surprise relative to expectations.[1][4] Second, the 30 to 34 zone around the current price and the 50-day moving average near 30.12 are key levels; how Copart behaves around those marks into early October will show whether buyers are willing to lean into the historical seasonality or stay cautious.[1][2] Third, watch how the stock trades once the Oct 6 window opens: in prior midterm years, strong maximum favorable moves have often come with sizable drawdowns inside the 54-day span, so a fast rally with contained downside would be more in line with the historical pattern than a slow grind with repeated undercuts. Finally, if the stock fails to respond positively during a window that has been 7 for 7 in the past, that would be a clear sign that the Copart seasonal trend is weakening and that fundamentals or macro forces are taking the driver’s seat this cycle.
Sources
- Yahoo Finance - Copart, Inc. (CPRT) Stock Price, News, Quote & History - Yahoo Finance
- Public.com - Buy Copart Stock – CPRT Stock Quote Today & Investment Insights - Public.com
- Yahoo Finance (Zacks article) - Copart, Inc. (CPRT) Stock Sinks As Market Gains: Here's Why
- Public.com (earnings page) - Copart (CPRT) Earnings: Latest Report, Earnings Call & Financials
- Zacks - What is the current Price Target and Forecast for Copart (CPRT)
About this seasonal analysis
Seasonal pattern data is sourced from TradeWave.ai, which analyzes historical price behavior across annual calendar windows going back up to 30 years. Read the full data methodology or the book The 100-Year Pattern by Afshin Moshrefi (2026 edition). Past performance of seasonal patterns does not guarantee future results. This article is for informational purposes only and does not constitute investment advice.